King's Own Institute: Corporate Financial Management Report - FIN200

Verified

Added on  2022/08/23

|9
|2020
|19
Report
AI Summary
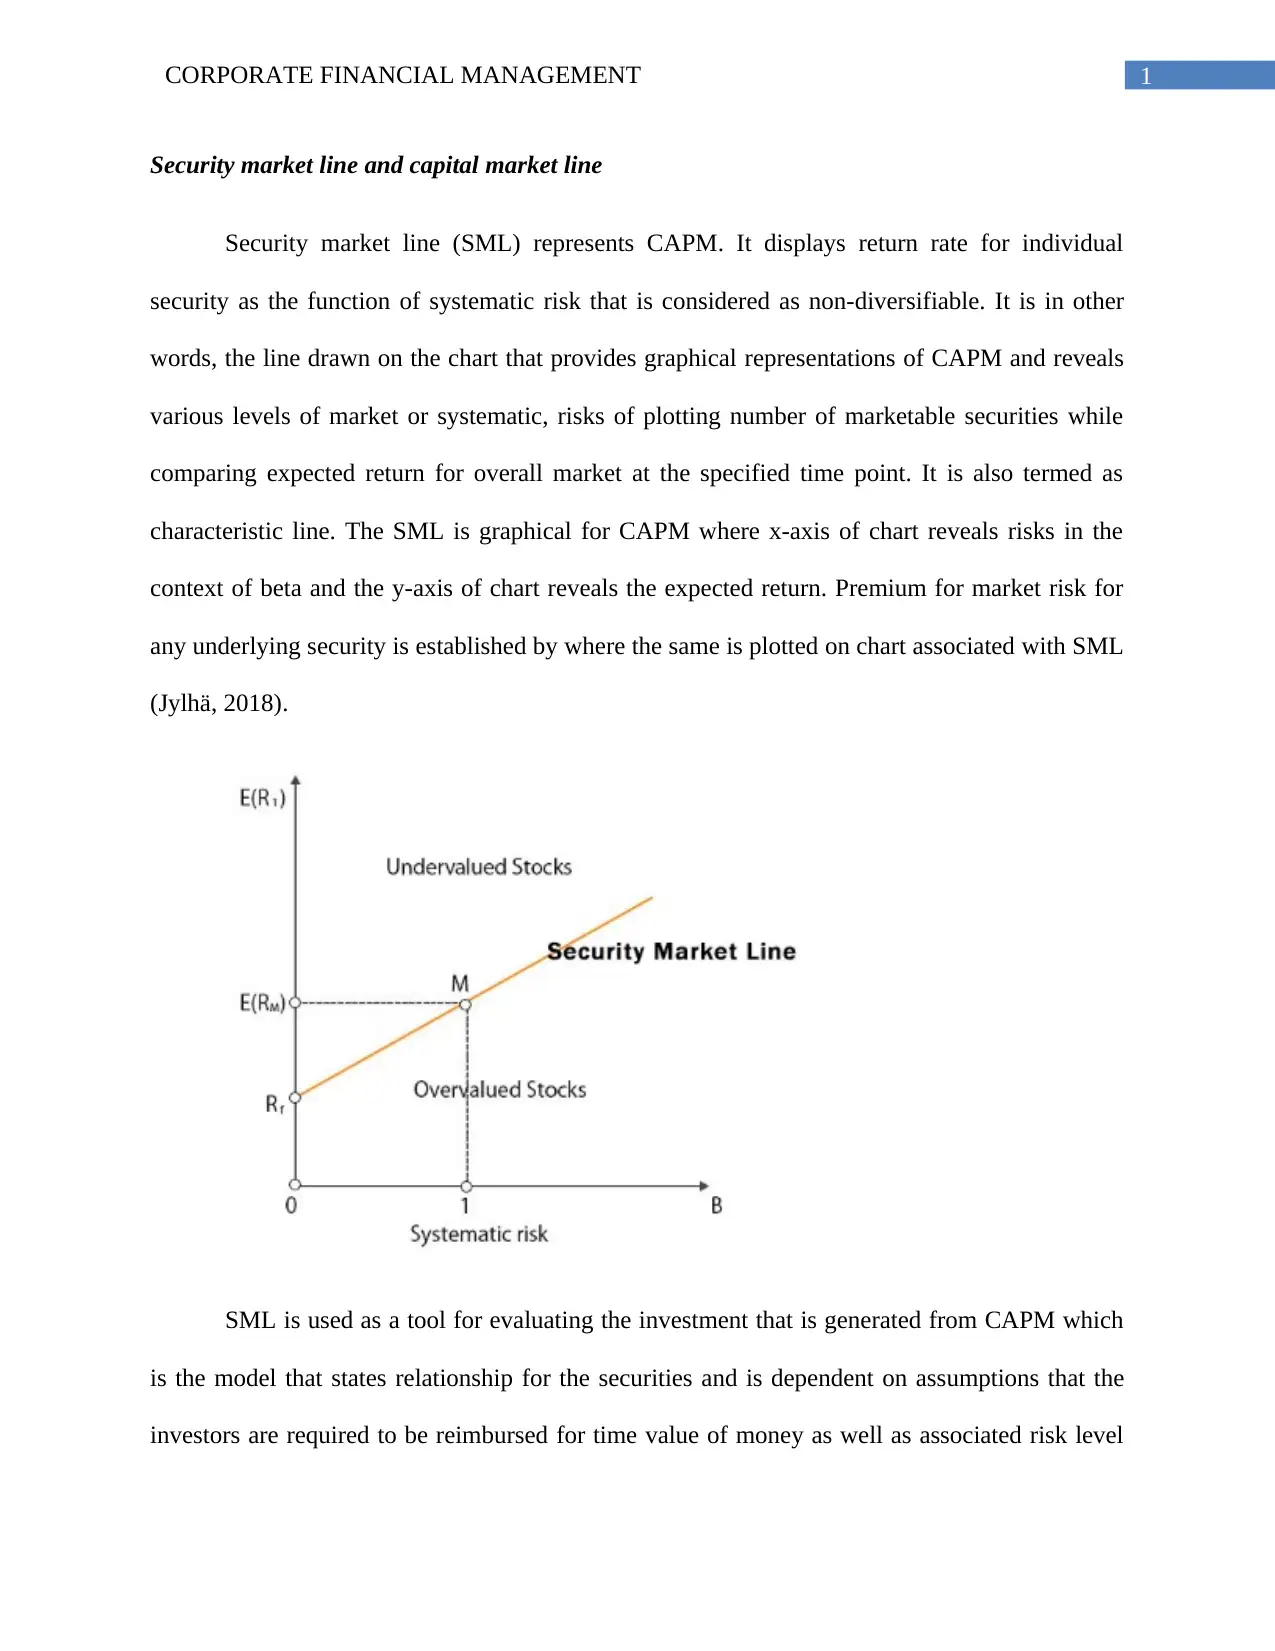
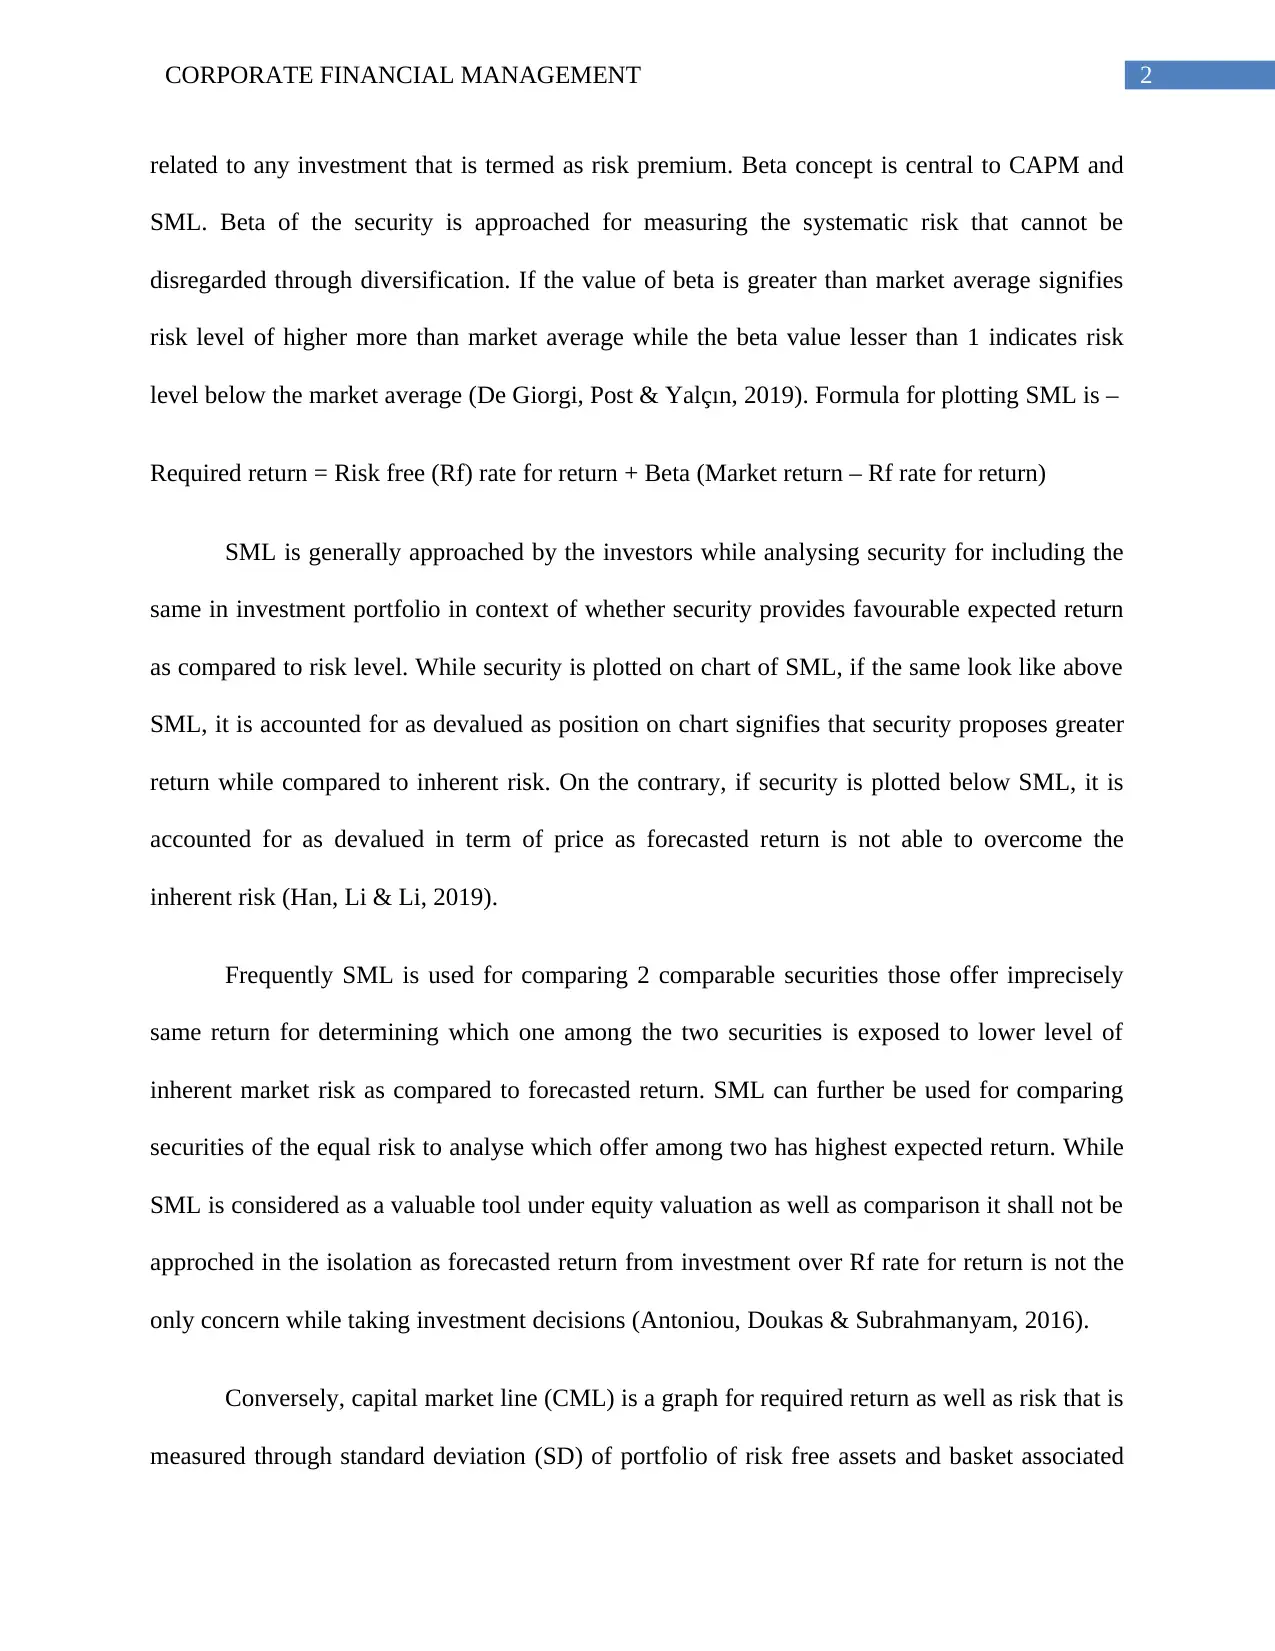
This report delves into the core concepts of Corporate Financial Management, specifically examining the Security Market Line (SML) and the Capital Market Line (CML). The report begins by defining the SML as a graphical representation of the Capital Asset Pricing Model (CAPM), illustrating the relationship between expected return and systematic risk (beta). It explains how the SML is used to evaluate investments based on their position relative to the line, indicating whether a security is undervalued or overvalued. The report then contrasts the SML with the CML, which measures risk through standard deviation and represents efficient portfolios. It highlights the differences in how risk is measured (beta vs. standard deviation) and the types of portfolios each line defines. Furthermore, the report outlines the formulas used to plot both lines and discusses their applications in investment analysis, including comparing securities and assessing their risk-return profiles. It also touches upon the limitations of using these tools in isolation and concludes by emphasizing the importance of understanding both SML and CML for effective corporate financial management. The report includes the differences between the SML and CML with the help of graphical representations.
Document Page
Running head: CORPORATE FINANCIAL MANAGEMENT
Corporate financial management
Name of the student
Name of the university
Student ID
Author note
tabler-icon-diamond-filled.svg

Paraphrase This Document

Need a fresh take? Get an instant paraphrase of this document with our AI Paraphraser
Document Page
1CORPORATE FINANCIAL MANAGEMENT
Security market line and capital market line
Security market line (SML) represents CAPM. It displays return rate for individual
security as the function of systematic risk that is considered as non-diversifiable. It is in other
words, the line drawn on the chart that provides graphical representations of CAPM and reveals
various levels of market or systematic, risks of plotting number of marketable securities while
comparing expected return for overall market at the specified time point. It is also termed as
characteristic line. The SML is graphical for CAPM where x-axis of chart reveals risks in the
context of beta and the y-axis of chart reveals the expected return. Premium for market risk for
any underlying security is established by where the same is plotted on chart associated with SML
(Jylhä, 2018).
SML is used as a tool for evaluating the investment that is generated from CAPM which
is the model that states relationship for the securities and is dependent on assumptions that the
investors are required to be reimbursed for time value of money as well as associated risk level
Document Page
2CORPORATE FINANCIAL MANAGEMENT
related to any investment that is termed as risk premium. Beta concept is central to CAPM and
SML. Beta of the security is approached for measuring the systematic risk that cannot be
disregarded through diversification. If the value of beta is greater than market average signifies
risk level of higher more than market average while the beta value lesser than 1 indicates risk
level below the market average (De Giorgi, Post & Yalçın, 2019). Formula for plotting SML is –
Required return = Risk free (Rf) rate for return + Beta (Market return – Rf rate for return)
SML is generally approached by the investors while analysing security for including the
same in investment portfolio in context of whether security provides favourable expected return
as compared to risk level. While security is plotted on chart of SML, if the same look like above
SML, it is accounted for as devalued as position on chart signifies that security proposes greater
return while compared to inherent risk. On the contrary, if security is plotted below SML, it is
accounted for as devalued in term of price as forecasted return is not able to overcome the
inherent risk (Han, Li & Li, 2019).
Frequently SML is used for comparing 2 comparable securities those offer imprecisely
same return for determining which one among the two securities is exposed to lower level of
inherent market risk as compared to forecasted return. SML can further be used for comparing
securities of the equal risk to analyse which offer among two has highest expected return. While
SML is considered as a valuable tool under equity valuation as well as comparison it shall not be
approched in the isolation as forecasted return from investment over Rf rate for return is not the
only concern while taking investment decisions (Antoniou, Doukas & Subrahmanyam, 2016).
Conversely, capital market line (CML) is a graph for required return as well as risk that is
measured through standard deviation (SD) of portfolio of risk free assets and basket associated
Document Page
3CORPORATE FINANCIAL MANAGEMENT
with risky assets that provides best trade-off for risk return. It is the exceptional case for capital
allocation line that is curved to efficient frontier as well as the slope of line for allocating the
capital represented by Sharpe ratio. A portfolio that is well diversified for risky assets has nil
unsystematic risk. That point that represents lowest risk on the efficient frontier is known as
global minimum portfolio for variance. If the investor has option of borrowing as well as lending
at Rf rate, he may generate asset allocation that is the mix of Rf assets as well as portfolio for the
risky portfolio. Rf asset has zero risk that is zero standard deviation (Sembiring, et al., 2016). For
instance, US treasury assets can be considered as the Rf assets for the purpose of analysis.
Expected return from portfolio of risk free asset as well as portfolio for risky assets can
be established through following formula –
E(R) = wr X rr + (1 – wr) X rp
Where, wr is weight of Rf asset, rf is risk free return rate and rp is return on risky assets
portfolio.
tabler-icon-diamond-filled.svg

Paraphrase This Document

Need a fresh take? Get an instant paraphrase of this document with our AI Paraphraser
Document Page
4CORPORATE FINANCIAL MANAGEMENT
SD for the portfolio of Rf assets as well as risky assets can be stated through the
following formula –
Where w is the weight for Rf asset, σp is SD for portfolio of the risky asset and ρ is
correlation coefficient for returns in context of the Rf asset as well as portfolio for risky assets
(Sharpe, 2017). As Rf asset has nil SD and the correlation with the portfolio of risky asset is
zero, above equation is simplified as –
After performing some mathematical manipulation following equation can be arrived that
represents capital allocation line –
Where, E(R) signifies expected return for Rf asset as well as risky asset, rf is Rf rate, σP is
standard deviation for portfolio of the risky assets and σ is SD of new portfolio that includes
both risky assets as well as Rf rate. Factor of (E(R) – rf)/σP) values return in apart from Rf rate
per unit of the risk. It is also known as rewards to risk ratio. Further, it is slope of the line for
allocating capital.
Sometimes the CML is confused with SML however, the SML is derived from CML.
Whereas CML represents return rate for particular portfolio SML shows risk as well as return
Document Page
5CORPORATE FINANCIAL MANAGEMENT
from market at particular point of time and reveals expected return for individual assets. While
risk associated with CML is measured through SD of the returns, in SML risk is measured
through beta or systematic risk. Securities those are priced fairly are plotted on SML and CML.
Securities those are plotted above CML or SML generates return those are significantly high for
given risk and are undervalued. Conversely, securities those are plotted below the SML or CML
generate returns those are too low for given risk and are overvalued (Vortelinos, 2015).
Under standard assumption and in presence of Rf investment, CAPM can be described
through 2 equations –
CML provides set of the efficient portfolios and is depicted through return as well as
standard deviation space. Standard deviation is used to measure total risk under setting.
While any Rf asset is there each efficient portfolio will be combination among market
portfolio and risk free investment. Market portfolio is cuved portfolio from the line that
begins from Rf rate and curved to efficient frontier from risky assets only. The CML
describes the optimal portfolios. As the optimal portfolios are diversified, hence only 1
stock will not be part of CML. All the mean variance investors will hold the optimal
portfolios however CML does not assist to price anything that is not optimal (Raja,
Chocha & Lalakiy, 2017).
2nd relationship is in context of linking returns with market beta. It is the measure for
systematic risk. In accordance with this, the relationship shall hold for each of the assets.
It is immaterial whether the asset is diversified or non-diversified. Both individual stock
as well as optimal portfolio shall be somewhere in the line. The line is designated through
the equation E(r)-rf=beta*[E(rm)-rf]. Where, r is return on specific asset, rf is return on
risk free rate, rm is return on market portfolio and beta is the sensitivity of asset to the
Document Page
6CORPORATE FINANCIAL MANAGEMENT
market risk. The equation is considered as crucial for asset pricing as well as for
corporate finance as with the provide beta for any asset that is the systematic risk level,
expected return can be backed out (Raja, Chocha & Lalakiy, 2017).
Major differences among CML and SML those can be highlighted are as follows –
CML is graphical representation for CAPM that represents relationship among expected
return from the portfolio that is efficient and total risk associated with them. Conversely,
SML is graphical illustration for CAPM that represents relationship among required
return from individual security as the function of systematic risk that is considered as
non-diversifiable (Bajpai & Sharma, 2015).
CML is used to measure risks through the SD or through the total risk factor.
Conversely, SML measures risks through beta that assists in identifying the risk
contribution of security for portfolio.
Graph for CML defines the efficient portfolios whereas graph for SML defines both
efficient as well as non-efficient portfolios (Williams & Dobelman, 2017).
Y-axis of CML shows forecasted return and X-axis shows SD or risk level whereas Y-
axis of SML shows level for required return in context of individual assets and X-axis
represents risk level that is represented by beta (Bajpai & Sharma, 2015).
CML signifies Rf assets as well as market portfolio whereas SML determines overall
security factors. Unlike the CML, the SML represents expected returns for individual
assets. CML determines return or risk for the portfolios those are efficient whereas SML
demonstrates return or risk for the individual stock (Williams & Dobelman, 2017).
Reference
tabler-icon-diamond-filled.svg

Paraphrase This Document

Need a fresh take? Get an instant paraphrase of this document with our AI Paraphraser
Document Page
7CORPORATE FINANCIAL MANAGEMENT
Antoniou, C., Doukas, J.A. and Subrahmanyam, A., 2016. Investor sentiment, beta, and the cost
of equity capital. Management Science, 62(2), pp.347-367.
Bajpai, S. and Sharma, A.K., 2015. An empirical testing of capital asset pricing model in
India. Procedia-Social and Behavioral Sciences, 189, pp.259-265.
De Giorgi, E.G., Post, T. and Yalçın, A., 2019. A concave security market line. Journal of
Banking & Finance, 106, pp.65-81.
Han, X., Li, K. and Li, Y., 2019. Investor Overconfidence and the Security Market Line: New
Evidence from China. Macquarie University Faculty of Business & Economics Research Paper.
Jylhä, P., 2018. Margin requirements and the security market line. The journal of finance, 73(3),
pp.1281-1321.
Raja, A.B.H.A.Y., Chocha, P.R.I.Y.A. and Lalakiy, N., 2017. Testing Capital Assets Pricing
Model as a Tool for Predicting Stock Returns: An Empirical Study in the Indian
Context. NMIMS Journal of Economics and Public Policy, II (1), pp.10-16.
Sembiring, F.M., Rahman, S., Effendi, N. and Sudarsono, R., 2016. Capital asset pricing model
in market overreaction conditions: evidence from Indonesia Stock Exchange. Polish Journal of
Management Studies, 14.
Sharpe, W., 2017. Capital Market Theory, Efficiency, and Imperfections. Quantitative Financial
Analytics: The Path to Investment Profits, 445.
Vortelinos, D.I., 2015. The Greek equity market in European equity portfolios. Economic
Modelling, 49, pp.144-153.
Document Page
8CORPORATE FINANCIAL MANAGEMENT
Williams, E.E. and Dobelman, J.A., 2017. Capital Market Theory, Efficiency, and
Imperfections. World Scientific Book Chapters, pp.445-510.
chevron_up_icon
1 out of 9
circle_padding
hide_on_mobile
zoom_out_icon
[object Object]