FIN200 Corporate Finance Report: CML, SML, Minimum Variance
VerifiedAdded on 2022/08/27
|12
|2509
|17
Report
AI Summary
This report delves into key aspects of corporate finance, differentiating between the Capital Market Line (CML) and the Security Market Line (SML) and exploring their applications in investment analysis. It provides a detailed explanation of minimum variance portfolios, highlighting their role in managing risk and return. Furthermore, the report examines the Capital Asset Pricing Model (CAPM), illustrating its use in evaluating the required rate of return on investments. Through graphical representations and in-depth analysis, the report aims to equip investors with the knowledge needed to make informed decisions regarding stock valuation and portfolio management. It covers the evaluation of stocks, the impact of market imperfections, and the significance of CAPM in comparison to WACC. The report concludes by summarizing the key concepts and emphasizing the importance of these financial tools in increasing shareholder value.
Running head: CORPORATE FINANCIAL MANAGEMENT
CORPORATE FINANCIAL MANAGEMENT
Name of the Student
Name of the University
Author Note
CORPORATE FINANCIAL MANAGEMENT
Name of the Student
Name of the University
Author Note
Paraphrase This Document
Need a fresh take? Get an instant paraphrase of this document with our AI Paraphraser
1
CORPORATE FINANCIAL MANAGEMENT
1. Introduction
The report that is being prepared is on the aspects of corporate finance that will
describe all the differences between the Capital Market Line (CML) and Security Market
Line (SML) and there is also a further explanation of minimum variance portfolios and
Capital Asset Pricing Model (CAPM). For the investment purpose, these tools are used by the
investors so that they can get a clear idea about the status of the stocks on which they will
invest and also help in decision making. In the first part of the report, all the points related to
the differences of the Capital Market Line (CML) and Security Market Line (SML) are
explained with the help of graphs. After that, minimum variance portfolios are explained
through which it has helps the investors at the time of investments to determine the risk and
return upon which they are investing. In the last part, the Capital Asset Pricing Model
(CAPM) is being explained with graphs that will help in the evaluation of the required rate of
return upon the investment.
2. A Graphical representation on the differences of Capital Market Line
(CML) and Security Market Line (SML)
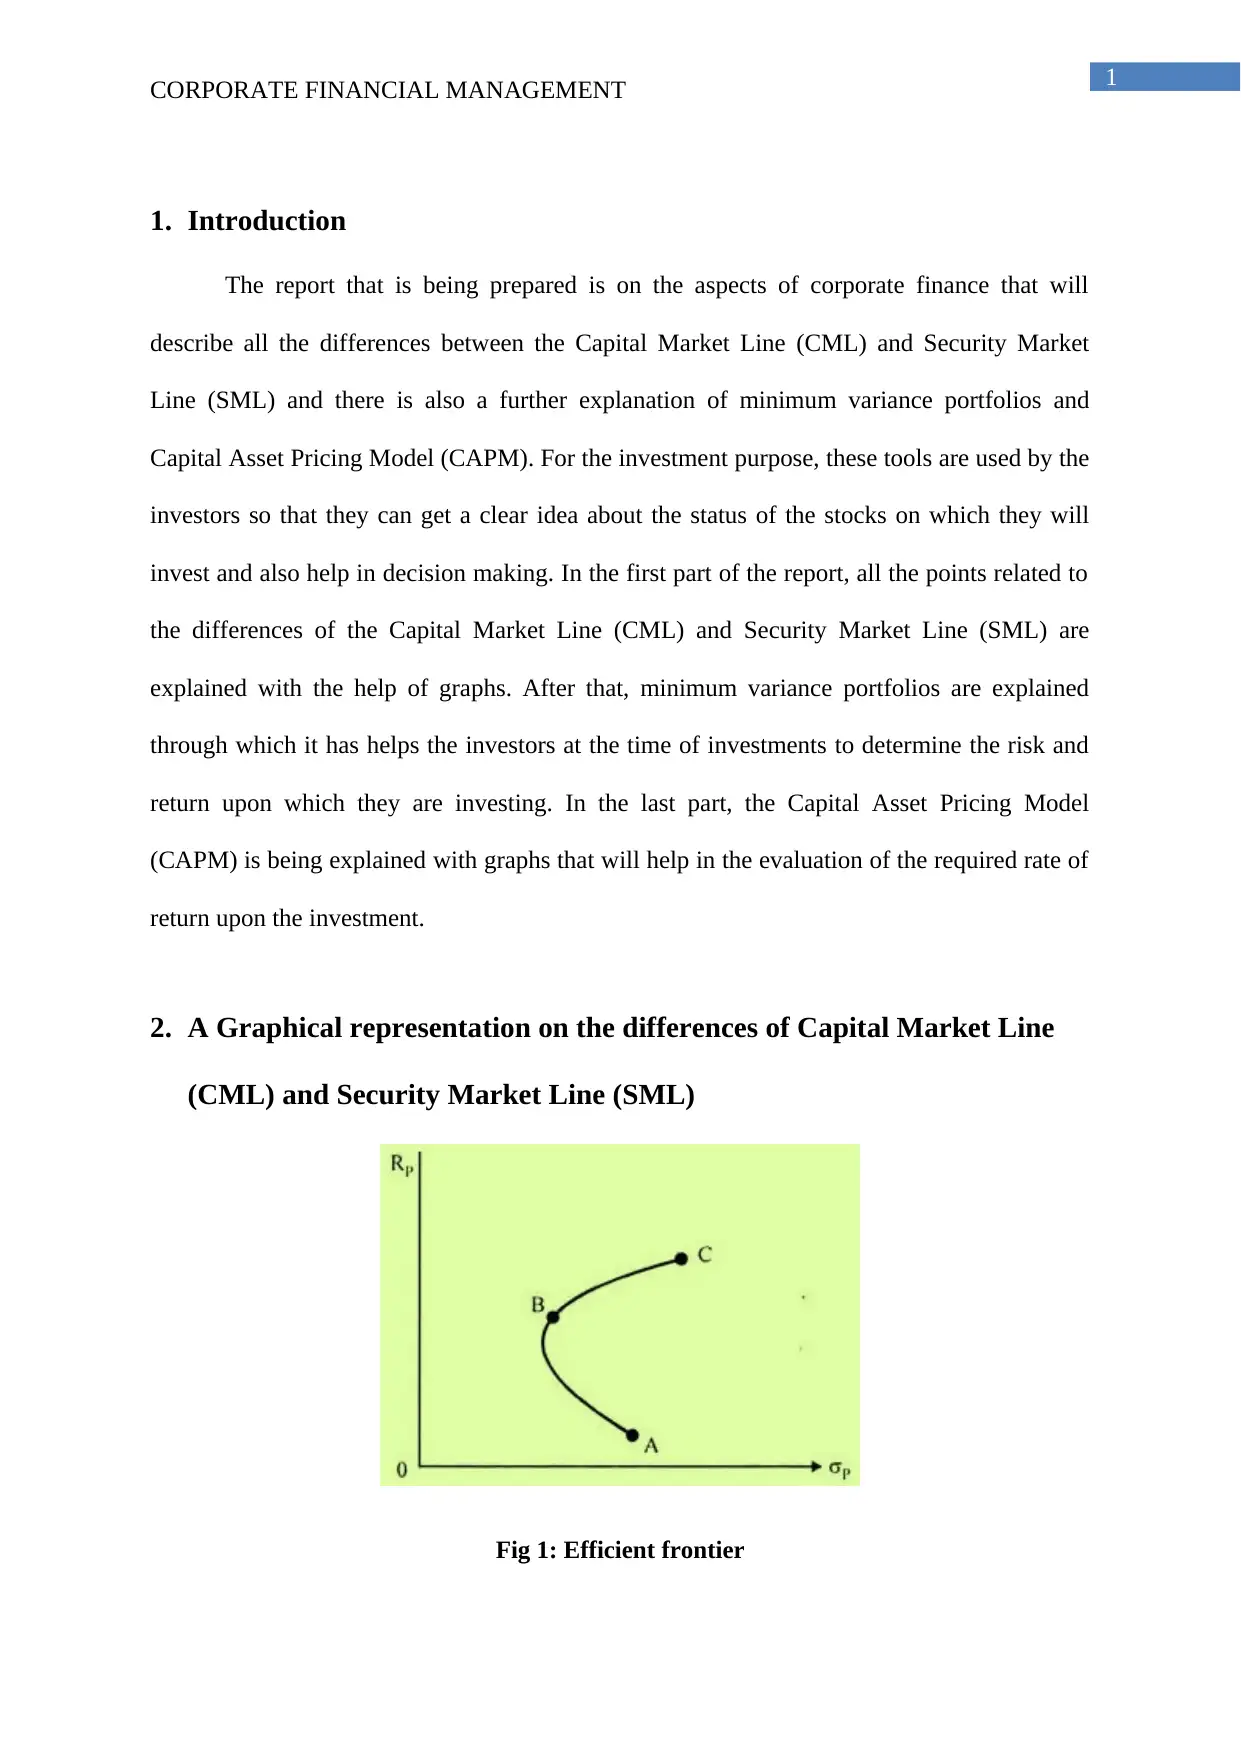
Fig 1: Efficient frontier
CORPORATE FINANCIAL MANAGEMENT
1. Introduction
The report that is being prepared is on the aspects of corporate finance that will
describe all the differences between the Capital Market Line (CML) and Security Market
Line (SML) and there is also a further explanation of minimum variance portfolios and
Capital Asset Pricing Model (CAPM). For the investment purpose, these tools are used by the
investors so that they can get a clear idea about the status of the stocks on which they will
invest and also help in decision making. In the first part of the report, all the points related to
the differences of the Capital Market Line (CML) and Security Market Line (SML) are
explained with the help of graphs. After that, minimum variance portfolios are explained
through which it has helps the investors at the time of investments to determine the risk and
return upon which they are investing. In the last part, the Capital Asset Pricing Model
(CAPM) is being explained with graphs that will help in the evaluation of the required rate of
return upon the investment.
2. A Graphical representation on the differences of Capital Market Line
(CML) and Security Market Line (SML)
Fig 1: Efficient frontier
2
CORPORATE FINANCIAL MANAGEMENT
(Source: Heinze 2018)
The above diagram which is presented, it can be seen that the investors got two option
to invest, with they have to invest on point B or C, or they want to invest in point A and B.
The investors will get an idea in seeing this graph as they could invest in one of the securities
in-between the B and C. both the points have a similar risk level if compared then stock C
will give a much more return than the stock A. Thus, the point C is more preferable for
investment.
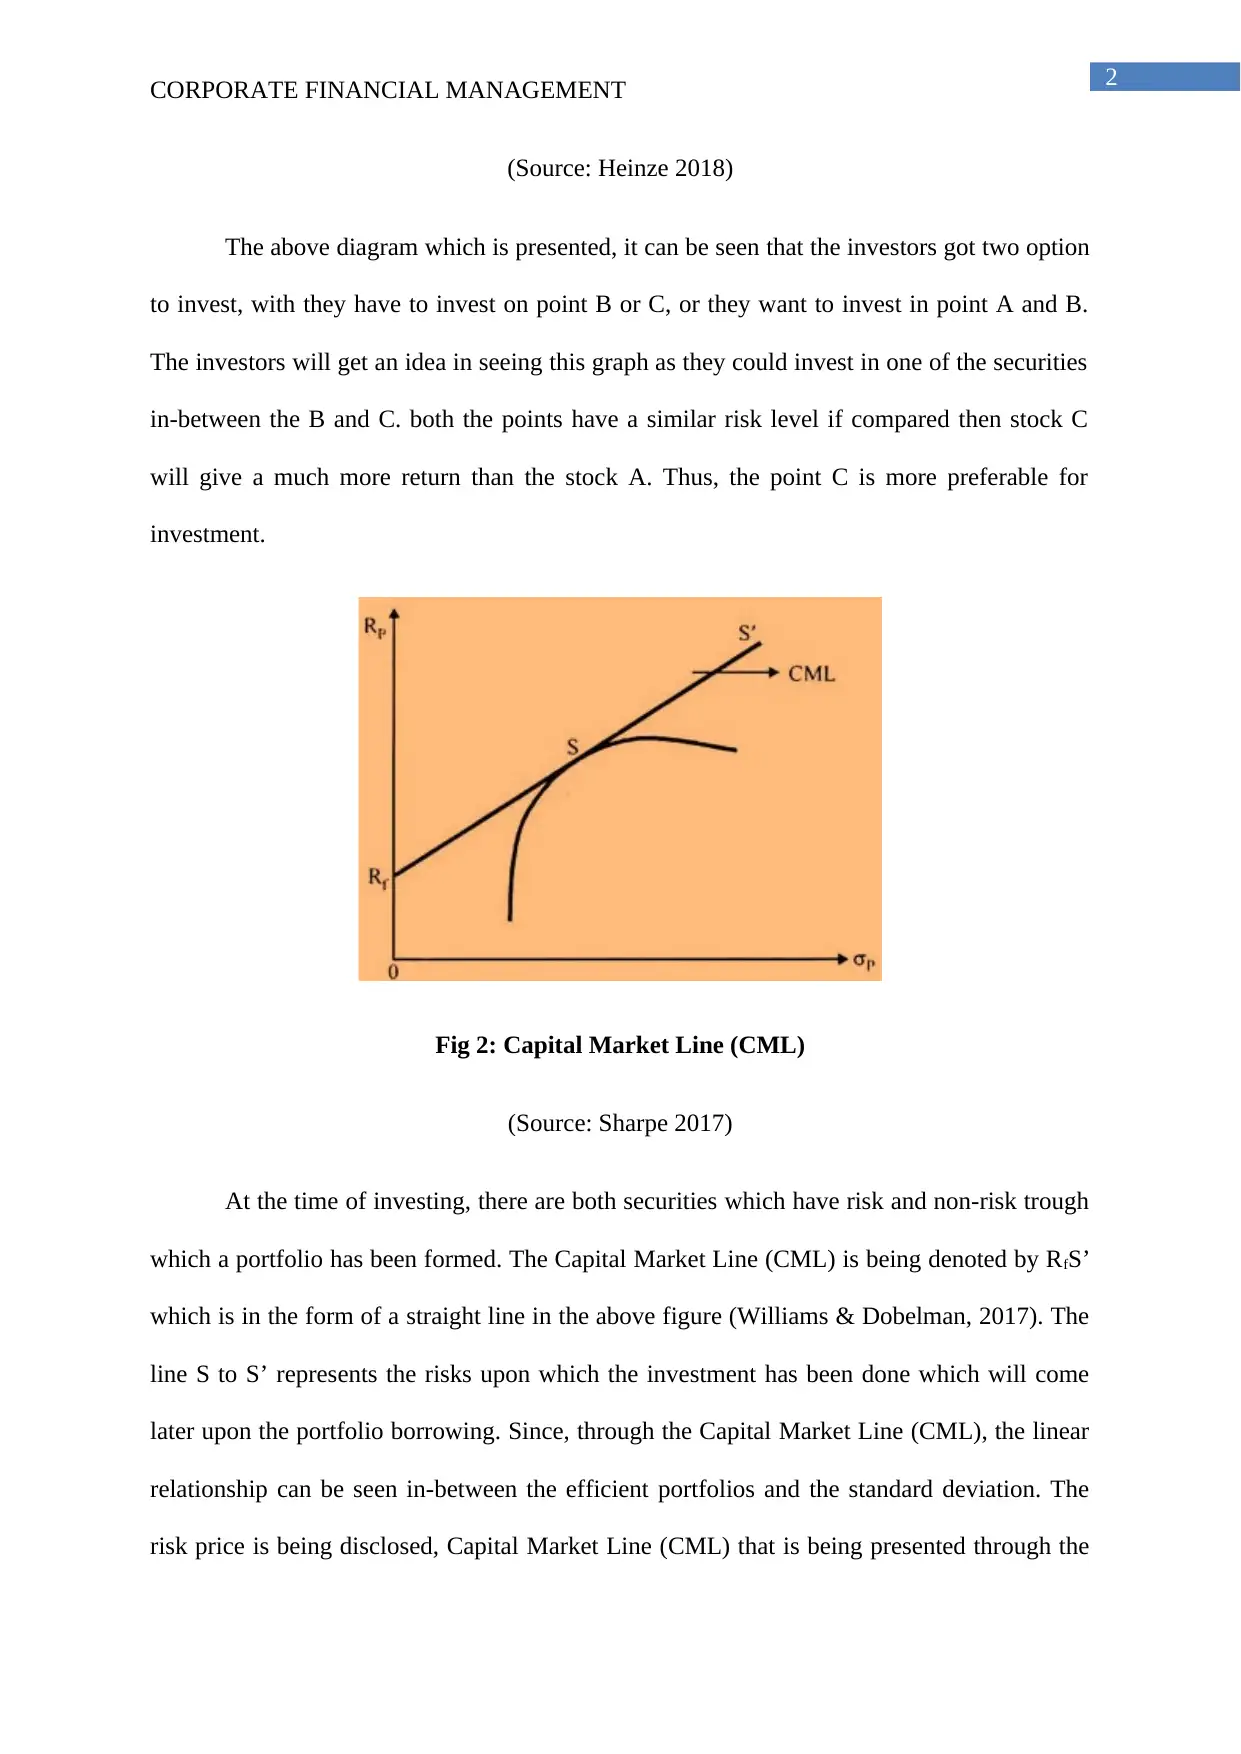
Fig 2: Capital Market Line (CML)
(Source: Sharpe 2017)
At the time of investing, there are both securities which have risk and non-risk trough
which a portfolio has been formed. The Capital Market Line (CML) is being denoted by RfS’
which is in the form of a straight line in the above figure (Williams & Dobelman, 2017). The
line S to S’ represents the risks upon which the investment has been done which will come
later upon the portfolio borrowing. Since, through the Capital Market Line (CML), the linear
relationship can be seen in-between the efficient portfolios and the standard deviation. The
risk price is being disclosed, Capital Market Line (CML) that is being presented through the
CORPORATE FINANCIAL MANAGEMENT
(Source: Heinze 2018)
The above diagram which is presented, it can be seen that the investors got two option
to invest, with they have to invest on point B or C, or they want to invest in point A and B.
The investors will get an idea in seeing this graph as they could invest in one of the securities
in-between the B and C. both the points have a similar risk level if compared then stock C
will give a much more return than the stock A. Thus, the point C is more preferable for
investment.
Fig 2: Capital Market Line (CML)
(Source: Sharpe 2017)
At the time of investing, there are both securities which have risk and non-risk trough
which a portfolio has been formed. The Capital Market Line (CML) is being denoted by RfS’
which is in the form of a straight line in the above figure (Williams & Dobelman, 2017). The
line S to S’ represents the risks upon which the investment has been done which will come
later upon the portfolio borrowing. Since, through the Capital Market Line (CML), the linear
relationship can be seen in-between the efficient portfolios and the standard deviation. The
risk price is being disclosed, Capital Market Line (CML) that is being presented through the
⊘ This is a preview!⊘
Do you want full access?
Subscribe today to unlock all pages.
Trusted by 1+ million students worldwide
3
CORPORATE FINANCIAL MANAGEMENT
line slope and the return that is being projected above the risk-free rate which is being with
in-line with the standard deviation which is being connected with the terms of portfolio,
which is being accustomed as the market portfolio.
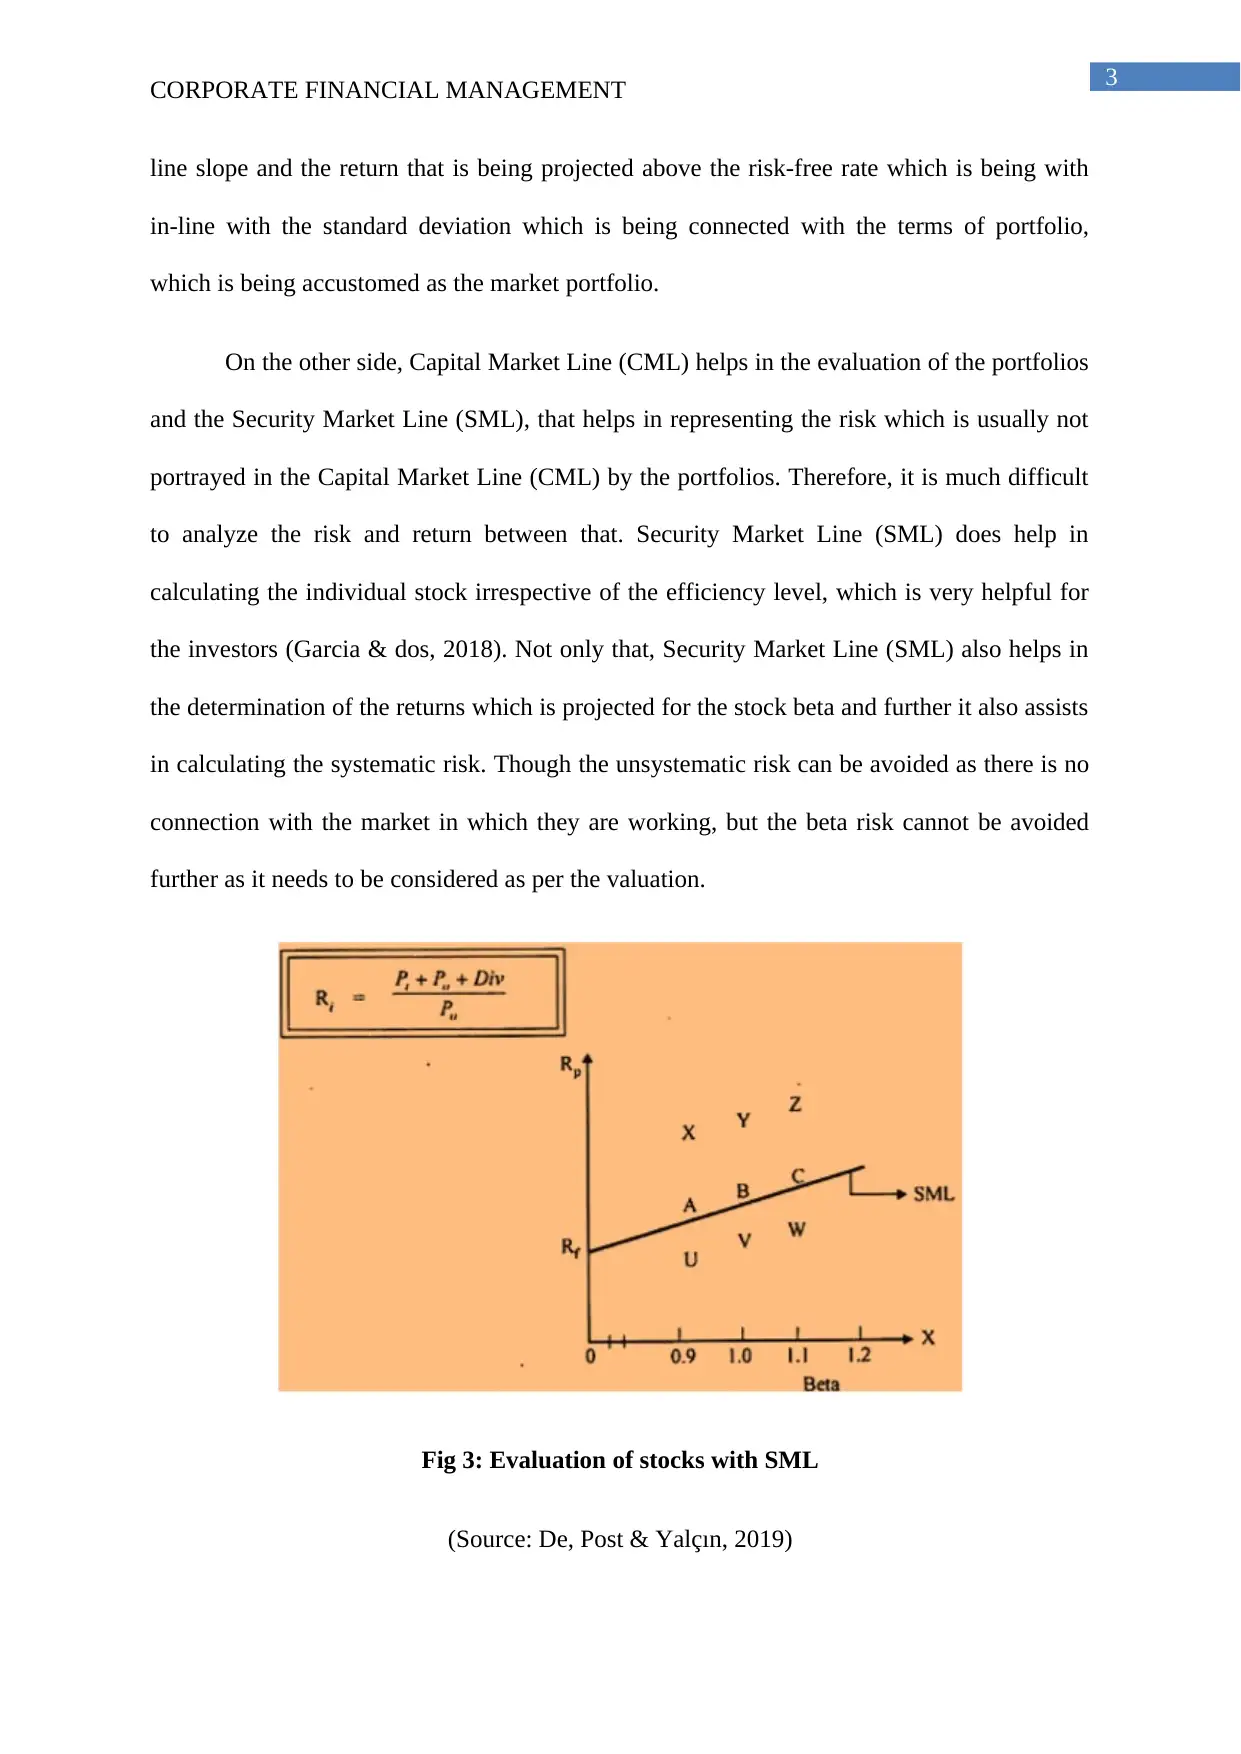
On the other side, Capital Market Line (CML) helps in the evaluation of the portfolios
and the Security Market Line (SML), that helps in representing the risk which is usually not
portrayed in the Capital Market Line (CML) by the portfolios. Therefore, it is much difficult
to analyze the risk and return between that. Security Market Line (SML) does help in
calculating the individual stock irrespective of the efficiency level, which is very helpful for
the investors (Garcia & dos, 2018). Not only that, Security Market Line (SML) also helps in
the determination of the returns which is projected for the stock beta and further it also assists
in calculating the systematic risk. Though the unsystematic risk can be avoided as there is no
connection with the market in which they are working, but the beta risk cannot be avoided
further as it needs to be considered as per the valuation.
Fig 3: Evaluation of stocks with SML
(Source: De, Post & Yalçın, 2019)
CORPORATE FINANCIAL MANAGEMENT
line slope and the return that is being projected above the risk-free rate which is being with
in-line with the standard deviation which is being connected with the terms of portfolio,
which is being accustomed as the market portfolio.
On the other side, Capital Market Line (CML) helps in the evaluation of the portfolios
and the Security Market Line (SML), that helps in representing the risk which is usually not
portrayed in the Capital Market Line (CML) by the portfolios. Therefore, it is much difficult
to analyze the risk and return between that. Security Market Line (SML) does help in
calculating the individual stock irrespective of the efficiency level, which is very helpful for
the investors (Garcia & dos, 2018). Not only that, Security Market Line (SML) also helps in
the determination of the returns which is projected for the stock beta and further it also assists
in calculating the systematic risk. Though the unsystematic risk can be avoided as there is no
connection with the market in which they are working, but the beta risk cannot be avoided
further as it needs to be considered as per the valuation.
Fig 3: Evaluation of stocks with SML
(Source: De, Post & Yalçın, 2019)
Paraphrase This Document
Need a fresh take? Get an instant paraphrase of this document with our AI Paraphraser
4
CORPORATE FINANCIAL MANAGEMENT
Through the Security Market Line (SML), the securities that are overpriced and
underpriced can be easily determined. From figure 3, that is presented above can be seen that
above the Security Market Line (SML) are the underpriced stocks which can be identified as
X, Y, and Z. U, V, and W are the three stock which can be seen that they are all overpriced as
they are below the Security Market Line (SML). Though the two class of stock has the same
level of risk, they are several dissimilarities that can be observed from there (Nguyen et al.,
2017). The overpriced stocks will not give a greater return as compared to the underpriced
stock. The formula that has been given above, can be defined as P1 as the current price, P0 as
the purchase price and dividend is denoted as the Div. On the SML there are three stocks A,
B and C which is lying, the price of the stock is accurate as they have the same level of risk
and return.
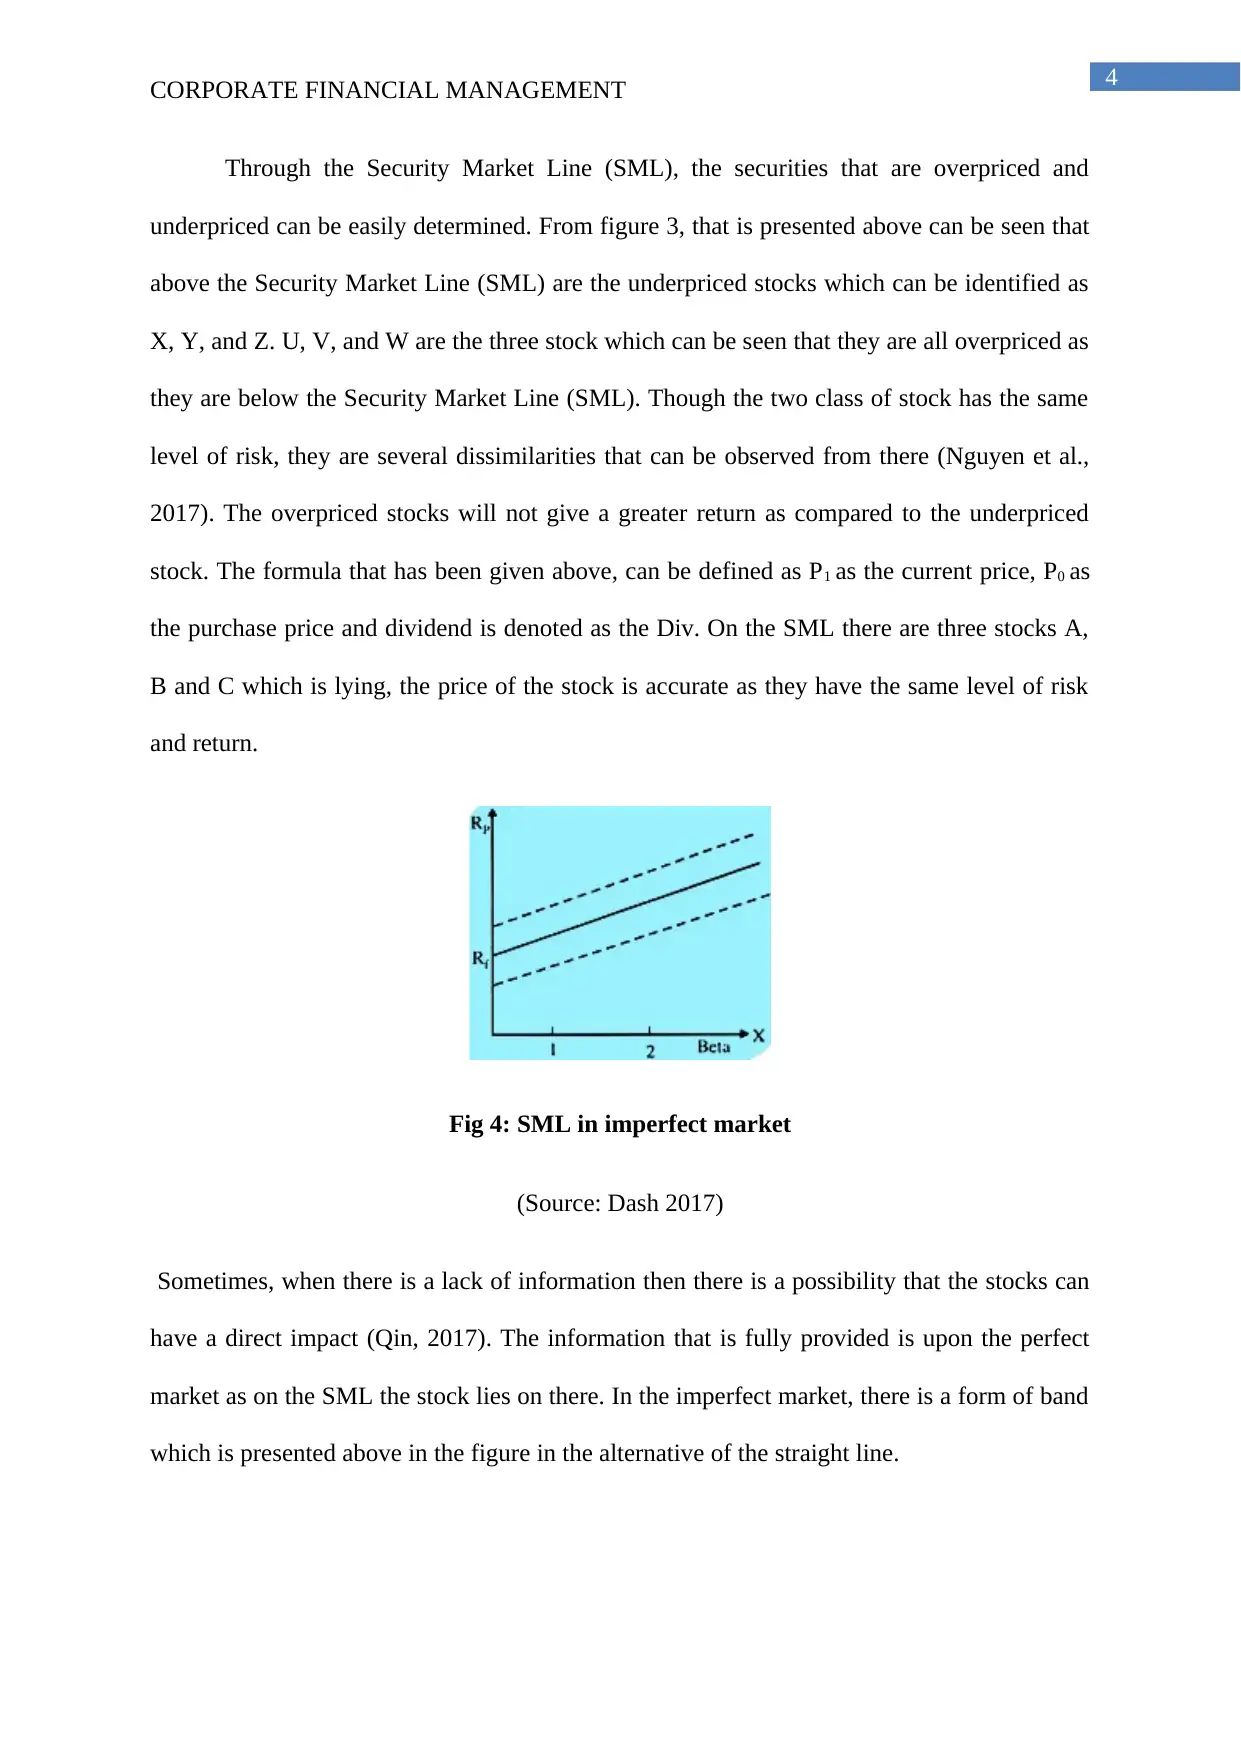
Fig 4: SML in imperfect market
(Source: Dash 2017)
Sometimes, when there is a lack of information then there is a possibility that the stocks can
have a direct impact (Qin, 2017). The information that is fully provided is upon the perfect
market as on the SML the stock lies on there. In the imperfect market, there is a form of band
which is presented above in the figure in the alternative of the straight line.
CORPORATE FINANCIAL MANAGEMENT
Through the Security Market Line (SML), the securities that are overpriced and
underpriced can be easily determined. From figure 3, that is presented above can be seen that
above the Security Market Line (SML) are the underpriced stocks which can be identified as
X, Y, and Z. U, V, and W are the three stock which can be seen that they are all overpriced as
they are below the Security Market Line (SML). Though the two class of stock has the same
level of risk, they are several dissimilarities that can be observed from there (Nguyen et al.,
2017). The overpriced stocks will not give a greater return as compared to the underpriced
stock. The formula that has been given above, can be defined as P1 as the current price, P0 as
the purchase price and dividend is denoted as the Div. On the SML there are three stocks A,
B and C which is lying, the price of the stock is accurate as they have the same level of risk
and return.
Fig 4: SML in imperfect market
(Source: Dash 2017)
Sometimes, when there is a lack of information then there is a possibility that the stocks can
have a direct impact (Qin, 2017). The information that is fully provided is upon the perfect
market as on the SML the stock lies on there. In the imperfect market, there is a form of band
which is presented above in the figure in the alternative of the straight line.
5
CORPORATE FINANCIAL MANAGEMENT
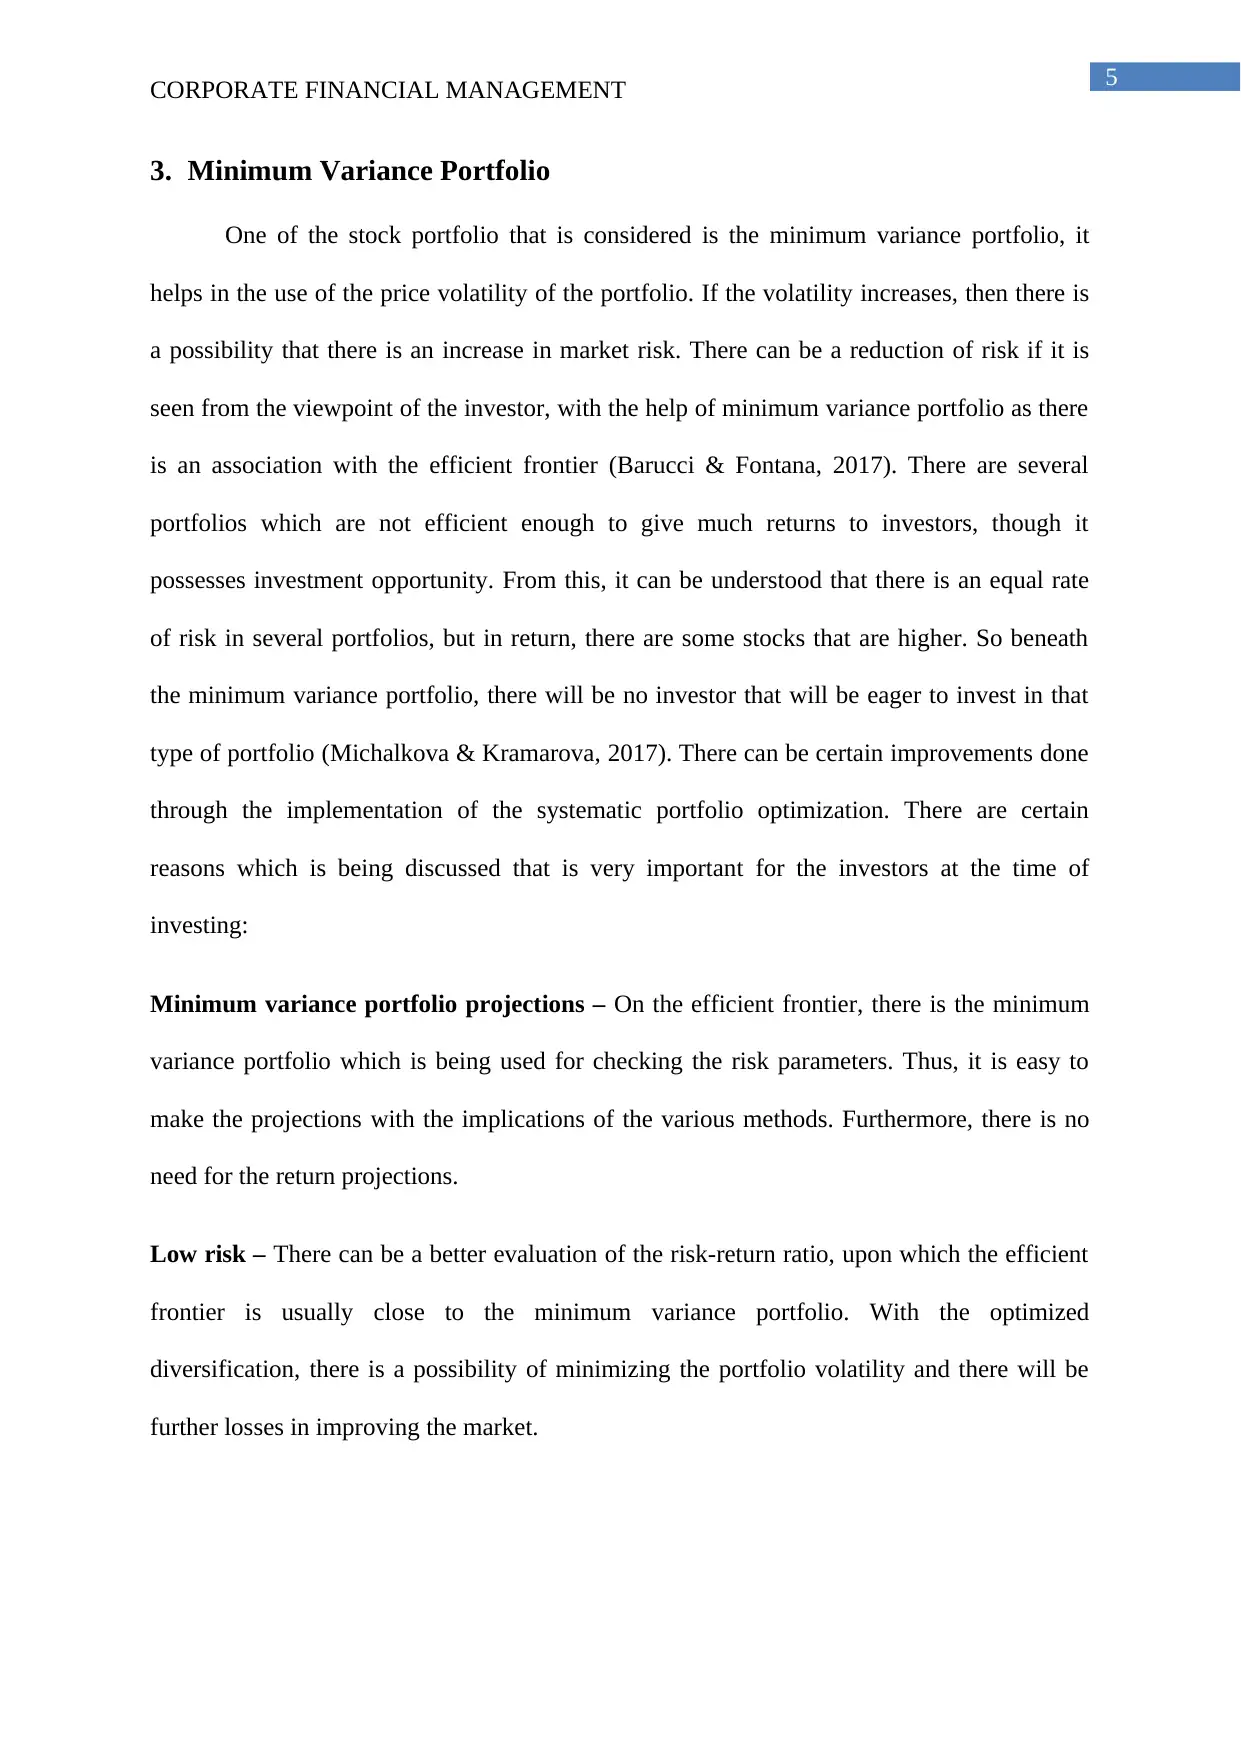
3. Minimum Variance Portfolio
One of the stock portfolio that is considered is the minimum variance portfolio, it
helps in the use of the price volatility of the portfolio. If the volatility increases, then there is
a possibility that there is an increase in market risk. There can be a reduction of risk if it is
seen from the viewpoint of the investor, with the help of minimum variance portfolio as there
is an association with the efficient frontier (Barucci & Fontana, 2017). There are several
portfolios which are not efficient enough to give much returns to investors, though it
possesses investment opportunity. From this, it can be understood that there is an equal rate
of risk in several portfolios, but in return, there are some stocks that are higher. So beneath
the minimum variance portfolio, there will be no investor that will be eager to invest in that
type of portfolio (Michalkova & Kramarova, 2017). There can be certain improvements done
through the implementation of the systematic portfolio optimization. There are certain
reasons which is being discussed that is very important for the investors at the time of
investing:
Minimum variance portfolio projections – On the efficient frontier, there is the minimum
variance portfolio which is being used for checking the risk parameters. Thus, it is easy to
make the projections with the implications of the various methods. Furthermore, there is no
need for the return projections.
Low risk – There can be a better evaluation of the risk-return ratio, upon which the efficient
frontier is usually close to the minimum variance portfolio. With the optimized
diversification, there is a possibility of minimizing the portfolio volatility and there will be
further losses in improving the market.
CORPORATE FINANCIAL MANAGEMENT
3. Minimum Variance Portfolio
One of the stock portfolio that is considered is the minimum variance portfolio, it
helps in the use of the price volatility of the portfolio. If the volatility increases, then there is
a possibility that there is an increase in market risk. There can be a reduction of risk if it is
seen from the viewpoint of the investor, with the help of minimum variance portfolio as there
is an association with the efficient frontier (Barucci & Fontana, 2017). There are several
portfolios which are not efficient enough to give much returns to investors, though it
possesses investment opportunity. From this, it can be understood that there is an equal rate
of risk in several portfolios, but in return, there are some stocks that are higher. So beneath
the minimum variance portfolio, there will be no investor that will be eager to invest in that
type of portfolio (Michalkova & Kramarova, 2017). There can be certain improvements done
through the implementation of the systematic portfolio optimization. There are certain
reasons which is being discussed that is very important for the investors at the time of
investing:
Minimum variance portfolio projections – On the efficient frontier, there is the minimum
variance portfolio which is being used for checking the risk parameters. Thus, it is easy to
make the projections with the implications of the various methods. Furthermore, there is no
need for the return projections.
Low risk – There can be a better evaluation of the risk-return ratio, upon which the efficient
frontier is usually close to the minimum variance portfolio. With the optimized
diversification, there is a possibility of minimizing the portfolio volatility and there will be
further losses in improving the market.
⊘ This is a preview!⊘
Do you want full access?
Subscribe today to unlock all pages.
Trusted by 1+ million students worldwide
6
CORPORATE FINANCIAL MANAGEMENT
Figure 5: Minimum variance portfolio
(Source: Bodnar, Parolya and Schmid 2018)
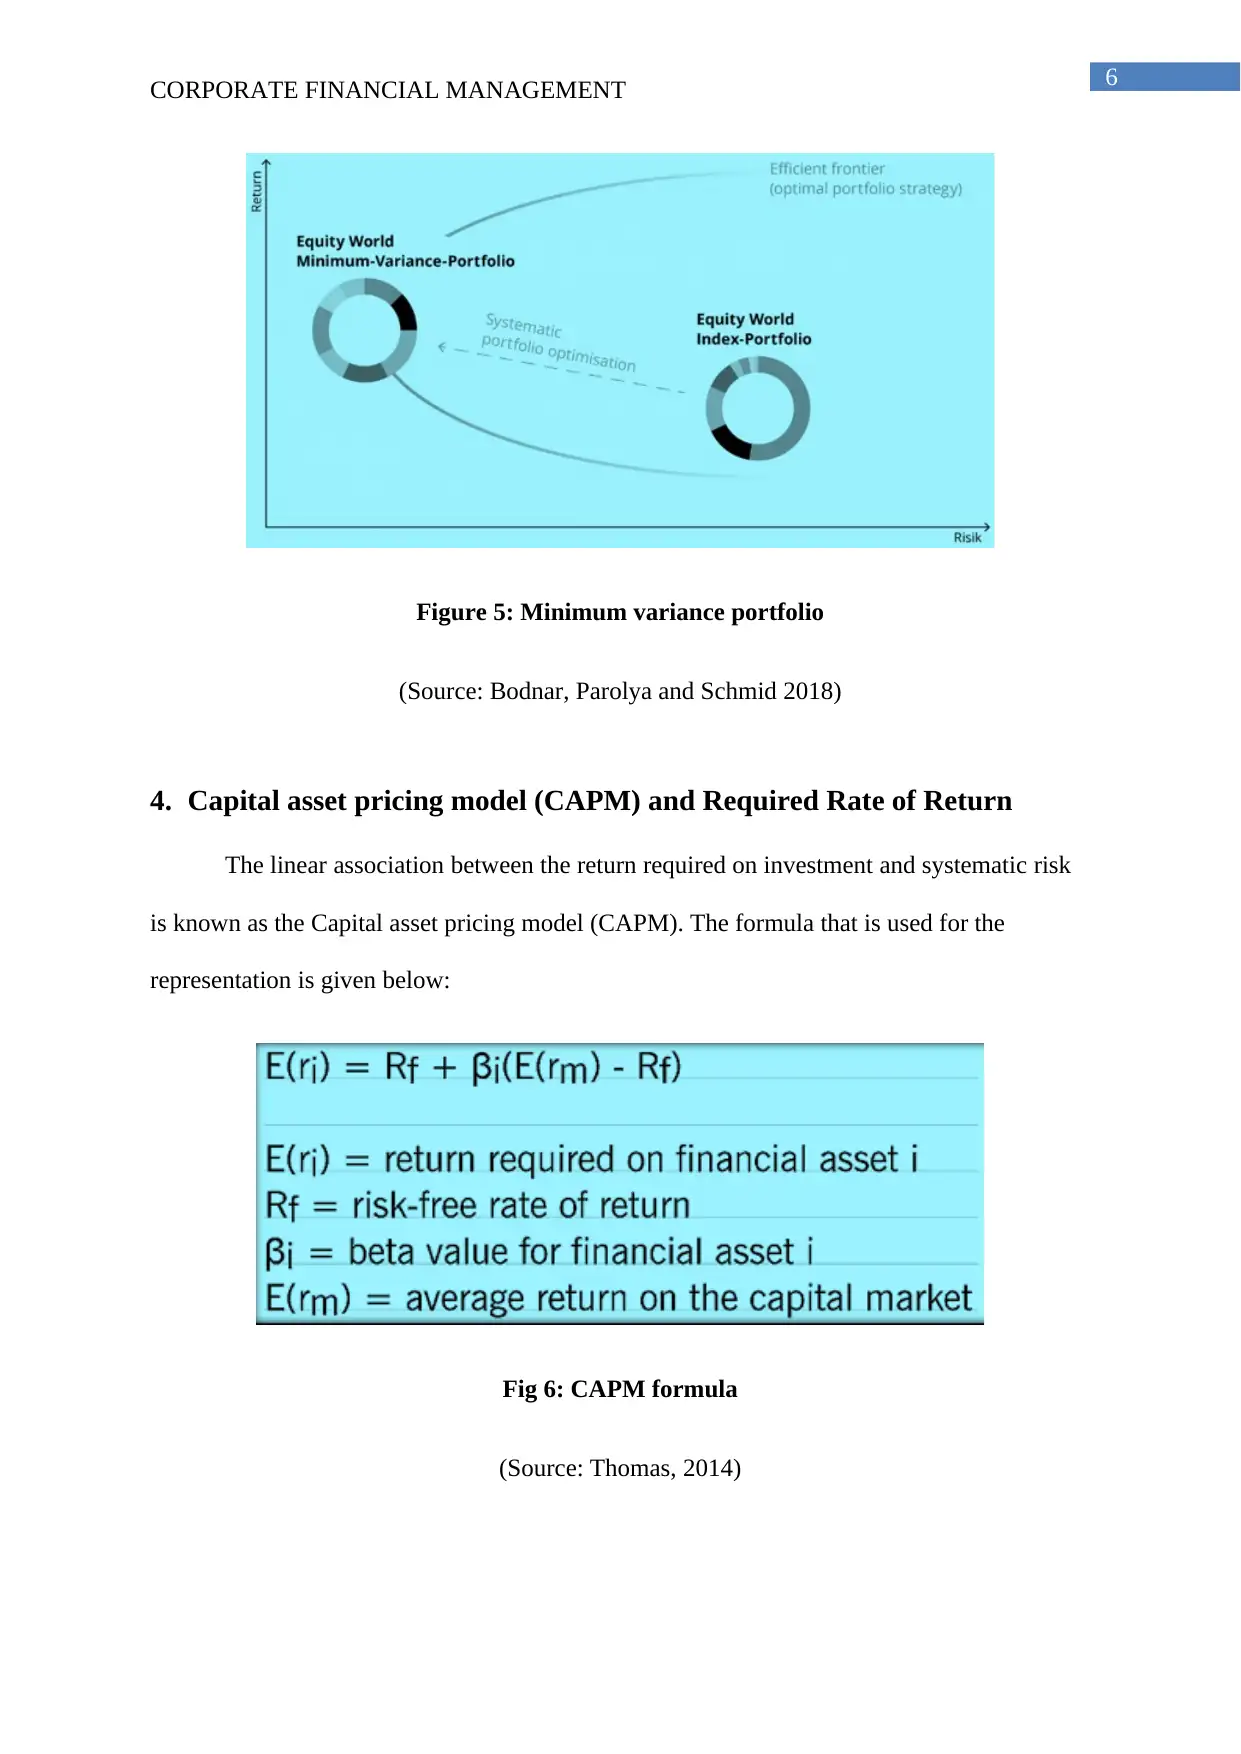
4. Capital asset pricing model (CAPM) and Required Rate of Return
The linear association between the return required on investment and systematic risk
is known as the Capital asset pricing model (CAPM). The formula that is used for the
representation is given below:
Fig 6: CAPM formula
(Source: Thomas, 2014)
CORPORATE FINANCIAL MANAGEMENT
Figure 5: Minimum variance portfolio
(Source: Bodnar, Parolya and Schmid 2018)
4. Capital asset pricing model (CAPM) and Required Rate of Return
The linear association between the return required on investment and systematic risk
is known as the Capital asset pricing model (CAPM). The formula that is used for the
representation is given below:
Fig 6: CAPM formula
(Source: Thomas, 2014)
Paraphrase This Document
Need a fresh take? Get an instant paraphrase of this document with our AI Paraphraser
7
CORPORATE FINANCIAL MANAGEMENT
The investor uses the Capital asset pricing model (CAPM) so that it helps in the
determination of the projected investment returns (Patrick and French 2016). At the time of
calculating the Weighted Average Cost of Capital (WACC), Capital asset pricing model
plays a major role. Through WACC, it is used at a discounted rate which helps in the
investment appraisals, some of the assumptions are described below:
There should be similarities in-between the activities of the business related to the project
and of the organization that has invested.
The financing strategy that has used in the project and capital structure that has
implemented should have resemblances.
The funds that is existed of the organization has to maintain the same rate of return after
the project has been granted.
The project upon which the investment has to be done should not be more than the firm
that is doing the investment.
There can be a possibility of change in the discount rate through various assumptions
if both the risk i.e. financial and business of the current organization is not being changed. At
the time of any dissimilarities, there can be use of the Capital asset pricing model (CAPM),
for the particular project that will work as the rate of discount (Magni & Martin, 2018). Thus,
it can be said that the CAPM will help in assisting the bigger investments compared to the
Weighted Average Cost of Capital (WACC) which is further illustrated with the graphical
representation:
8
CORPORATE FINANCIAL MANAGEMENT
.
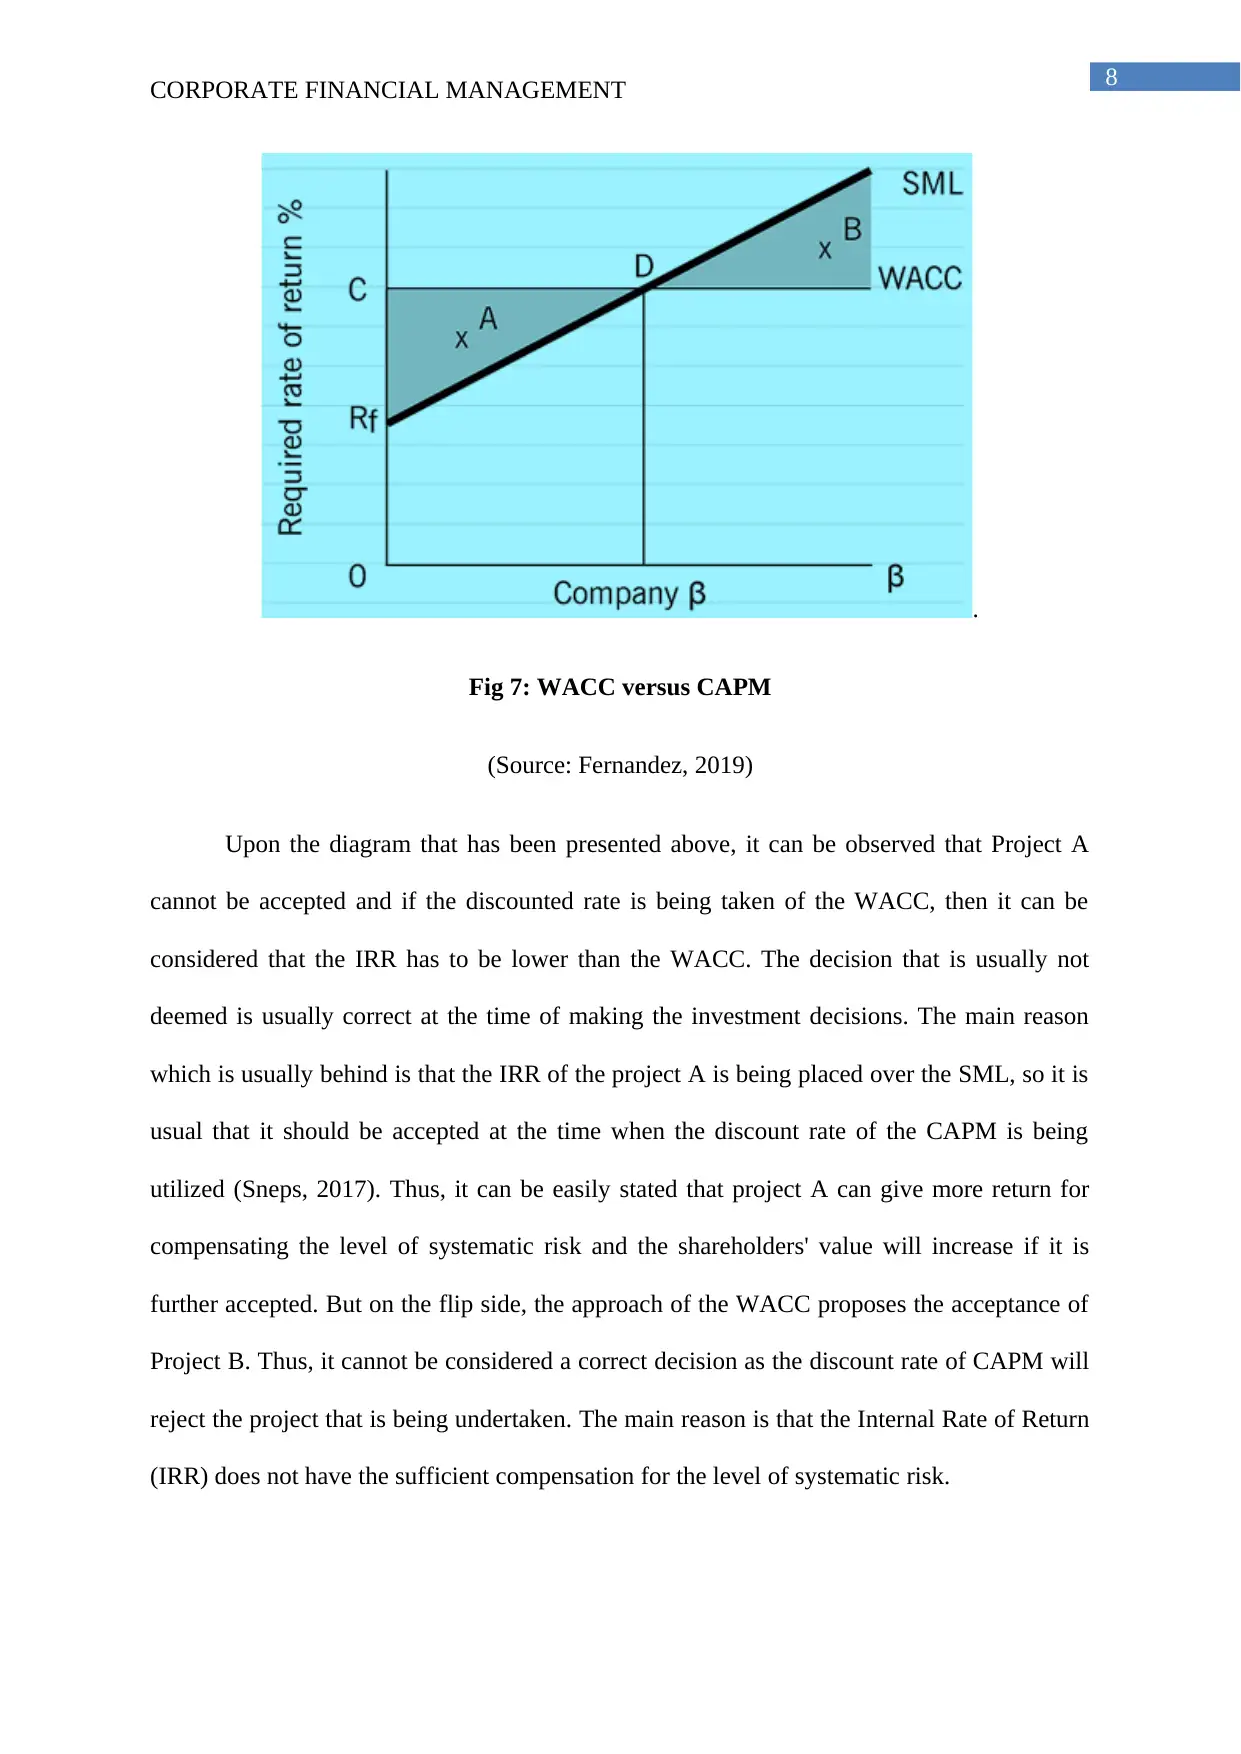
Fig 7: WACC versus CAPM
(Source: Fernandez, 2019)
Upon the diagram that has been presented above, it can be observed that Project A
cannot be accepted and if the discounted rate is being taken of the WACC, then it can be
considered that the IRR has to be lower than the WACC. The decision that is usually not
deemed is usually correct at the time of making the investment decisions. The main reason
which is usually behind is that the IRR of the project A is being placed over the SML, so it is
usual that it should be accepted at the time when the discount rate of the CAPM is being
utilized (Sneps, 2017). Thus, it can be easily stated that project A can give more return for
compensating the level of systematic risk and the shareholders' value will increase if it is
further accepted. But on the flip side, the approach of the WACC proposes the acceptance of
Project B. Thus, it cannot be considered a correct decision as the discount rate of CAPM will
reject the project that is being undertaken. The main reason is that the Internal Rate of Return
(IRR) does not have the sufficient compensation for the level of systematic risk.
CORPORATE FINANCIAL MANAGEMENT
.
Fig 7: WACC versus CAPM
(Source: Fernandez, 2019)
Upon the diagram that has been presented above, it can be observed that Project A
cannot be accepted and if the discounted rate is being taken of the WACC, then it can be
considered that the IRR has to be lower than the WACC. The decision that is usually not
deemed is usually correct at the time of making the investment decisions. The main reason
which is usually behind is that the IRR of the project A is being placed over the SML, so it is
usual that it should be accepted at the time when the discount rate of the CAPM is being
utilized (Sneps, 2017). Thus, it can be easily stated that project A can give more return for
compensating the level of systematic risk and the shareholders' value will increase if it is
further accepted. But on the flip side, the approach of the WACC proposes the acceptance of
Project B. Thus, it cannot be considered a correct decision as the discount rate of CAPM will
reject the project that is being undertaken. The main reason is that the Internal Rate of Return
(IRR) does not have the sufficient compensation for the level of systematic risk.
⊘ This is a preview!⊘
Do you want full access?
Subscribe today to unlock all pages.
Trusted by 1+ million students worldwide
9
CORPORATE FINANCIAL MANAGEMENT
5. Conclusion
From the above analysis, it can be stated that there are different levels of
measurement upon which the SML, minimum variance portfolios and CML can be
represented. The investors would like to invest upon the portfolios which is beneath the
minimum variance portfolios. With the implication of the optimization of systematic
portfolio, there can be further improvement done. Moreover, it can be stated that the
shareholders’ value can be increased upon the utilization of the Capital asset pricing model.
Paraphrase This Document
Need a fresh take? Get an instant paraphrase of this document with our AI Paraphraser
10
CORPORATE FINANCIAL MANAGEMENT
References
Barucci, E. and Fontana, C., 2017. Factor Asset Pricing Models: CAPM and APT.
In Financial Markets Theory (pp. 201-253). Springer, London.
Bodnar, T., Parolya, N. and Schmid, W., 2018. Estimation of the global minimum
variance portfolio in high dimensions. European Journal of Operational
Research, 266(1), pp.371-390.
Dash, M., 2017. “Reverse-Engineering” the Market Portfolio. Journal of Applied
Management and Investments, 6(3), pp.151-156.
De Giorgi, E.G., Post, T. and Yalçın, A., 2019. A concave security market line. Journal of
Banking & Finance, 106, pp.65-81.
Fernandez, P., 2019. WACC and CAPM according to Utilities Regulators: Confusions,
Errors, and Inconsistencies. Errors and Inconsistencies (February 1, 2019).
Garcia, M.T.M. and dos Santos Borrego, D.A.B., 2018. Calculating the Efficient Frontier
for the Portuguese Stock Market. International Advances in Economic Research, 24(4),
pp.339-349.
Heinze, T., Provinzial Rheinland Versicherung AG, 2018. Portfolio optimization using
the diversified efficient frontier. U.S. Patent Application 15/431,199.
Magni, C.A. and Martin, J.D., 2018. Defining a Reliable Multi-Period Project Rate of
Return. An Alternative to IRR. An Alternative to IRR.(September 23, 2018).
11
CORPORATE FINANCIAL MANAGEMENT
Michalkova, L. and Kramarova, K., 2017. CAPM Model, Beta and Relationship with
Credit Rating. In Advances in Applied Economic Research (pp. 645-652). Springer,
Cham.
Nguyen, T., Stalin, O., Diagne, A., Aukea, L., Rootzen, P.H. and Herbertsson, A., 2017.
The Capital asset pricing model and the Arbitrage pricing theory. Gothenburg University,
(May 15, 2017).
Patrick, M. and French, N., 2016. The internal rate of return (IRR): projections,
benchmarks and pitfalls. Journal of Property Investment & Finance, 34(6), pp.664-669.
Qin, J., 2017. Regret-CAPM: A Model of Regret and Asset Pricing. Journal of
Behavioral Economics and Finance, 10(Special_issue), pp.S1-S4.
Sharpe, W., 2017. Capital Market Theory, Efficiency, and Imperfections. Quantitative
Financial Analytics: The Path to Investment Profits, p.445.
Sneps-Sneppe, M., 2017. On the internal rate of return of IRR and the priority of
investments. International Journal of Open Information Technologies, 5(9), pp.39-44.
Williams, E.E. and Dobelman, J.A., 2017. Capital Market Theory, Efficiency, and
Imperfections. World Scientific Book Chapters, pp.445-510.
⊘ This is a preview!⊘
Do you want full access?
Subscribe today to unlock all pages.
Trusted by 1+ million students worldwide
1 out of 12
Related Documents


Your All-in-One AI-Powered Toolkit for Academic Success.
+13062052269
info@desklib.com
Available 24*7 on WhatsApp / Email
![[object Object]](/_next/static/media/star-bottom.7253800d.svg)
Unlock your academic potential
Copyright © 2020–2026 A2Z Services. All Rights Reserved. Developed and managed by ZUCOL.