Corporate Financial Management Report: Investment Appraisal Techniques
VerifiedAdded on 2023/01/06
|15
|4411
|69
Report
AI Summary
This report delves into the core aspects of corporate financial management. It begins by examining diversification strategies as a risk management technique, emphasizing the importance of balancing risk and return through portfolio construction. The report then moves on to company valuation, exploring various methods such as the Price/Earnings (P/E) ratio, Dividend Valuation Model, and Discounted Cash Flow (DCF) analysis, using Espirit PLC as a case study. It outlines the key drivers behind these valuation models, including earnings, dividends, cash flows, and market conditions. Finally, the report concludes with a discussion of investment appraisal techniques, evaluating their effectiveness in making sound financial decisions. The report provides a comprehensive overview of essential concepts in corporate finance, equipping readers with a strong understanding of valuation and investment strategies.

Corporate Financial
Management
1
Management
1
Paraphrase This Document
Need a fresh take? Get an instant paraphrase of this document with our AI Paraphraser
Table of Contents
Introduction......................................................................................................................................3
Part B...............................................................................................................................................3
Task 1.....................................................................................................................................3
Diversification...................................................................................................................3
Task 2.....................................................................................................................................5
Valuation of a company.....................................................................................................5
Key drivers of valuation models........................................................................................7
Task 3.....................................................................................................................................9
Investment appraisal techniques........................................................................................9
Evaluation of investment appraisal techniques................................................................11
Conclusion.....................................................................................................................................14
References......................................................................................................................................15
2
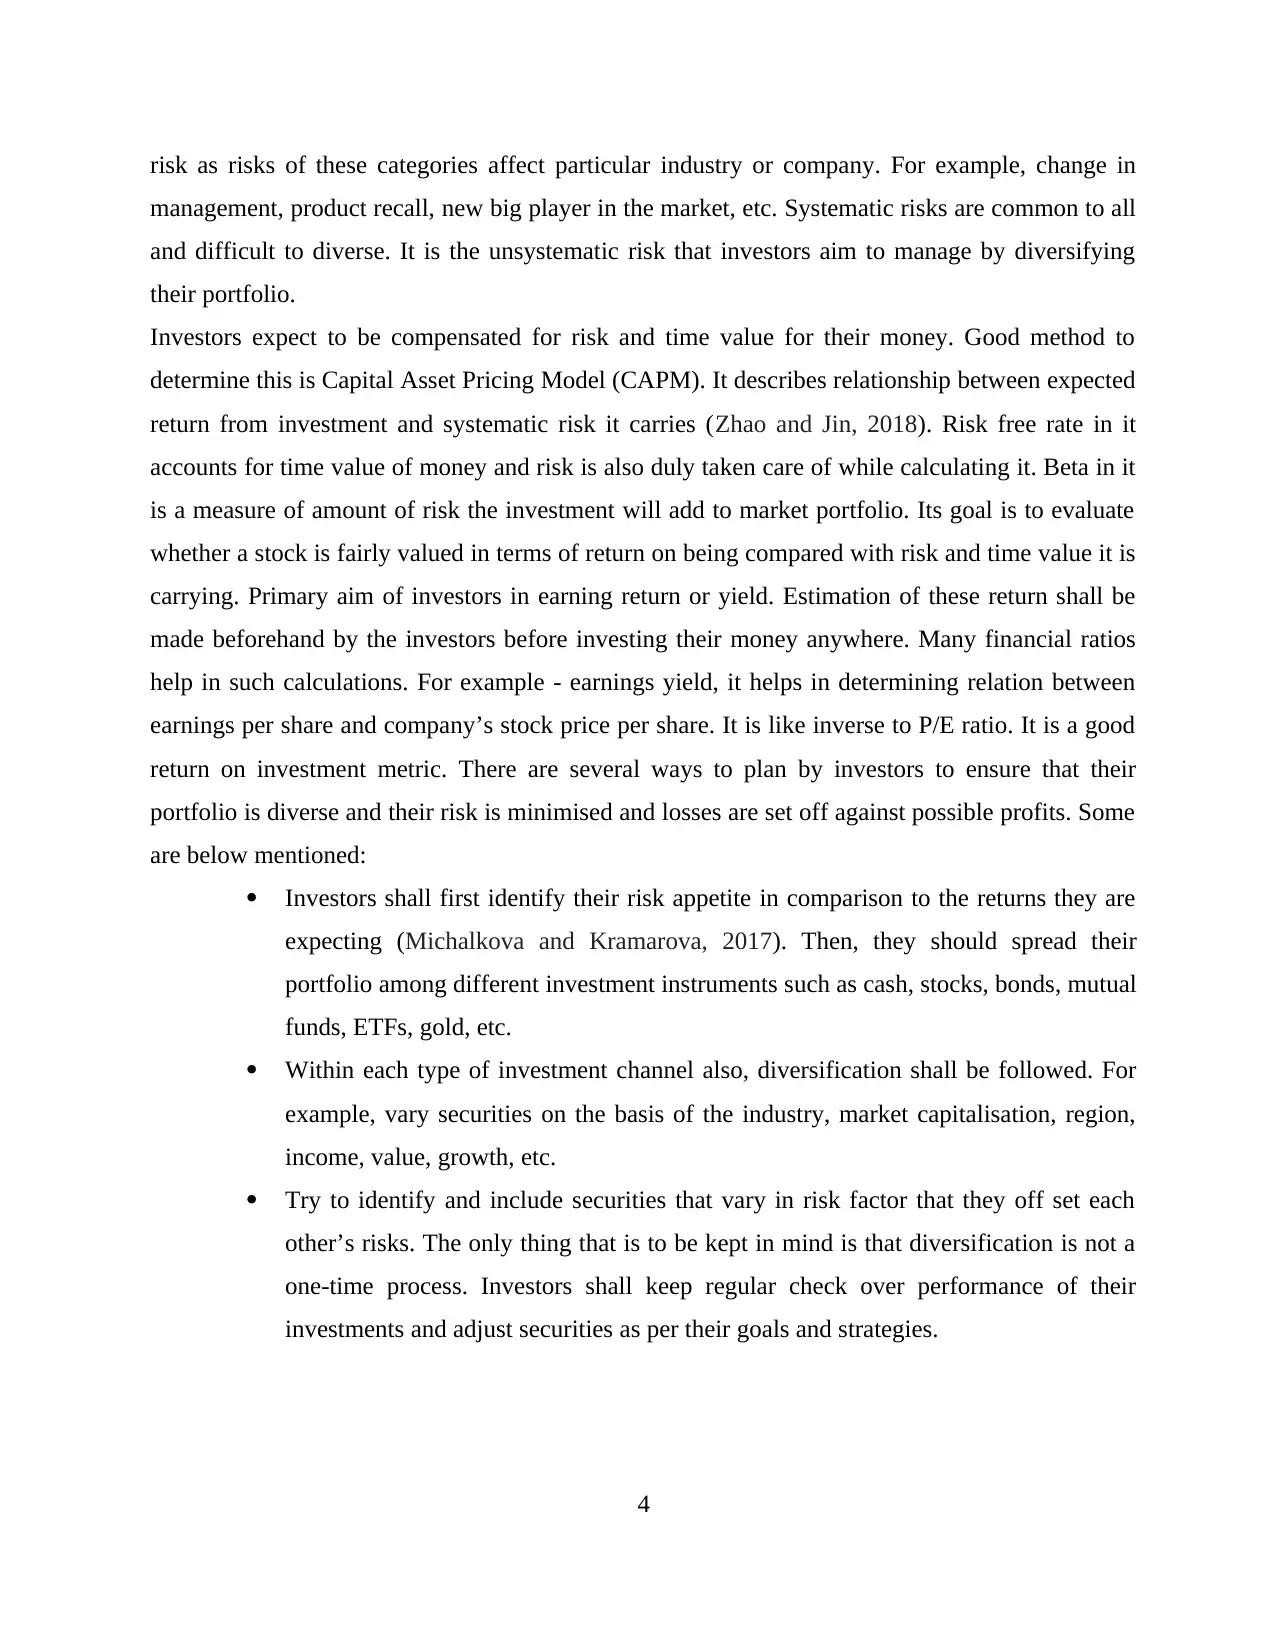
Introduction
Every investor wants to maximise return and minimise risk. All investments include risk
factor which is compensated by return. As the saying goes, more the risk more the return. So, to
have more returns, an investor needs to take more risk (Bessler, Opfer and Wolff, 2017). Another
way to reduce risk is to diversify portfolio in different instruments having different risks and
returns. First part of this report discusses how an investor can manage both risk and return.
Valuation of a company is discussed using multiple methods in second part. In final part of report,
investment appraisal techniques are demonstrated for better understanding.
Part B
Task 1
Diversification
Diversification is a technique of risk management. An investment is bifurcated into a wide
variety of financial instruments within a portfolio to reduce risk involved to any single investment
vehicle. Another thought behind this technique is that a portfolio of multiple kinds of assets will
yield higher long-term returns while reducing risk attached to single asset i.e. the profit on
investment performing well will offset the losses on poor performance of others. For example,
bonds and stock generally perform in mutually exclusive manner. When economy weakens, stock
prices are likely to fall. To salvage market in this condition, central banks cut interest rates to
reduce cost of borrowing and stimulate market spending. This causes bond prices to increase. If
any investor is having both stocks and bonds in portfolio, the rise in valuation of bonds may help
offset the fall in valuation of stocks. This way even if the profits are not increased, at least the risk
has been reduced.
Whenever any investors decide to undertake investment in any financial instrument, not
only returns but risks form the major part of decision-making process. Risks is that chance that
actual gain from an investment will differ from the expected return (Najeeb, Bacha and Masih,
2015). Every investment involves some kind of risk and every investor has different risk appetite.
Financial risks are of two types -systematic risks and unsystematic risks. Systematic risks are also
known as market risk as these risks have macro effect. Common type of systematic risks are risks
of interest rate, inflation, liquidity in market, etc. Unsystematic risks are also known as specific
3
⊘ This is a preview!⊘
Do you want full access?
Subscribe today to unlock all pages.
Trusted by 1+ million students worldwide
risk as risks of these categories affect particular industry or company. For example, change in
management, product recall, new big player in the market, etc. Systematic risks are common to all
and difficult to diverse. It is the unsystematic risk that investors aim to manage by diversifying
their portfolio.
Investors expect to be compensated for risk and time value for their money. Good method to
determine this is Capital Asset Pricing Model (CAPM). It describes relationship between expected
return from investment and systematic risk it carries (Zhao and Jin, 2018). Risk free rate in it
accounts for time value of money and risk is also duly taken care of while calculating it. Beta in it
is a measure of amount of risk the investment will add to market portfolio. Its goal is to evaluate
whether a stock is fairly valued in terms of return on being compared with risk and time value it is
carrying. Primary aim of investors in earning return or yield. Estimation of these return shall be
made beforehand by the investors before investing their money anywhere. Many financial ratios
help in such calculations. For example - earnings yield, it helps in determining relation between
earnings per share and company’s stock price per share. It is like inverse to P/E ratio. It is a good
return on investment metric. There are several ways to plan by investors to ensure that their
portfolio is diverse and their risk is minimised and losses are set off against possible profits. Some
are below mentioned:
Investors shall first identify their risk appetite in comparison to the returns they are
expecting (Michalkova and Kramarova, 2017). Then, they should spread their
portfolio among different investment instruments such as cash, stocks, bonds, mutual
funds, ETFs, gold, etc.
Within each type of investment channel also, diversification shall be followed. For
example, vary securities on the basis of the industry, market capitalisation, region,
income, value, growth, etc.
Try to identify and include securities that vary in risk factor that they off set each
other’s risks. The only thing that is to be kept in mind is that diversification is not a
one-time process. Investors shall keep regular check over performance of their
investments and adjust securities as per their goals and strategies.
4
Paraphrase This Document
Need a fresh take? Get an instant paraphrase of this document with our AI Paraphraser
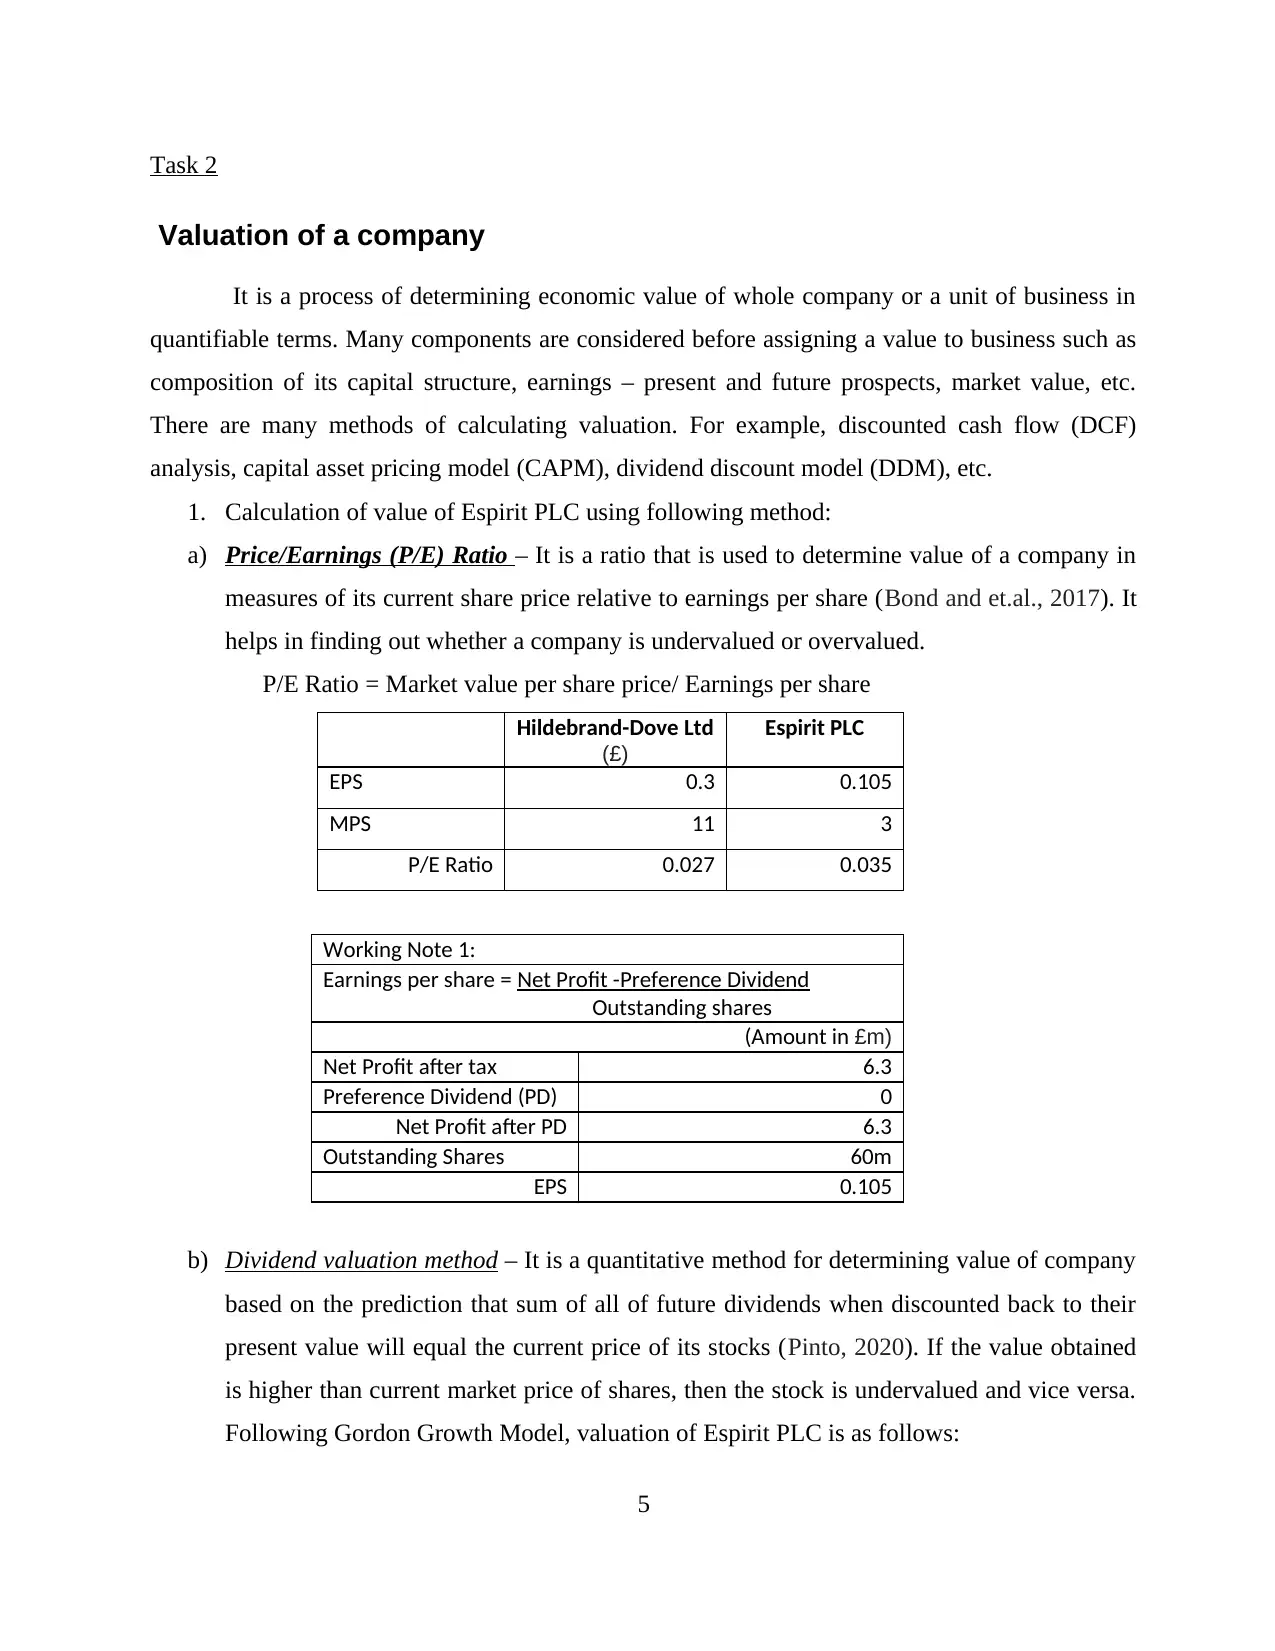
Task 2
Valuation of a company
It is a process of determining economic value of whole company or a unit of business in
quantifiable terms. Many components are considered before assigning a value to business such as
composition of its capital structure, earnings – present and future prospects, market value, etc.
There are many methods of calculating valuation. For example, discounted cash flow (DCF)
analysis, capital asset pricing model (CAPM), dividend discount model (DDM), etc.
1. Calculation of value of Espirit PLC using following method:
a) Price/Earnings (P/E) Ratio – It is a ratio that is used to determine value of a company in
measures of its current share price relative to earnings per share (Bond and et.al., 2017). It
helps in finding out whether a company is undervalued or overvalued.
P/E Ratio = Market value per share price/ Earnings per share
Hildebrand-Dove Ltd
(£)
Espirit PLC
EPS 0.3 0.105
MPS 11 3
P/E Ratio 0.027 0.035
Working Note 1:
Earnings per share = Net Profit -Preference Dividend
Outstanding shares
(Amount in £m)
Net Profit after tax 6.3
Preference Dividend (PD) 0
Net Profit after PD 6.3
Outstanding Shares 60m
EPS 0.105
b) Dividend valuation method – It is a quantitative method for determining value of company
based on the prediction that sum of all of future dividends when discounted back to their
present value will equal the current price of its stocks (Pinto, 2020). If the value obtained
is higher than current market price of shares, then the stock is undervalued and vice versa.
Following Gordon Growth Model, valuation of Espirit PLC is as follows:
5
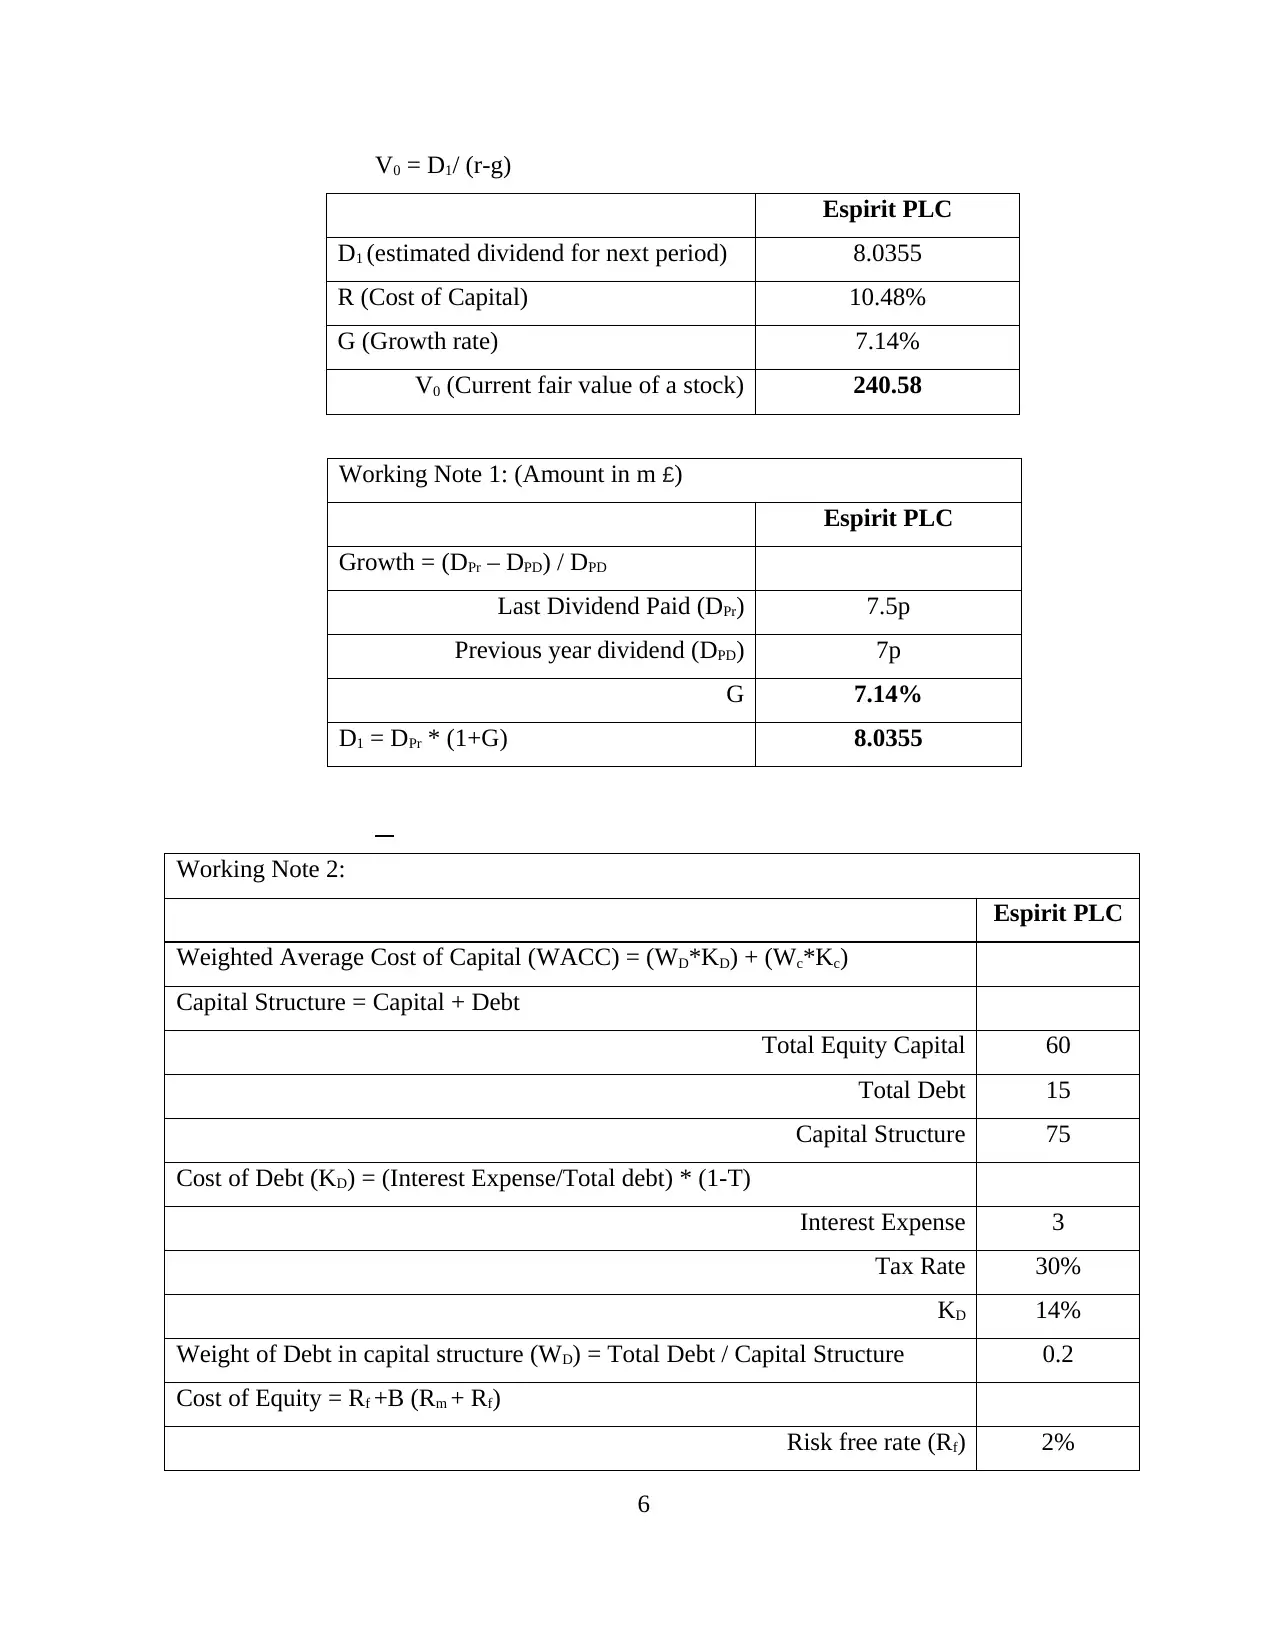
V0 = D1/ (r-g)
Espirit PLC
D1 (estimated dividend for next period) 8.0355
R (Cost of Capital) 10.48%
G (Growth rate) 7.14%
V0 (Current fair value of a stock) 240.58
Working Note 1: (Amount in m £)
Espirit PLC
Growth = (DPr – DPD) / DPD
Last Dividend Paid (DPr) 7.5p
Previous year dividend (DPD) 7p
G 7.14%
D1 = DPr * (1+G) 8.0355
Working Note 2:
Espirit PLC
Weighted Average Cost of Capital (WACC) = (WD*KD) + (Wc*Kc)
Capital Structure = Capital + Debt
Total Equity Capital 60
Total Debt 15
Capital Structure 75
Cost of Debt (KD) = (Interest Expense/Total debt) * (1-T)
Interest Expense 3
Tax Rate 30%
KD 14%
Weight of Debt in capital structure (WD) = Total Debt / Capital Structure 0.2
Cost of Equity = Rf +B (Rm + Rf)
Risk free rate (Rf) 2%
6
Espirit PLC
D1 (estimated dividend for next period) 8.0355
R (Cost of Capital) 10.48%
G (Growth rate) 7.14%
V0 (Current fair value of a stock) 240.58
Working Note 1: (Amount in m £)
Espirit PLC
Growth = (DPr – DPD) / DPD
Last Dividend Paid (DPr) 7.5p
Previous year dividend (DPD) 7p
G 7.14%
D1 = DPr * (1+G) 8.0355
Working Note 2:
Espirit PLC
Weighted Average Cost of Capital (WACC) = (WD*KD) + (Wc*Kc)
Capital Structure = Capital + Debt
Total Equity Capital 60
Total Debt 15
Capital Structure 75
Cost of Debt (KD) = (Interest Expense/Total debt) * (1-T)
Interest Expense 3
Tax Rate 30%
KD 14%
Weight of Debt in capital structure (WD) = Total Debt / Capital Structure 0.2
Cost of Equity = Rf +B (Rm + Rf)
Risk free rate (Rf) 2%
6
⊘ This is a preview!⊘
Do you want full access?
Subscribe today to unlock all pages.
Trusted by 1+ million students worldwide
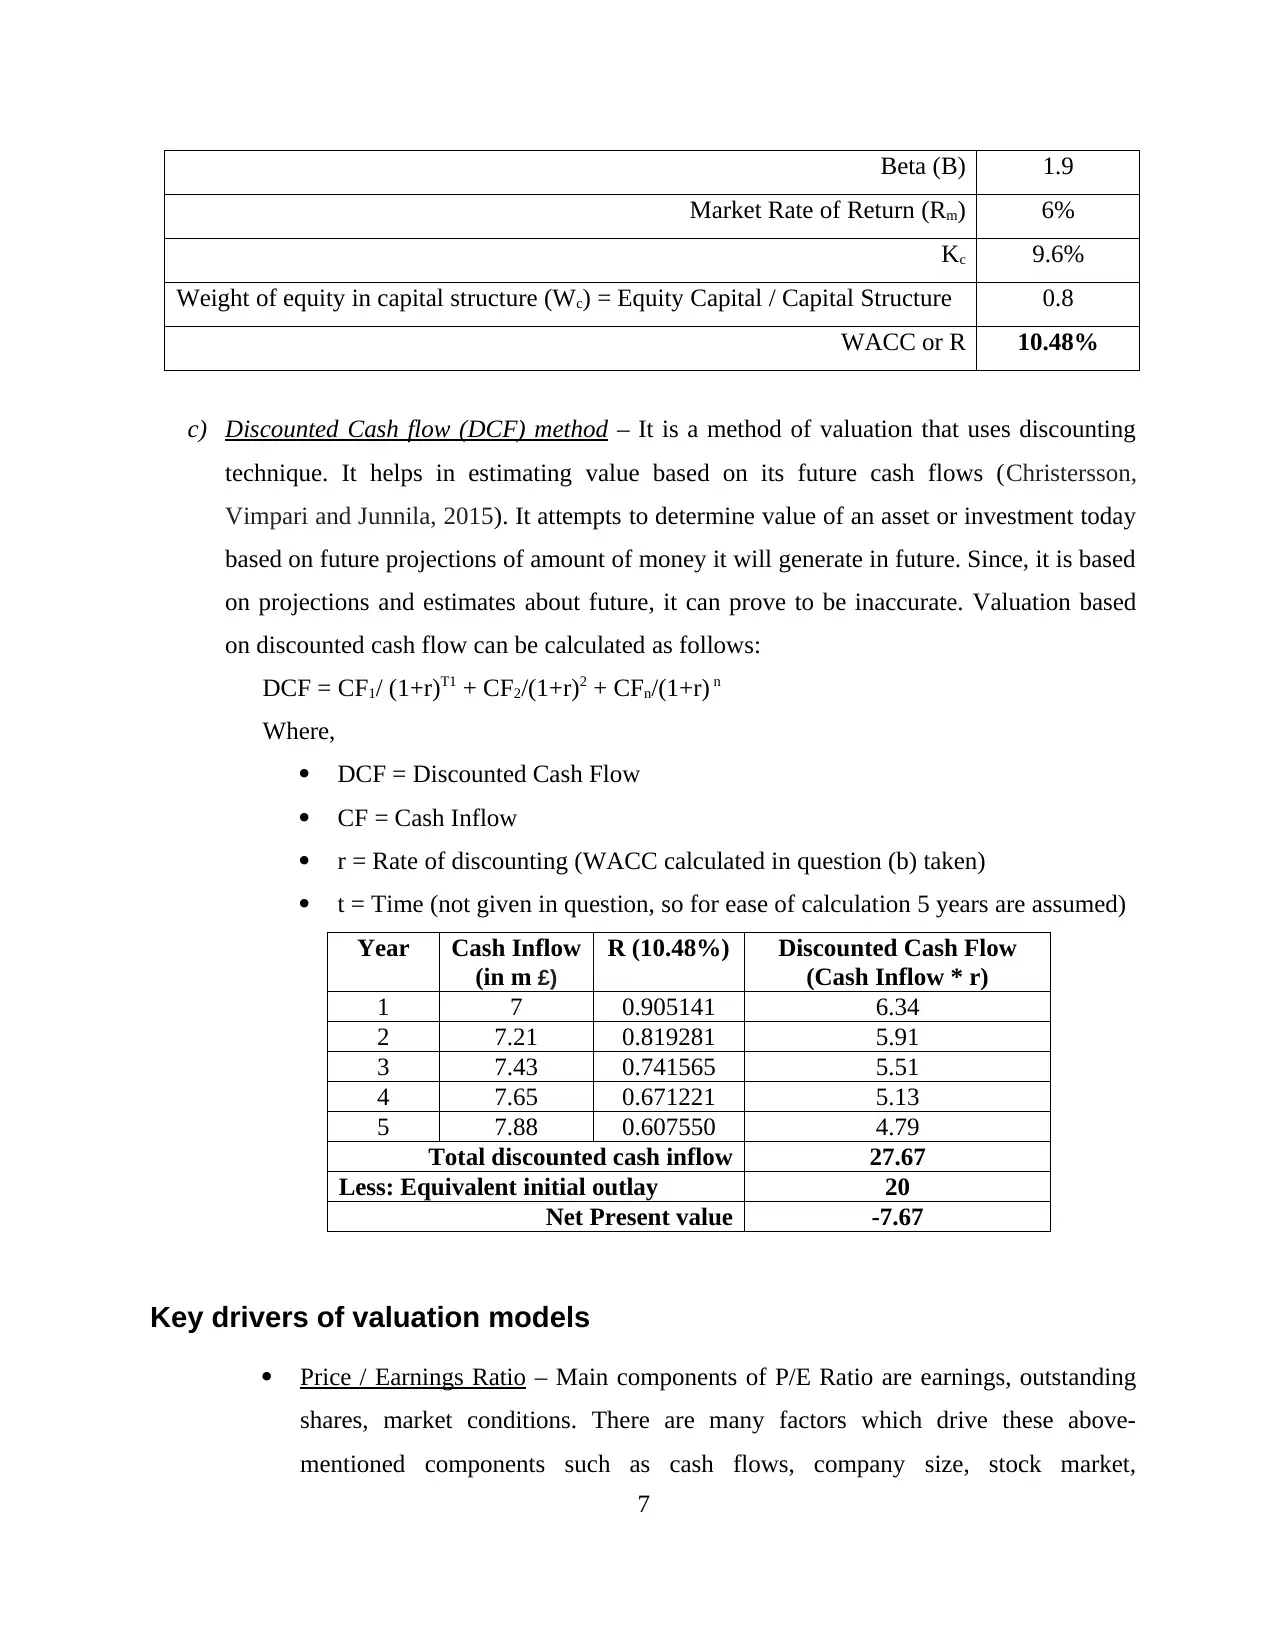
Beta (B) 1.9
Market Rate of Return (Rm) 6%
Kc 9.6%
Weight of equity in capital structure (Wc) = Equity Capital / Capital Structure 0.8
WACC or R 10.48%
c) Discounted Cash flow (DCF) method – It is a method of valuation that uses discounting
technique. It helps in estimating value based on its future cash flows (Christersson,
Vimpari and Junnila, 2015). It attempts to determine value of an asset or investment today
based on future projections of amount of money it will generate in future. Since, it is based
on projections and estimates about future, it can prove to be inaccurate. Valuation based
on discounted cash flow can be calculated as follows:
DCF = CF1/ (1+r)T1 + CF2/(1+r)2 + CFn/(1+r) n
Where,
DCF = Discounted Cash Flow
CF = Cash Inflow
r = Rate of discounting (WACC calculated in question (b) taken)
t = Time (not given in question, so for ease of calculation 5 years are assumed)
Year Cash Inflow
(in m £)
R (10.48%) Discounted Cash Flow
(Cash Inflow * r)
1 7 0.905141 6.34
2 7.21 0.819281 5.91
3 7.43 0.741565 5.51
4 7.65 0.671221 5.13
5 7.88 0.607550 4.79
Total discounted cash inflow 27.67
Less: Equivalent initial outlay 20
Net Present value -7.67
Key drivers of valuation models
Price / Earnings Ratio – Main components of P/E Ratio are earnings, outstanding
shares, market conditions. There are many factors which drive these above-
mentioned components such as cash flows, company size, stock market,
7
Paraphrase This Document
Need a fresh take? Get an instant paraphrase of this document with our AI Paraphraser
government regulations, operating history, growth rate, return on equity, sectorial
leadership, sustainability of earnings, etc.
Finance managers shall check combination of cost control and increase in sales as
drivers for higher earnings. They shall also explore possibilities of venturing in
new products and new markets. They shall also keep a close watch on performance
of stock market. Stock market is volatile and react strongly to every significant
change be it reporting of unexpected profit/loss by management or some potential
opportunity/threat in company’s way (Aprilia, 2015). Companies that are market
leaders or have a reputation of developing innovative productivity solutions enjoy
higher P/E Ratios in market and investors are ready to premium prices for the
shares of such companies. General economic conditions such as interest rates,
operating costs, unemployment rate, etc. of the place where business operates shall
also be in mind of finance managers. It lays effect not only on earnings but on
market price of shares as well.
Dividend Valuation method – Main components of this model are dividend, growth
rate with which dividend grows and cost of capital to the company. These
components are driven by factors such as regular cash flows, retention policy,
dividend expectations of shareholders, dividend distribution policy, time value of
money, cost of equity and debt to the company, risk factor, etc.
While calculating valuation of a company or project, finance managers shall keep
in mind that there are three key inputs in this model namely dividend per share
(DPS), growth rate in DPS and the desired rate of return. Managers should keep a
watch over cash flows and ensure their consistency. Capital structure of finance is
internal decision of management so to ensure least cost to company, managers shall
explore all possible options of investments before choosing one. Shareholders
expect a steady growth rate in dividend pay-out by company which shall be in
coherence with company’s distribution and retention policy. Balancing between
two is responsibility of managers. Time value of money is assumed on the basis of
historical data and future estimates but future is uncertain. So, provision shall be
made according to risk involved.
8
Discounted cash flow method – This method is entirely based on estimates about
future. Thus, it is only as accurate as the assumptions are. All forecasts are based
on key value drivers like free cashflow projections, cost of capital which serves as
discounting factor, growth rate of terminal value, length of forecast period, etc.
Cash flows have strongest influence and can be said as decisive aspect for this
method. So naturally maintaining consistent cash flows shall be focus of finance
managers. They shall always undertake activities to increase sales, decrease cost,
payment modalities, conditions for debtors, etc. to ensure that value of business
always stays positive. Cost of capital is used as discounting factor and hence,
efforts to optimise capital structure and cost of debt and equity shall always be in
the plan of finance department. Growth rate in the terminal value reflects growth of
cashflows at the end of forecasted period (Goedhart, Koller and Wessels, 2015).
So, efforts shall be made to optimise it. Other than cash flow and discount rate,
another major affecting factor is length of the forecast period. Extending or
shortening time period can have substantial impact on the value and results for the
company. So, it should be considered to use period as per the requirement of the
company.
Task 3
Investment appraisal techniques
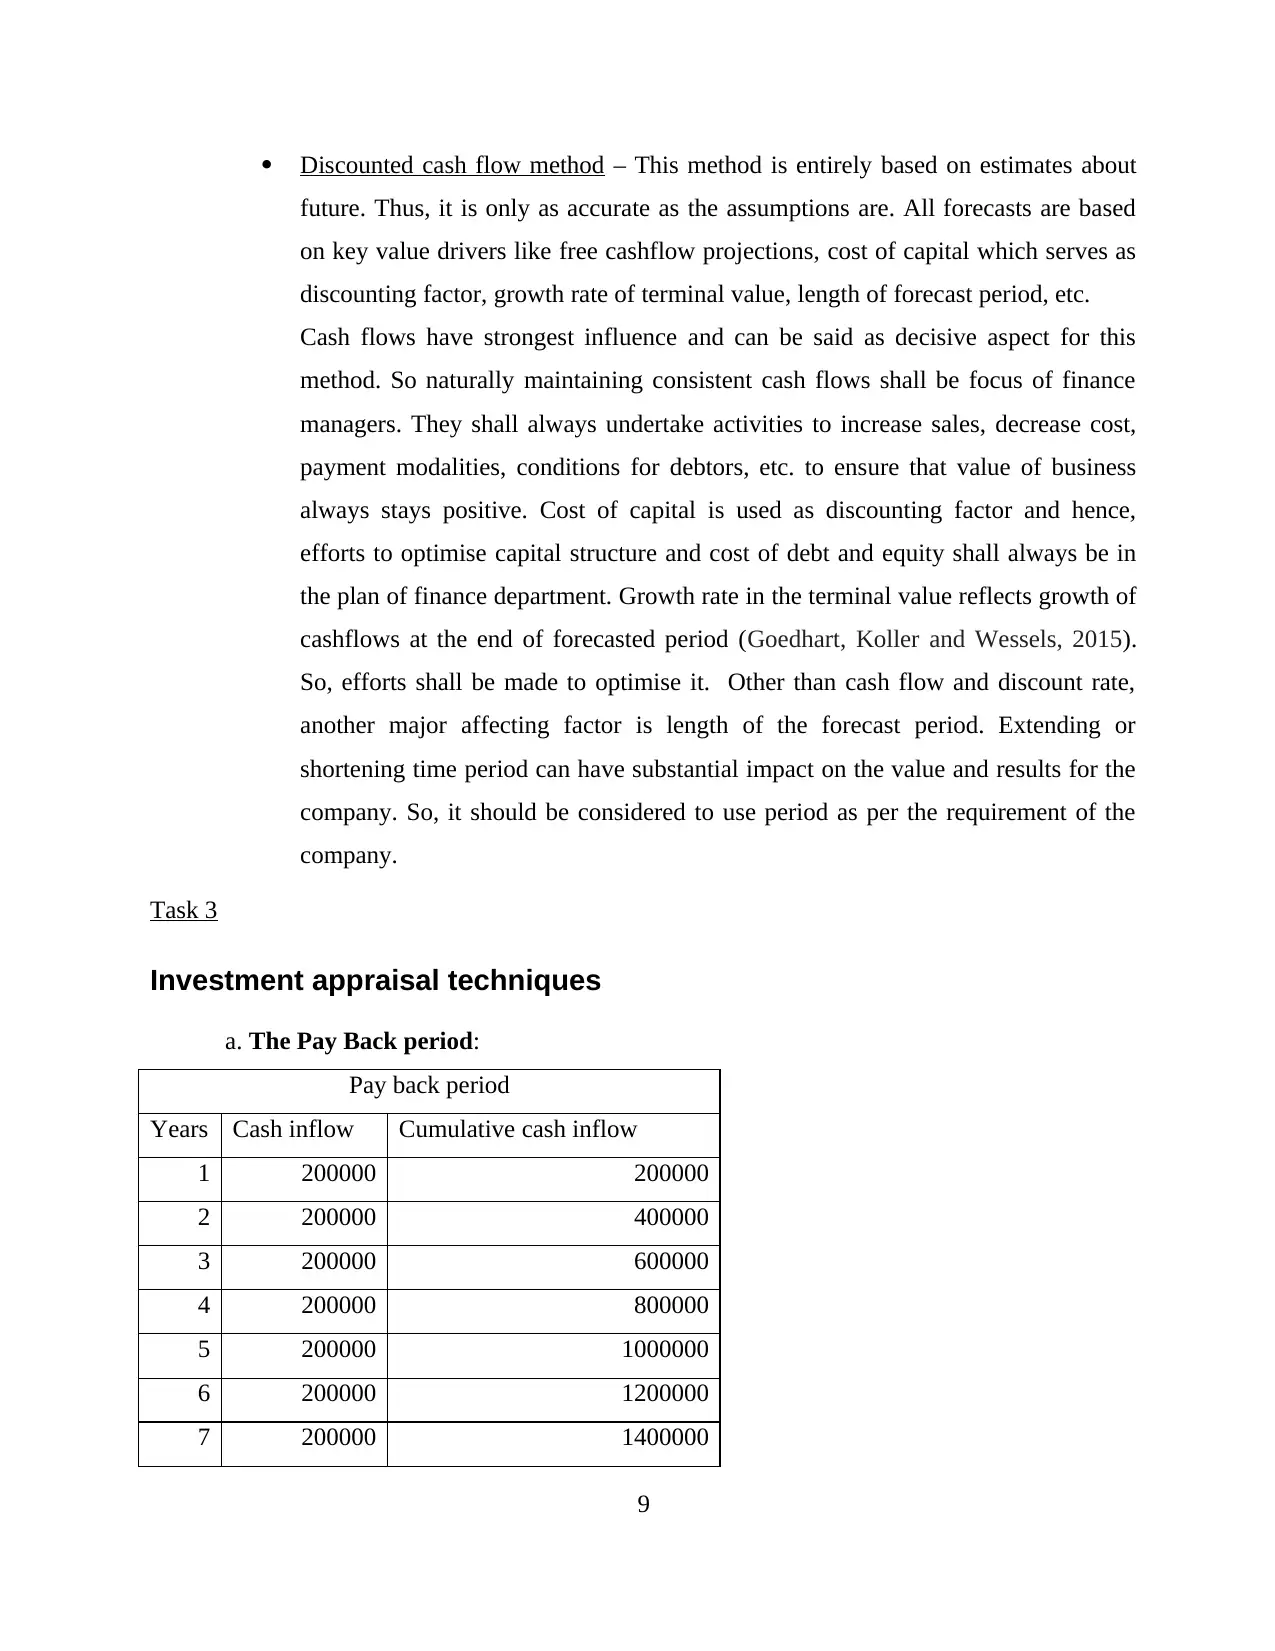
a. The Pay Back period:
Pay back period
Years Cash inflow Cumulative cash inflow
1 200000 200000
2 200000 400000
3 200000 600000
4 200000 800000
5 200000 1000000
6 200000 1200000
7 200000 1400000
9
future. Thus, it is only as accurate as the assumptions are. All forecasts are based
on key value drivers like free cashflow projections, cost of capital which serves as
discounting factor, growth rate of terminal value, length of forecast period, etc.
Cash flows have strongest influence and can be said as decisive aspect for this
method. So naturally maintaining consistent cash flows shall be focus of finance
managers. They shall always undertake activities to increase sales, decrease cost,
payment modalities, conditions for debtors, etc. to ensure that value of business
always stays positive. Cost of capital is used as discounting factor and hence,
efforts to optimise capital structure and cost of debt and equity shall always be in
the plan of finance department. Growth rate in the terminal value reflects growth of
cashflows at the end of forecasted period (Goedhart, Koller and Wessels, 2015).
So, efforts shall be made to optimise it. Other than cash flow and discount rate,
another major affecting factor is length of the forecast period. Extending or
shortening time period can have substantial impact on the value and results for the
company. So, it should be considered to use period as per the requirement of the
company.
Task 3
Investment appraisal techniques
a. The Pay Back period:
Pay back period
Years Cash inflow Cumulative cash inflow
1 200000 200000
2 200000 400000
3 200000 600000
4 200000 800000
5 200000 1000000
6 200000 1200000
7 200000 1400000
9
⊘ This is a preview!⊘
Do you want full access?
Subscribe today to unlock all pages.
Trusted by 1+ million students worldwide
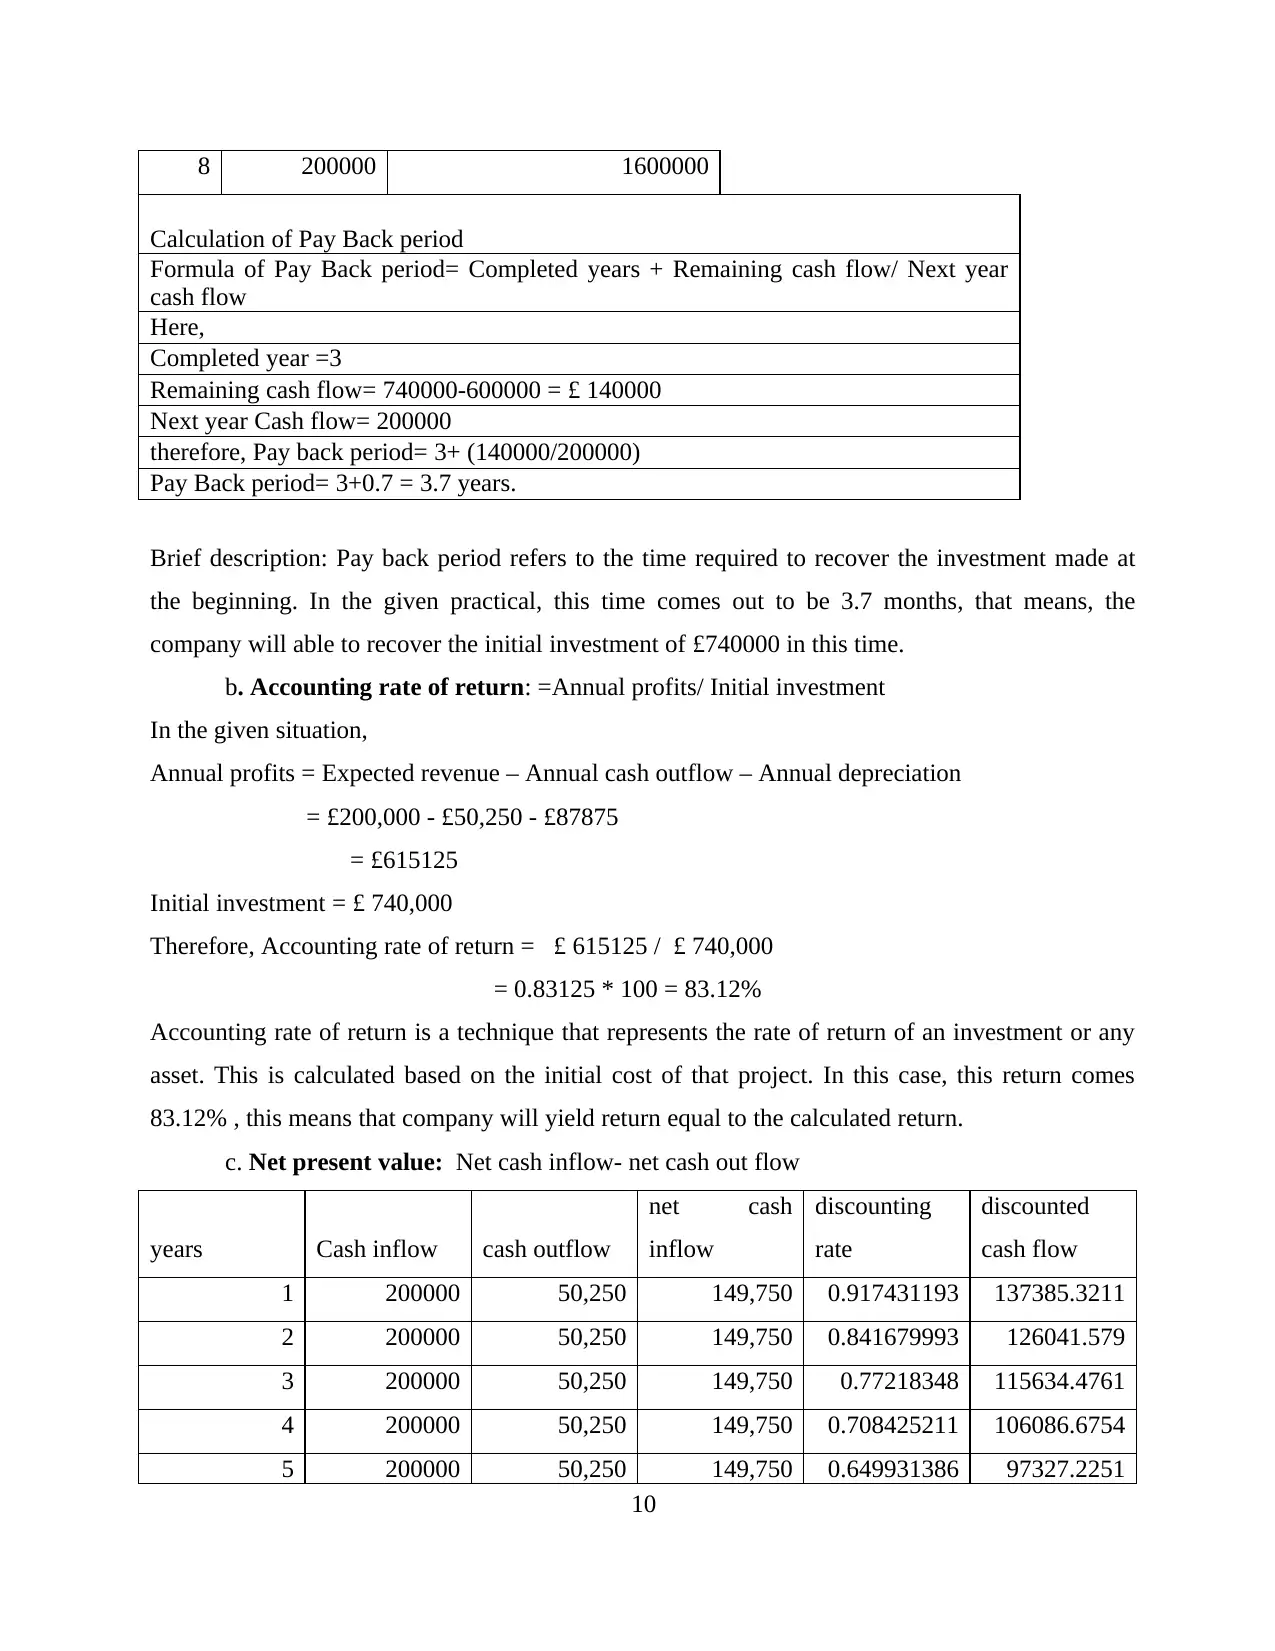
8 200000 1600000
Calculation of Pay Back period
Formula of Pay Back period= Completed years + Remaining cash flow/ Next year
cash flow
Here,
Completed year =3
Remaining cash flow= 740000-600000 = £ 140000
Next year Cash flow= 200000
therefore, Pay back period= 3+ (140000/200000)
Pay Back period= 3+0.7 = 3.7 years.
Brief description: Pay back period refers to the time required to recover the investment made at
the beginning. In the given practical, this time comes out to be 3.7 months, that means, the
company will able to recover the initial investment of £740000 in this time.
b. Accounting rate of return: =Annual profits/ Initial investment
In the given situation,
Annual profits = Expected revenue – Annual cash outflow – Annual depreciation
= £200,000 - £50,250 - £87875
= £615125
Initial investment = £ 740,000
Therefore, Accounting rate of return = £ 615125 / £ 740,000
= 0.83125 * 100 = 83.12%
Accounting rate of return is a technique that represents the rate of return of an investment or any
asset. This is calculated based on the initial cost of that project. In this case, this return comes
83.12% , this means that company will yield return equal to the calculated return.
c. Net present value: Net cash inflow- net cash out flow
years Cash inflow cash outflow
net cash
inflow
discounting
rate
discounted
cash flow
1 200000 50,250 149,750 0.917431193 137385.3211
2 200000 50,250 149,750 0.841679993 126041.579
3 200000 50,250 149,750 0.77218348 115634.4761
4 200000 50,250 149,750 0.708425211 106086.6754
5 200000 50,250 149,750 0.649931386 97327.2251
10
Paraphrase This Document
Need a fresh take? Get an instant paraphrase of this document with our AI Paraphraser
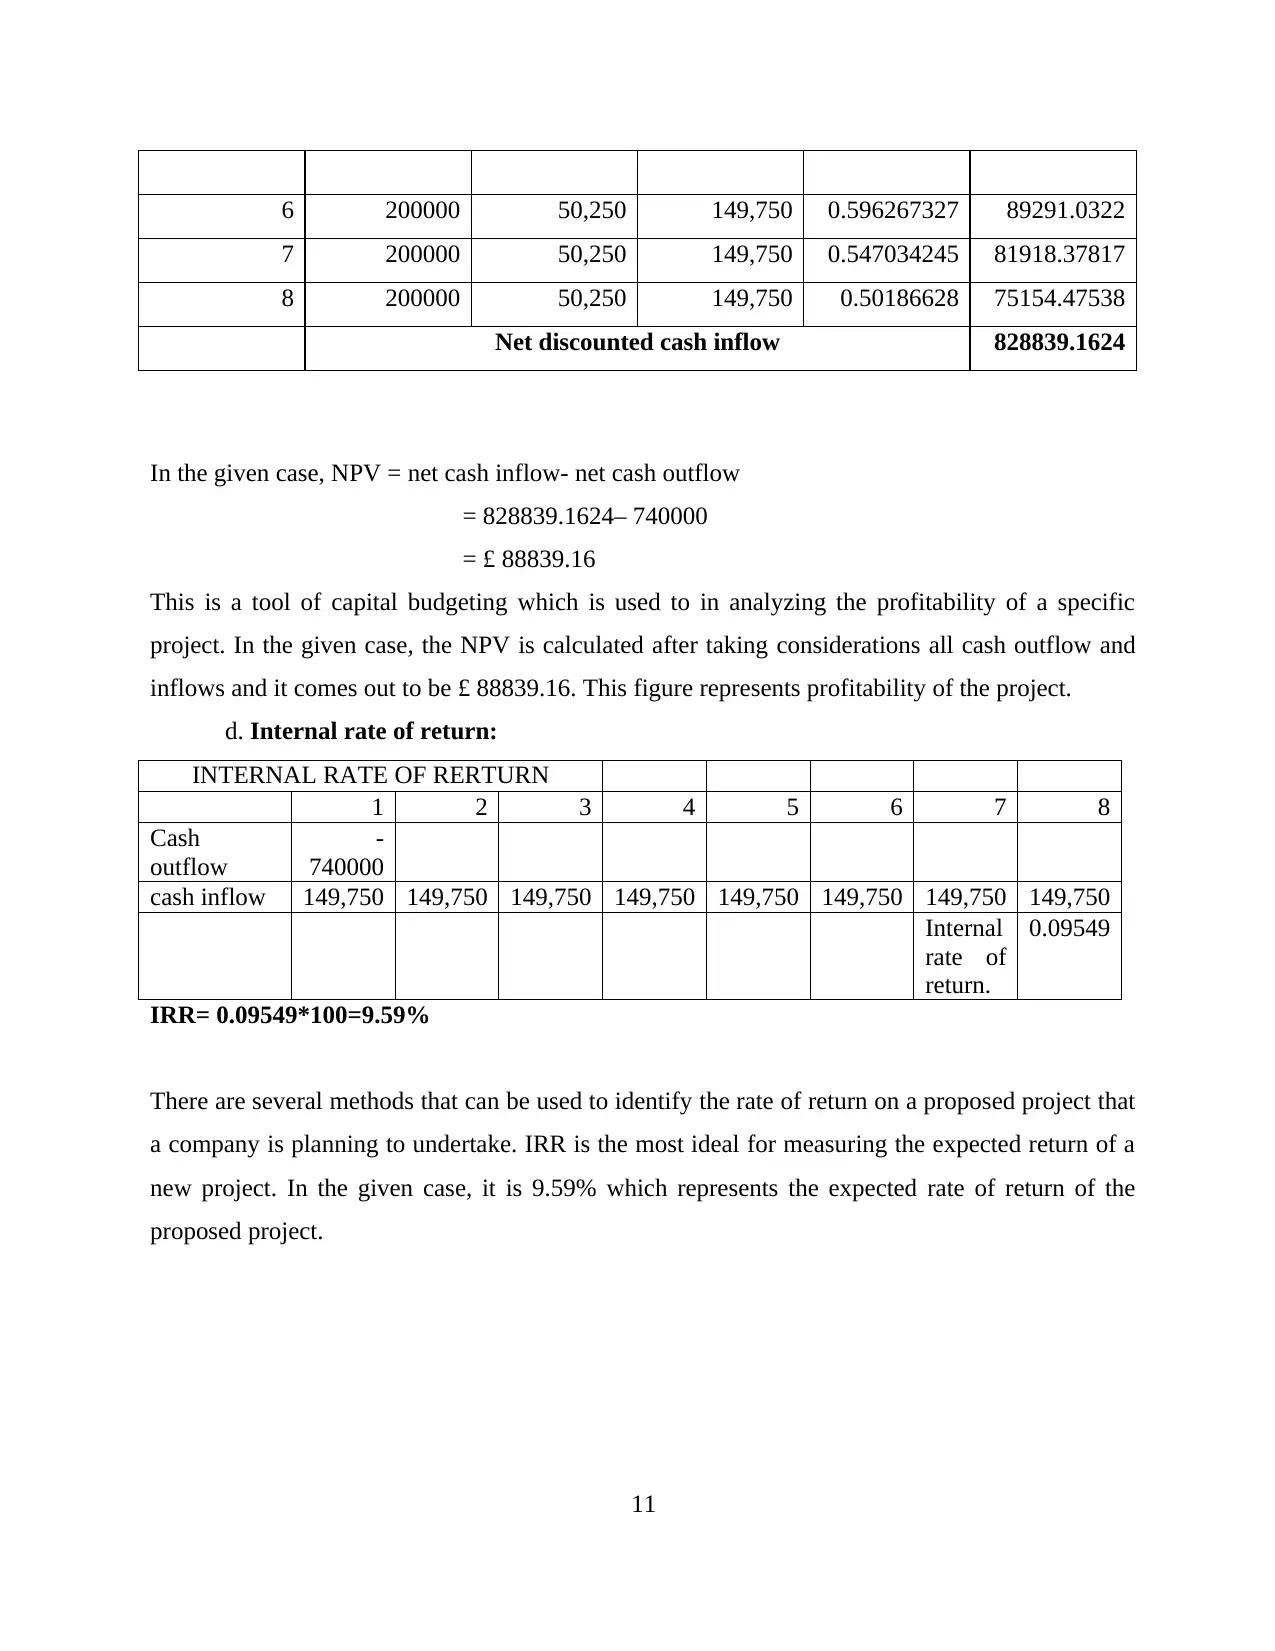
6 200000 50,250 149,750 0.596267327 89291.0322
7 200000 50,250 149,750 0.547034245 81918.37817
8 200000 50,250 149,750 0.50186628 75154.47538
Net discounted cash inflow 828839.1624
In the given case, NPV = net cash inflow- net cash outflow
= 828839.1624– 740000
= £ 88839.16
This is a tool of capital budgeting which is used to in analyzing the profitability of a specific
project. In the given case, the NPV is calculated after taking considerations all cash outflow and
inflows and it comes out to be £ 88839.16. This figure represents profitability of the project.
d. Internal rate of return:
INTERNAL RATE OF RERTURN
1 2 3 4 5 6 7 8
Cash
outflow
-
740000
cash inflow 149,750 149,750 149,750 149,750 149,750 149,750 149,750 149,750
Internal
rate of
return.
0.09549
IRR= 0.09549*100=9.59%
There are several methods that can be used to identify the rate of return on a proposed project that
a company is planning to undertake. IRR is the most ideal for measuring the expected return of a
new project. In the given case, it is 9.59% which represents the expected rate of return of the
proposed project.
11
Evaluation of investment appraisal techniques
There are various techniques of analyzing economic feasibility of proposed project that a
company is planning to acquire. Every technique has certain pros and cons, which are discussed as
below:
1. Pay Back period: It is the simplest method of measuring profitability of a project. It basically
calculates the time period for in which the initial investment will be recovered. It has certain pros
and cons as well which are enumerated below:
Advantages of Pay Back period: It is the simplest method that measures economic
feasibility of a project. It is an easy way to calculate pay-back period of different options available
with the company. Pay-back period also has many drawbacks.
Disadvantages of Pay Back period: The most significant limitation of this method is that it
does not consider time value of money. That means it weighs the value of I unit of money at
present time as well in later period of time (for say, after 5 years). Due to this limitation it lacks to
feature of clearness of profitability of a project. This analysis tool only considers the flows until
the initial investment is not recovered, and ignores, the inflows that occur after that period. It is
essential to consider every penny of inflows to measure the actual profitability of project.
Sometimes a project have lower returns in beginning of time period but have significant high
returns at the later time period. This unevenness of cash inflows may result into high pay-back
period which represents lower profitability of project, which is actually not true.
2. Accounting rate of return: It is capital budgeting metric that is a useful tool if the purpose of
calculation is investment profitability (Arjunan, 2019). ARR is basically the tool of comparing
different projects, to calculate expected return of each project. This tool help is providing
assistance to managers in taking decision about an investment or acquisition.
Advantages of Accounting rate of return: it is very easy to compute and also simple to
understand. It also take total profits that will occur over total economic life of project into
consideration. It actually considers the concept of net earnings, which means, the concept of profit
that arises after deducting tax and depreciation. This is a vital factor is measuring the profitability
of proposed investment or project. This method gives a clear view about the profitability of
project. This tool is very useful in measuring current performance of firm.
12
⊘ This is a preview!⊘
Do you want full access?
Subscribe today to unlock all pages.
Trusted by 1+ million students worldwide
1 out of 15
Related Documents


Your All-in-One AI-Powered Toolkit for Academic Success.
+13062052269
info@desklib.com
Available 24*7 on WhatsApp / Email
![[object Object]](/_next/static/media/star-bottom.7253800d.svg)
Unlock your academic potential
Copyright © 2020–2026 A2Z Services. All Rights Reserved. Developed and managed by ZUCOL.