CBE6382: Corporate Financial Management Report on Rio Tinto
VerifiedAdded on 2022/10/01
|22
|5335
|22
Report
AI Summary
This report provides a comprehensive financial analysis of Rio Tinto, examining its corporate financial management. It begins with an introduction to corporate finance and discusses corporate governance within Rio Tinto. The report then delves into the company's financial performance, analyzing profitability, liquidity, efficiency, and solvency ratios for the years 2017 and 2018. It evaluates the company's dividend policy, risk profile, and optimal capital structure, including a detailed discussion of the DCF model. The report further explores investment appraisal techniques, including Net Present Value (NPV), Internal Rate of Return (IRR), Payback Period, and Profitability Index. The analysis is supported by financial data and relevant literature, providing insights into Rio Tinto's financial health and strategic decisions. The report concludes with a summary of findings and recommendations.
Running Head: CORPORATE FINANCIAL MANAGEMENT
1
CORPORATE FINANCIAL MANAGEMENT
1
CORPORATE FINANCIAL MANAGEMENT
Paraphrase This Document
Need a fresh take? Get an instant paraphrase of this document with our AI Paraphraser
Running Head: CORPORATE FINANCIAL MANAGEMENT
Contents
Part A..........................................................................................................................................................3
Introduction.................................................................................................................................................3
Corporate governance..................................................................................................................................4
Financial performance.................................................................................................................................4
Dividend Policy...........................................................................................................................................7
Risk Profile..................................................................................................................................................8
Optimal Capital Structure of Rio Tinto.......................................................................................................9
DCF Model................................................................................................................................................11
Part B.........................................................................................................................................................13
NPV.......................................................................................................................................................14
IRR........................................................................................................................................................15
Payback Period......................................................................................................................................16
Profitability Index..................................................................................................................................17
Conclusion.................................................................................................................................................18
References.................................................................................................................................................20
Running Head: CORPORATE FINANCIAL MANAGEMENT
Part A
Introduction
Corporate finance is an area of finance that deals with the sources of funding, capital structure,
the action that manager take to increase the value of the organization. It is required to use the
financial tool to allocate the financial resources appropriately (Fracassi, 2016). It is essential to
analyze the financial position of the company to allocate the resources in an appropriate manner.
There are different terms and policy developed in the form of standard just to manage the
financial statements of the company accurately such as income statements, profit and loss and
balance sheet. The items are recorded under the different heads as per the standards and policy so
that the financial performance of the company is easily evaluated (Dang, Li, and Yang, 2018).
However, the analysis or forecasting the financial position of the company it is necessary to
evaluate the financial ratios and the other calculations (Tricker, and Tricker, 2015). In this
report, the discussion is based on the financial analysis of the company. In this paper, Rio Tinto
has been taken into consideration to evaluate the financial performance as per the standards.
Rio Tinto is an Australian multinational company which operates the business in metals and
mining. It was founded in the year 1873 while purchasing the mine complex. The company is
growing with the method of mergers and acquisitions. It operates in six components such as
Australia and Canada (Rio Tinto, 2018a).
The report is classified in two parts such as task 1 and task 2. In task 1, the different terms and
policy of financial statements will be discussed. In task 2, investment appraisal techniques will
be discussed with the evaluation.
⊘ This is a preview!⊘
Do you want full access?
Subscribe today to unlock all pages.
Trusted by 1+ million students worldwide
Running Head: CORPORATE FINANCIAL MANAGEMENT
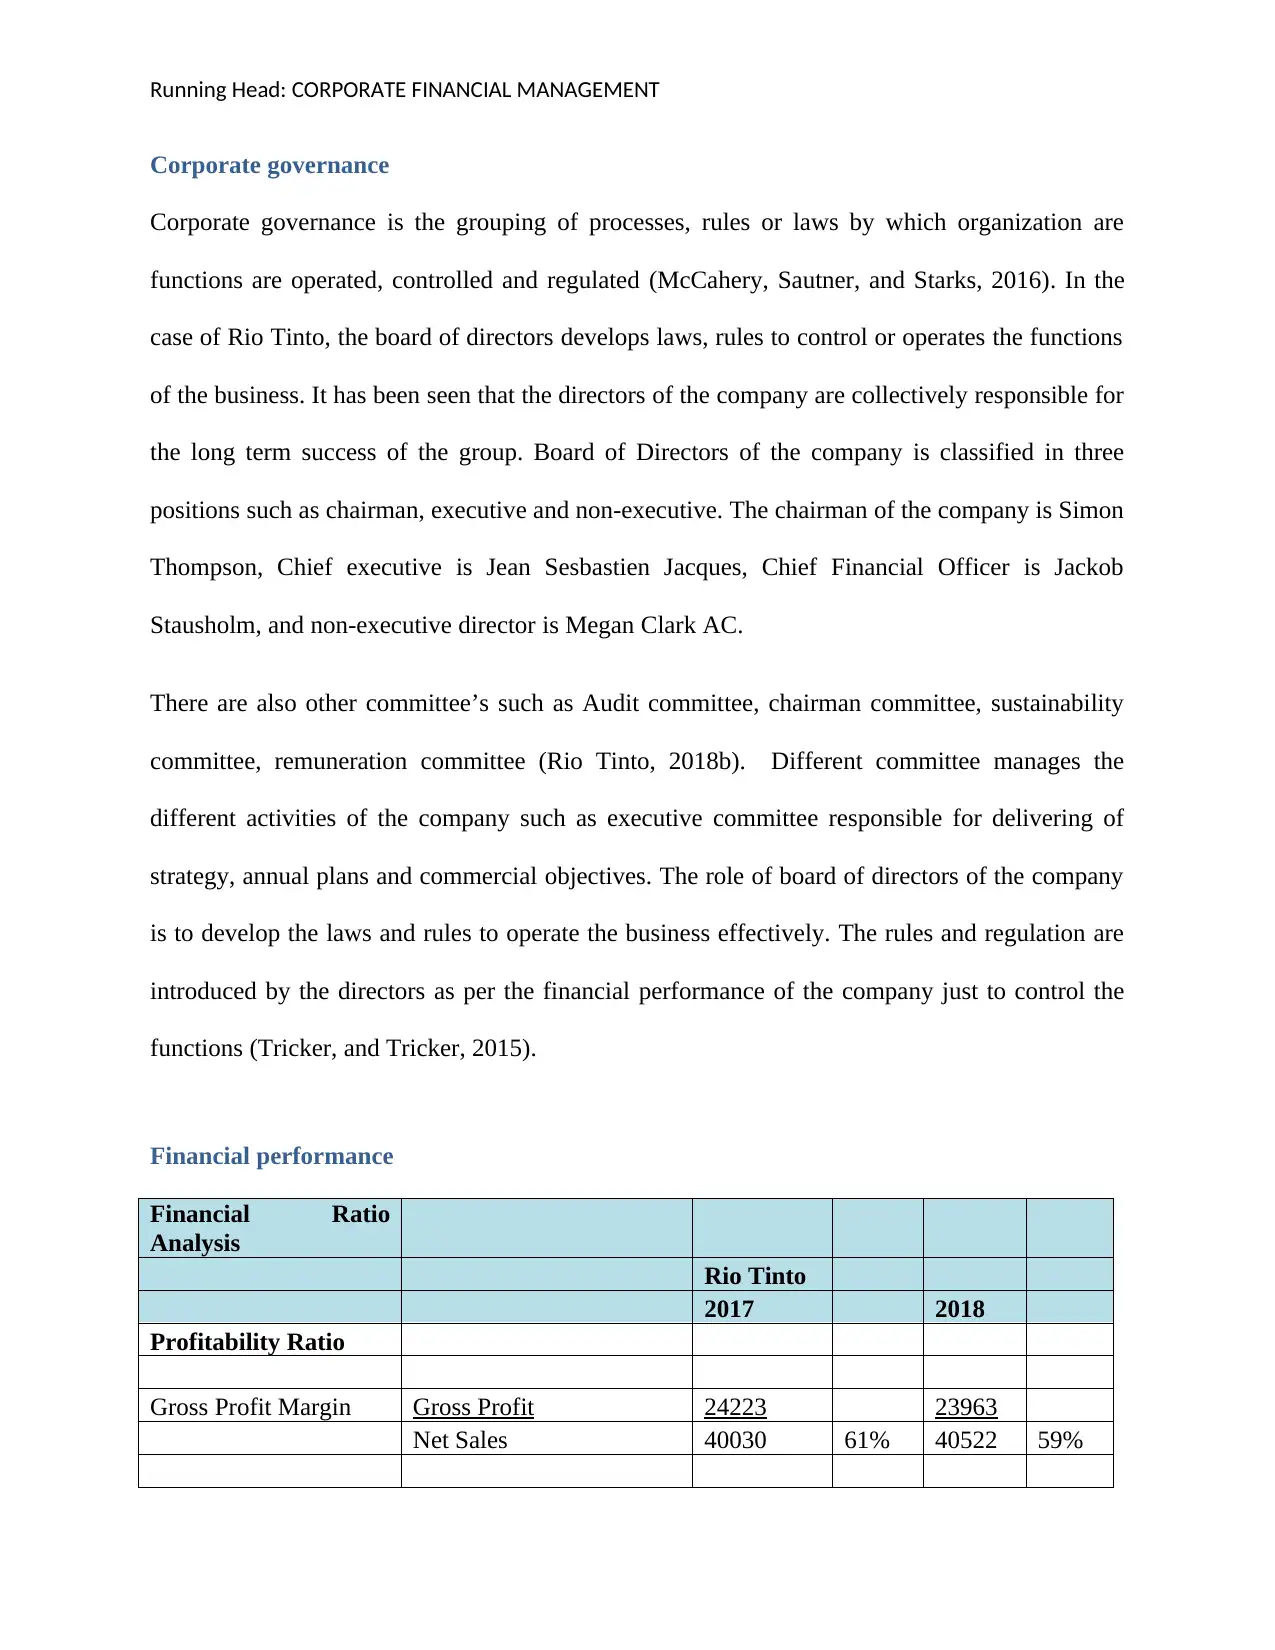
Corporate governance
Corporate governance is the grouping of processes, rules or laws by which organization are
functions are operated, controlled and regulated (McCahery, Sautner, and Starks, 2016). In the
case of Rio Tinto, the board of directors develops laws, rules to control or operates the functions
of the business. It has been seen that the directors of the company are collectively responsible for
the long term success of the group. Board of Directors of the company is classified in three
positions such as chairman, executive and non-executive. The chairman of the company is Simon
Thompson, Chief executive is Jean Sesbastien Jacques, Chief Financial Officer is Jackob
Stausholm, and non-executive director is Megan Clark AC.
There are also other committee’s such as Audit committee, chairman committee, sustainability
committee, remuneration committee (Rio Tinto, 2018b). Different committee manages the
different activities of the company such as executive committee responsible for delivering of
strategy, annual plans and commercial objectives. The role of board of directors of the company
is to develop the laws and rules to operate the business effectively. The rules and regulation are
introduced by the directors as per the financial performance of the company just to control the
functions (Tricker, and Tricker, 2015).
Financial performance
Financial Ratio
Analysis
Rio Tinto
2017 2018
Profitability Ratio
Gross Profit Margin Gross Profit 24223 23963
Net Sales 40030 61% 40522 59%
Paraphrase This Document
Need a fresh take? Get an instant paraphrase of this document with our AI Paraphraser
Running Head: CORPORATE FINANCIAL MANAGEMENT
Profit Margin Net Profit 8762 13638
Net Sales 40030 22% 40522 34%
Return on Equity
Net income after
preference dividends 8762 13638
Average common stock
holder's equity 6319 139% 6024 226%
Liquidity Ratio
Current Ratio Current assets 18678 18185
Current liabilities 11349 1.65 10865 1.67
Quick Ratio Quick assets 9365.0 13377
Current liabilities 11349 0.83 10865 1.23
Efficiency Ratio
Average Receivable
days Receivables 3472 3447
sales *365 40030 31.66 40522 31.05
Average Payable Days Payables 3,255 3180
Sales*365 40030 29.68 40522 28.64
Solvency Ratio
Debt to Equity Ratio Total Debt 14,575 12,401
Total Equity 8,666 1.68 8,000 1.55
Debt Ratio Total Debt 14,575 12,401
Total assets 95,726 0.15 90,949 0.14
Market Performance
Ratio
Earnings Per share
Net income after
preference dividends 8762 13638
Total common stock 4360.00 2.01 3688 3.70
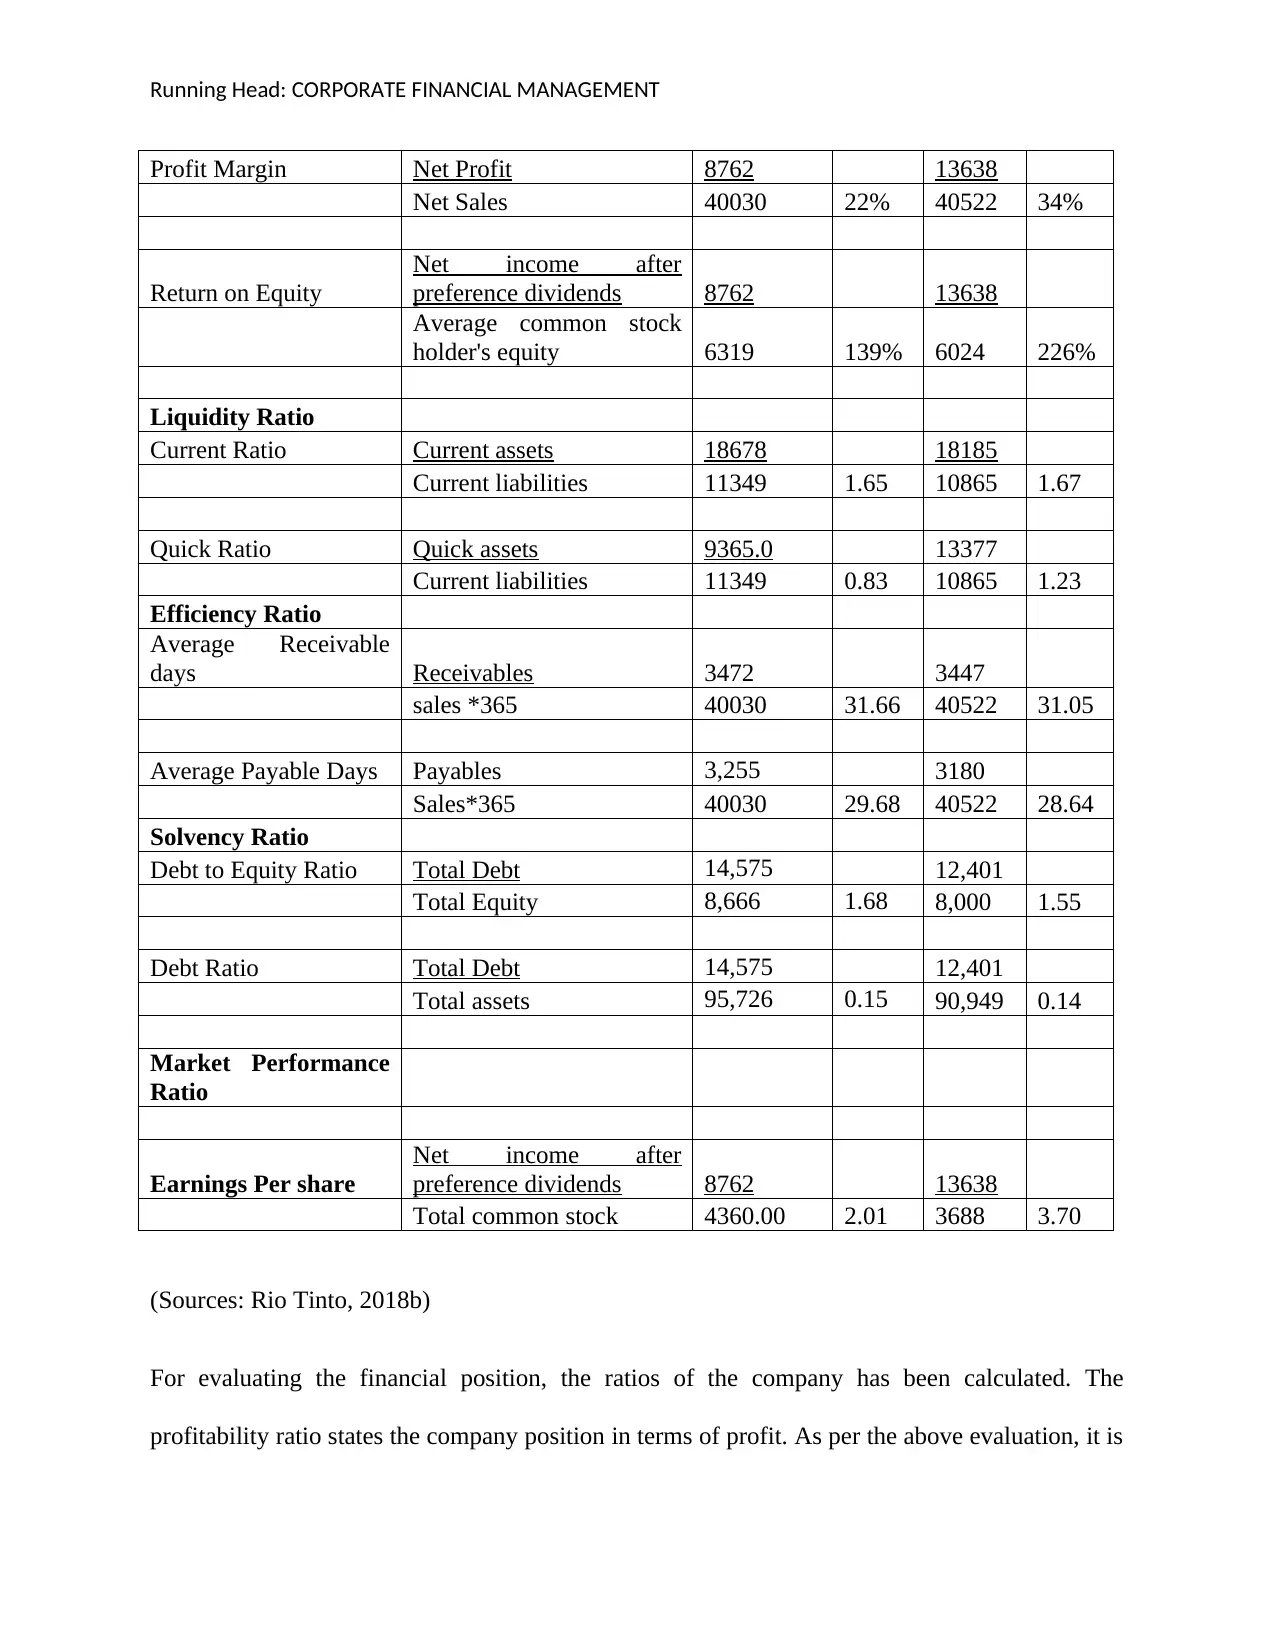
(Sources: Rio Tinto, 2018b)
For evaluating the financial position, the ratios of the company has been calculated. The
profitability ratio states the company position in terms of profit. As per the above evaluation, it is
Profit Margin Net Profit 8762 13638
Net Sales 40030 22% 40522 34%
Return on Equity
Net income after
preference dividends 8762 13638
Average common stock
holder's equity 6319 139% 6024 226%
Liquidity Ratio
Current Ratio Current assets 18678 18185
Current liabilities 11349 1.65 10865 1.67
Quick Ratio Quick assets 9365.0 13377
Current liabilities 11349 0.83 10865 1.23
Efficiency Ratio
Average Receivable
days Receivables 3472 3447
sales *365 40030 31.66 40522 31.05
Average Payable Days Payables 3,255 3180
Sales*365 40030 29.68 40522 28.64
Solvency Ratio
Debt to Equity Ratio Total Debt 14,575 12,401
Total Equity 8,666 1.68 8,000 1.55
Debt Ratio Total Debt 14,575 12,401
Total assets 95,726 0.15 90,949 0.14
Market Performance
Ratio
Earnings Per share
Net income after
preference dividends 8762 13638
Total common stock 4360.00 2.01 3688 3.70
(Sources: Rio Tinto, 2018b)
For evaluating the financial position, the ratios of the company has been calculated. The
profitability ratio states the company position in terms of profit. As per the above evaluation, it is
Running Head: CORPORATE FINANCIAL MANAGEMENT
observed that the amount of equity is increasing as compare to previous year. In the year 2017,
the percentage of return on equity is 139% but in the year 2018, it is increasing by 226% which
indicates that the value of equity is increasing which given by the company to its shareholders.
The amount of profit is increasing with the increasing percentage. In the year 2017, the
percentage of profit margin is 22% that is increasing by 34% (Morning Star, 2018). Liquidity
ratio defines the operating position of the company by evaluating the assets.
The liquidity position of the company is improving as the company invests in current assets
rather than the fixed assets. As per the evaluation, it has been seen that the amount of current
asset is increasing by 1.65 times to 1.67 times which indicates that the improving position of
liquidity. Efficiency ratio defines the efficiency to operate the business (Williams, and
Dobelman, 2017). In the year 2017, the days of collection of amount is decreasing with the
minor difference which indicates that the company did not improve its performance in terms of
collection. But while paying the amount, the organization pays the amount in fewer days as
compare to previous year. In the year 2017, the average payable days are 29 but in the year 2018,
it decreasing by 28 days.
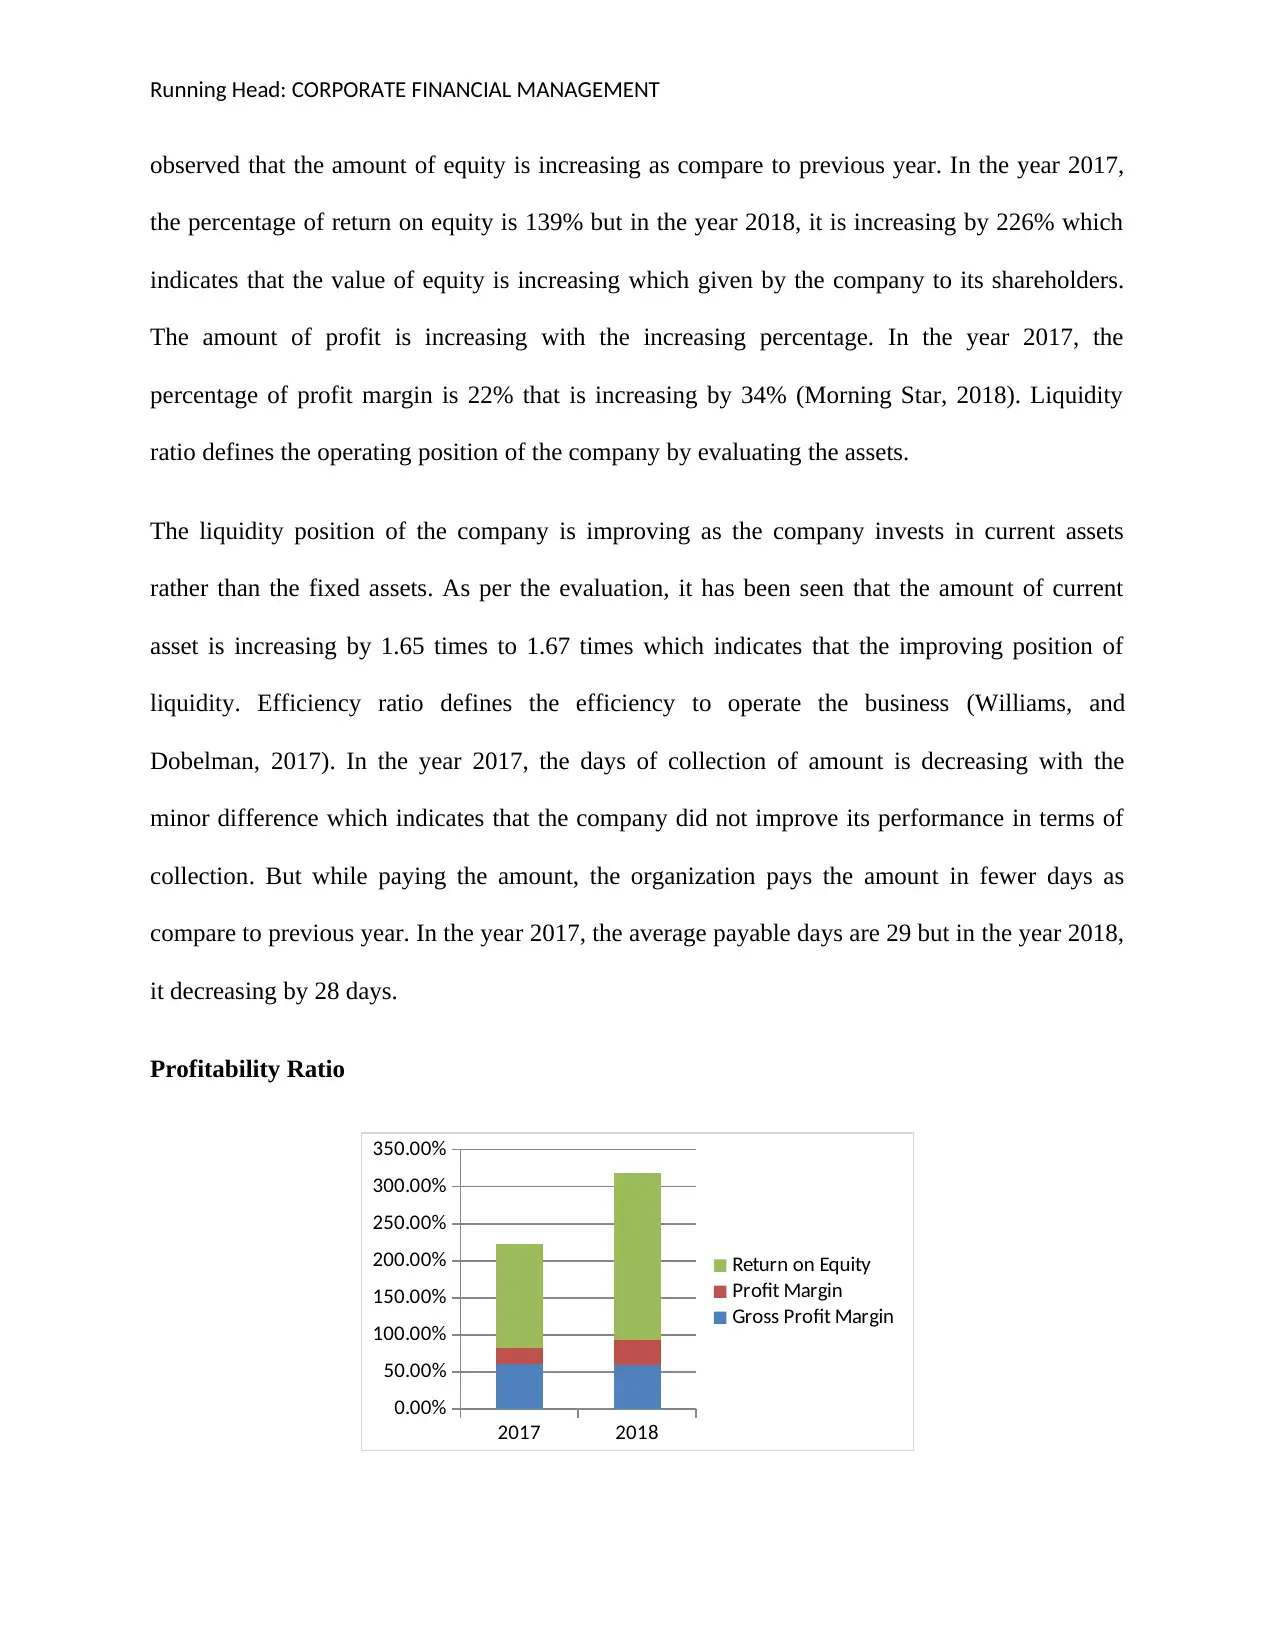
Profitability Ratio
2017 2018
0.00%
50.00%
100.00%
150.00%
200.00%
250.00%
300.00%
350.00%
Return on Equity
Profit Margin
Gross Profit Margin
observed that the amount of equity is increasing as compare to previous year. In the year 2017,
the percentage of return on equity is 139% but in the year 2018, it is increasing by 226% which
indicates that the value of equity is increasing which given by the company to its shareholders.
The amount of profit is increasing with the increasing percentage. In the year 2017, the
percentage of profit margin is 22% that is increasing by 34% (Morning Star, 2018). Liquidity
ratio defines the operating position of the company by evaluating the assets.
The liquidity position of the company is improving as the company invests in current assets
rather than the fixed assets. As per the evaluation, it has been seen that the amount of current
asset is increasing by 1.65 times to 1.67 times which indicates that the improving position of
liquidity. Efficiency ratio defines the efficiency to operate the business (Williams, and
Dobelman, 2017). In the year 2017, the days of collection of amount is decreasing with the
minor difference which indicates that the company did not improve its performance in terms of
collection. But while paying the amount, the organization pays the amount in fewer days as
compare to previous year. In the year 2017, the average payable days are 29 but in the year 2018,
it decreasing by 28 days.
Profitability Ratio
2017 2018
0.00%
50.00%
100.00%
150.00%
200.00%
250.00%
300.00%
350.00%
Return on Equity
Profit Margin
Gross Profit Margin
⊘ This is a preview!⊘
Do you want full access?
Subscribe today to unlock all pages.
Trusted by 1+ million students worldwide
Running Head: CORPORATE FINANCIAL MANAGEMENT
The solvency ratio defines that the stability of the company (Robinson, Henry, Pirie, and
Broihahn, 2015). As per the evaluation of solvency ratio of the company, it is observed that the
amount of debts is decreasing which reflects positive sign to operate smoothly in the market. In
the previous year 2017, the debt ratio is 0.15 which is decreasing with the ratio 0.14 (Rio Tinto,
2018b). The debt ratio of the company indicates that it can survive for long time in the market as
it borrows the fewer amounts on credit which is a positive situation.
Dividend Policy
Dividend Policy is the financial policy which is used to evaluate the amount of dividend by the
company to its shareholders. Under this policy, the frequency is also evaluated with which the
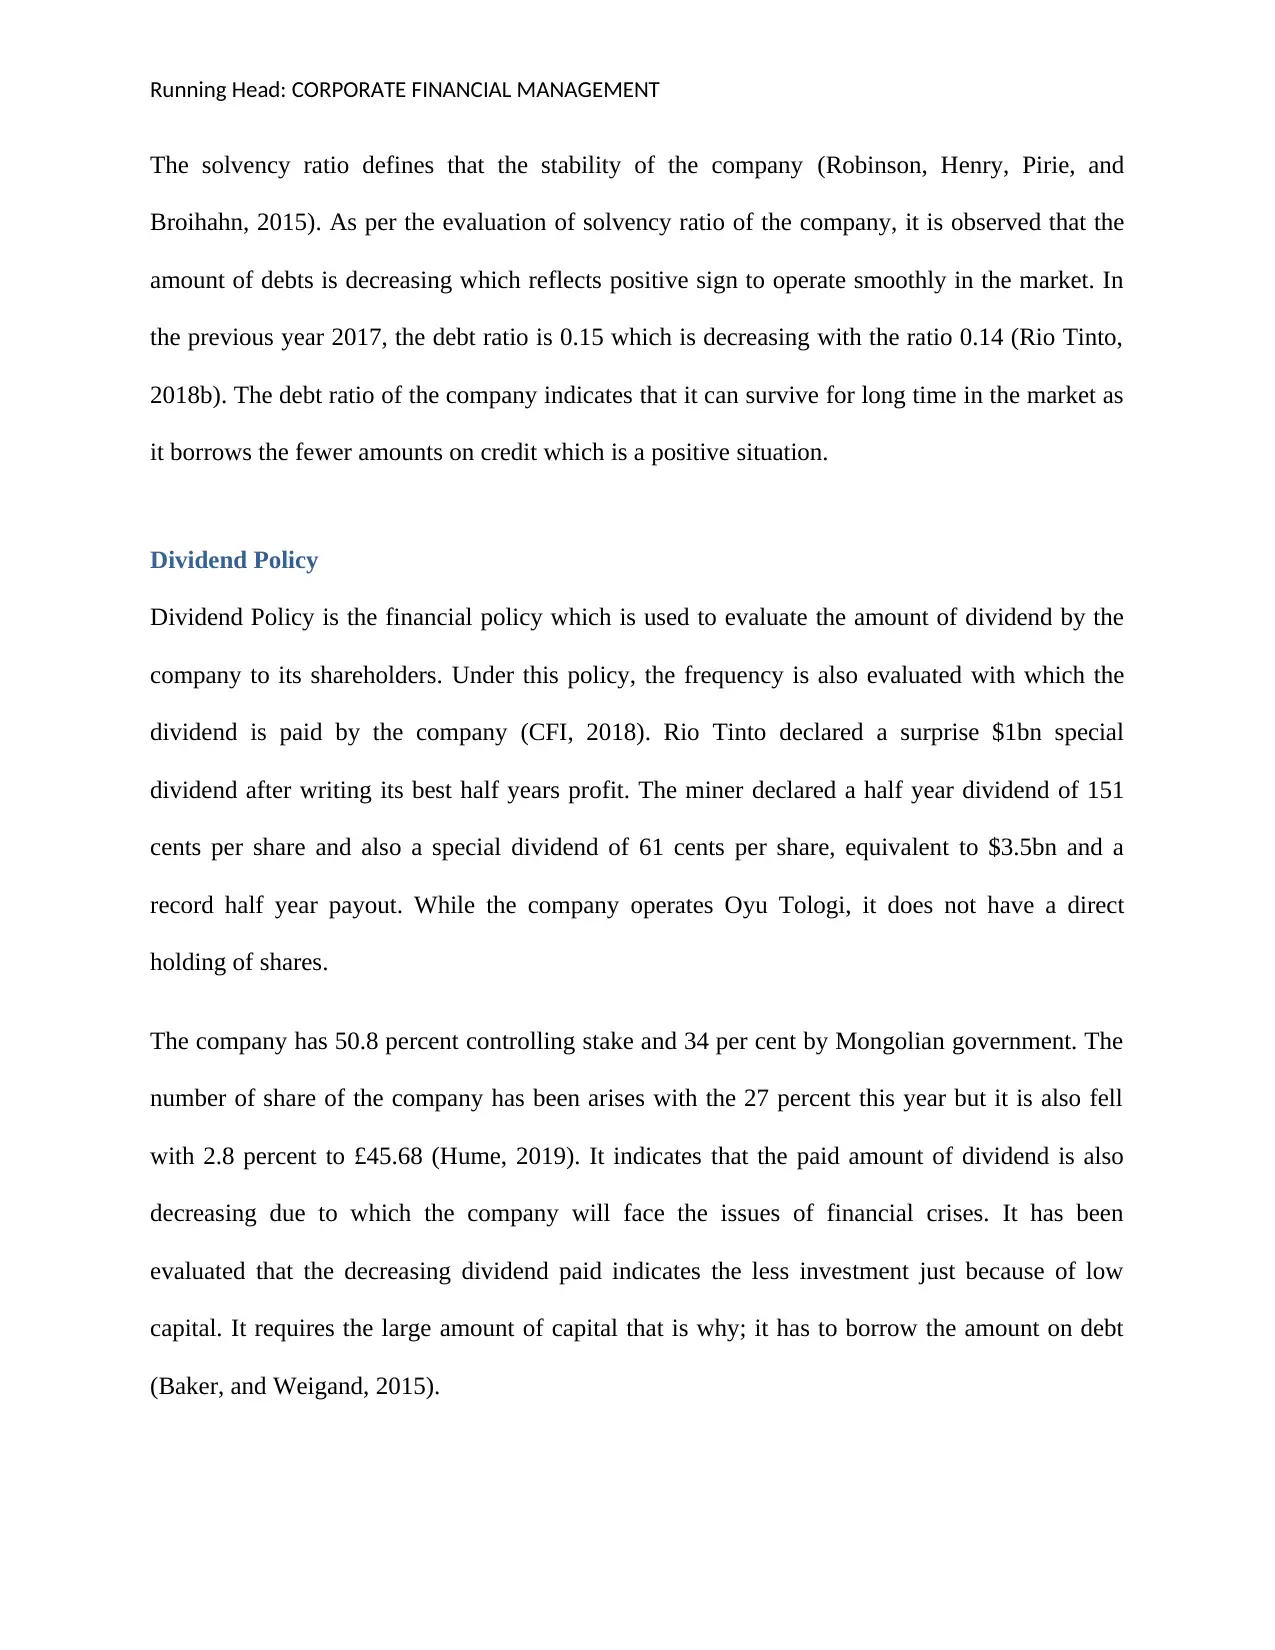
dividend is paid by the company (CFI, 2018). Rio Tinto declared a surprise $1bn special
dividend after writing its best half years profit. The miner declared a half year dividend of 151
cents per share and also a special dividend of 61 cents per share, equivalent to $3.5bn and a
record half year payout. While the company operates Oyu Tologi, it does not have a direct
holding of shares.
The company has 50.8 percent controlling stake and 34 per cent by Mongolian government. The
number of share of the company has been arises with the 27 percent this year but it is also fell
with 2.8 percent to £45.68 (Hume, 2019). It indicates that the paid amount of dividend is also
decreasing due to which the company will face the issues of financial crises. It has been
evaluated that the decreasing dividend paid indicates the less investment just because of low
capital. It requires the large amount of capital that is why; it has to borrow the amount on debt
(Baker, and Weigand, 2015).
The solvency ratio defines that the stability of the company (Robinson, Henry, Pirie, and
Broihahn, 2015). As per the evaluation of solvency ratio of the company, it is observed that the
amount of debts is decreasing which reflects positive sign to operate smoothly in the market. In
the previous year 2017, the debt ratio is 0.15 which is decreasing with the ratio 0.14 (Rio Tinto,
2018b). The debt ratio of the company indicates that it can survive for long time in the market as
it borrows the fewer amounts on credit which is a positive situation.
Dividend Policy
Dividend Policy is the financial policy which is used to evaluate the amount of dividend by the
company to its shareholders. Under this policy, the frequency is also evaluated with which the
dividend is paid by the company (CFI, 2018). Rio Tinto declared a surprise $1bn special
dividend after writing its best half years profit. The miner declared a half year dividend of 151
cents per share and also a special dividend of 61 cents per share, equivalent to $3.5bn and a
record half year payout. While the company operates Oyu Tologi, it does not have a direct
holding of shares.
The company has 50.8 percent controlling stake and 34 per cent by Mongolian government. The
number of share of the company has been arises with the 27 percent this year but it is also fell
with 2.8 percent to £45.68 (Hume, 2019). It indicates that the paid amount of dividend is also
decreasing due to which the company will face the issues of financial crises. It has been
evaluated that the decreasing dividend paid indicates the less investment just because of low
capital. It requires the large amount of capital that is why; it has to borrow the amount on debt
(Baker, and Weigand, 2015).
Paraphrase This Document
Need a fresh take? Get an instant paraphrase of this document with our AI Paraphraser
Running Head: CORPORATE FINANCIAL MANAGEMENT
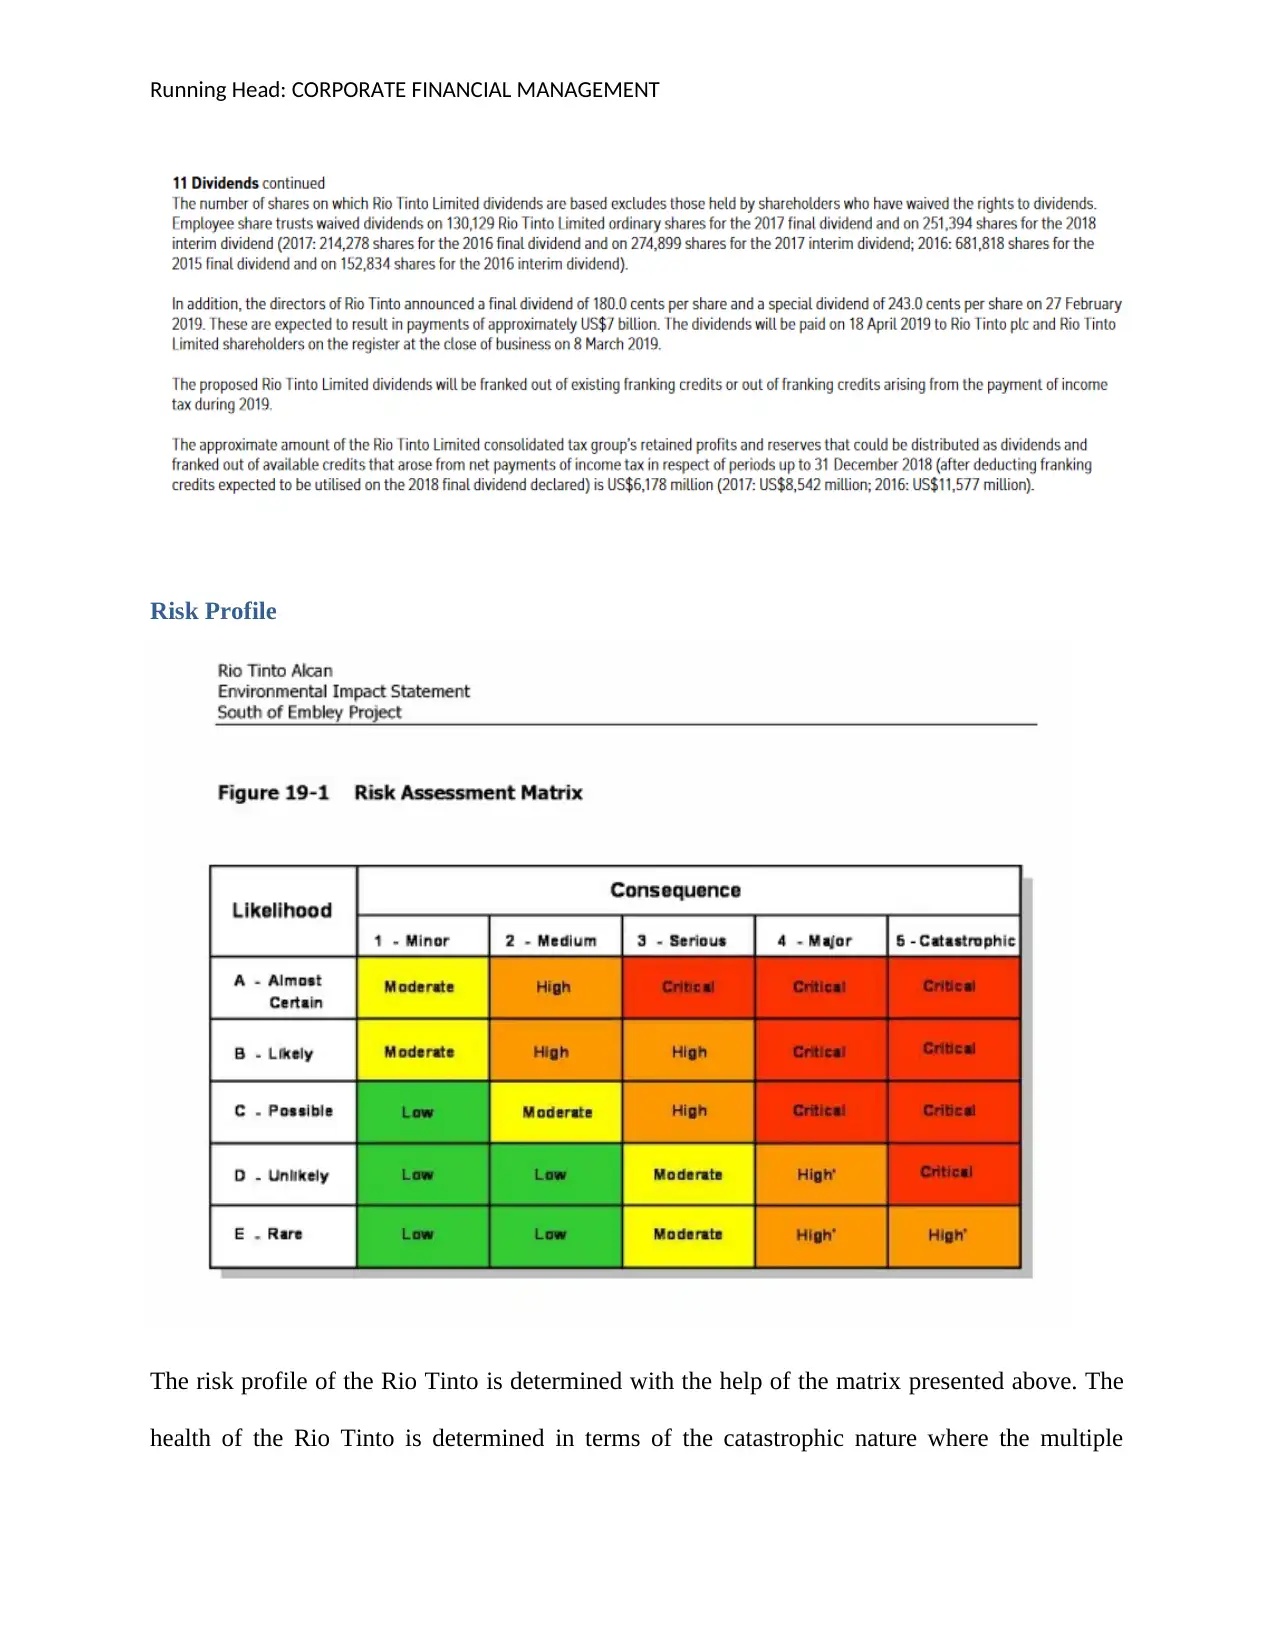
Risk Profile
The risk profile of the Rio Tinto is determined with the help of the matrix presented above. The
health of the Rio Tinto is determined in terms of the catastrophic nature where the multiple
Risk Profile
The risk profile of the Rio Tinto is determined with the help of the matrix presented above. The
health of the Rio Tinto is determined in terms of the catastrophic nature where the multiple
Running Head: CORPORATE FINANCIAL MANAGEMENT
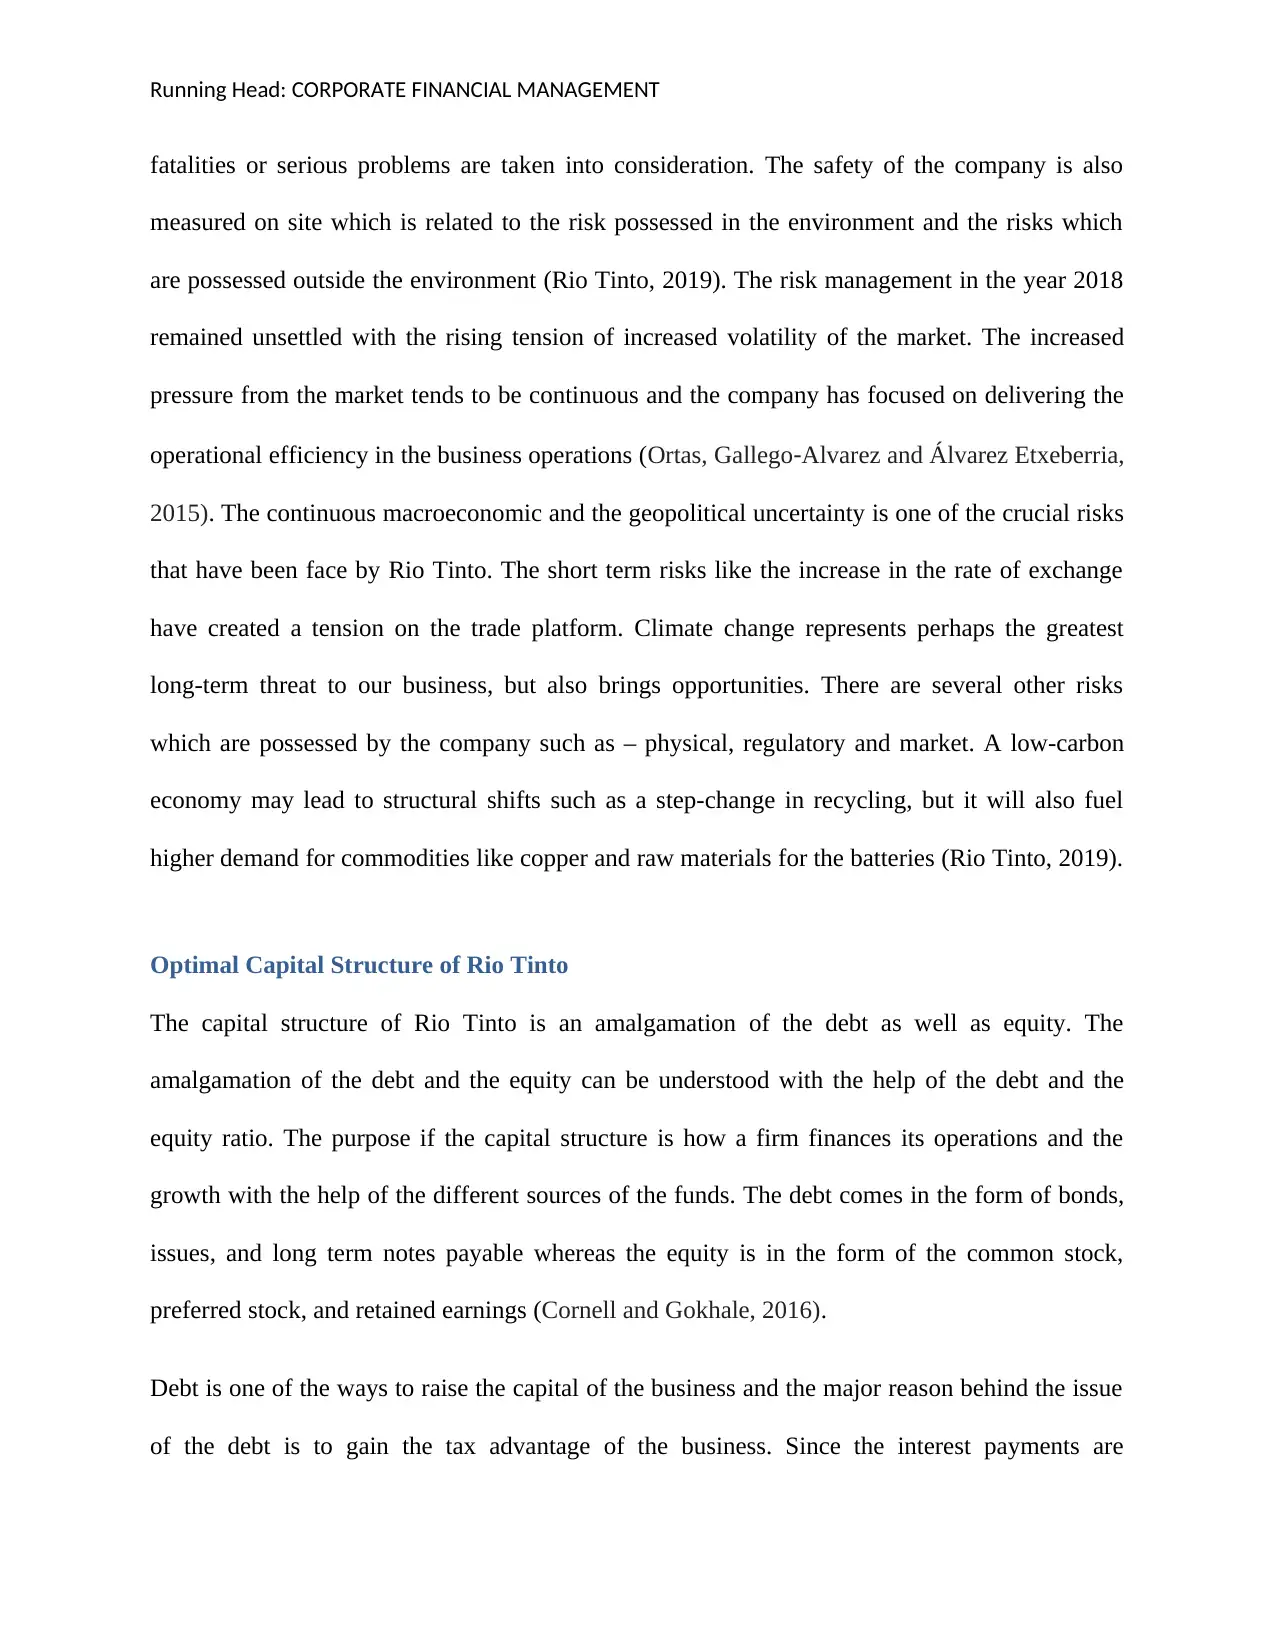
fatalities or serious problems are taken into consideration. The safety of the company is also
measured on site which is related to the risk possessed in the environment and the risks which
are possessed outside the environment (Rio Tinto, 2019). The risk management in the year 2018
remained unsettled with the rising tension of increased volatility of the market. The increased
pressure from the market tends to be continuous and the company has focused on delivering the
operational efficiency in the business operations (Ortas, Gallego‐Alvarez and Álvarez Etxeberria,
2015). The continuous macroeconomic and the geopolitical uncertainty is one of the crucial risks
that have been face by Rio Tinto. The short term risks like the increase in the rate of exchange
have created a tension on the trade platform. Climate change represents perhaps the greatest
long-term threat to our business, but also brings opportunities. There are several other risks
which are possessed by the company such as – physical, regulatory and market. A low-carbon
economy may lead to structural shifts such as a step-change in recycling, but it will also fuel
higher demand for commodities like copper and raw materials for the batteries (Rio Tinto, 2019).
Optimal Capital Structure of Rio Tinto
The capital structure of Rio Tinto is an amalgamation of the debt as well as equity. The
amalgamation of the debt and the equity can be understood with the help of the debt and the
equity ratio. The purpose if the capital structure is how a firm finances its operations and the
growth with the help of the different sources of the funds. The debt comes in the form of bonds,
issues, and long term notes payable whereas the equity is in the form of the common stock,
preferred stock, and retained earnings (Cornell and Gokhale, 2016).
Debt is one of the ways to raise the capital of the business and the major reason behind the issue
of the debt is to gain the tax advantage of the business. Since the interest payments are
⊘ This is a preview!⊘
Do you want full access?
Subscribe today to unlock all pages.
Trusted by 1+ million students worldwide
Running Head: CORPORATE FINANCIAL MANAGEMENT
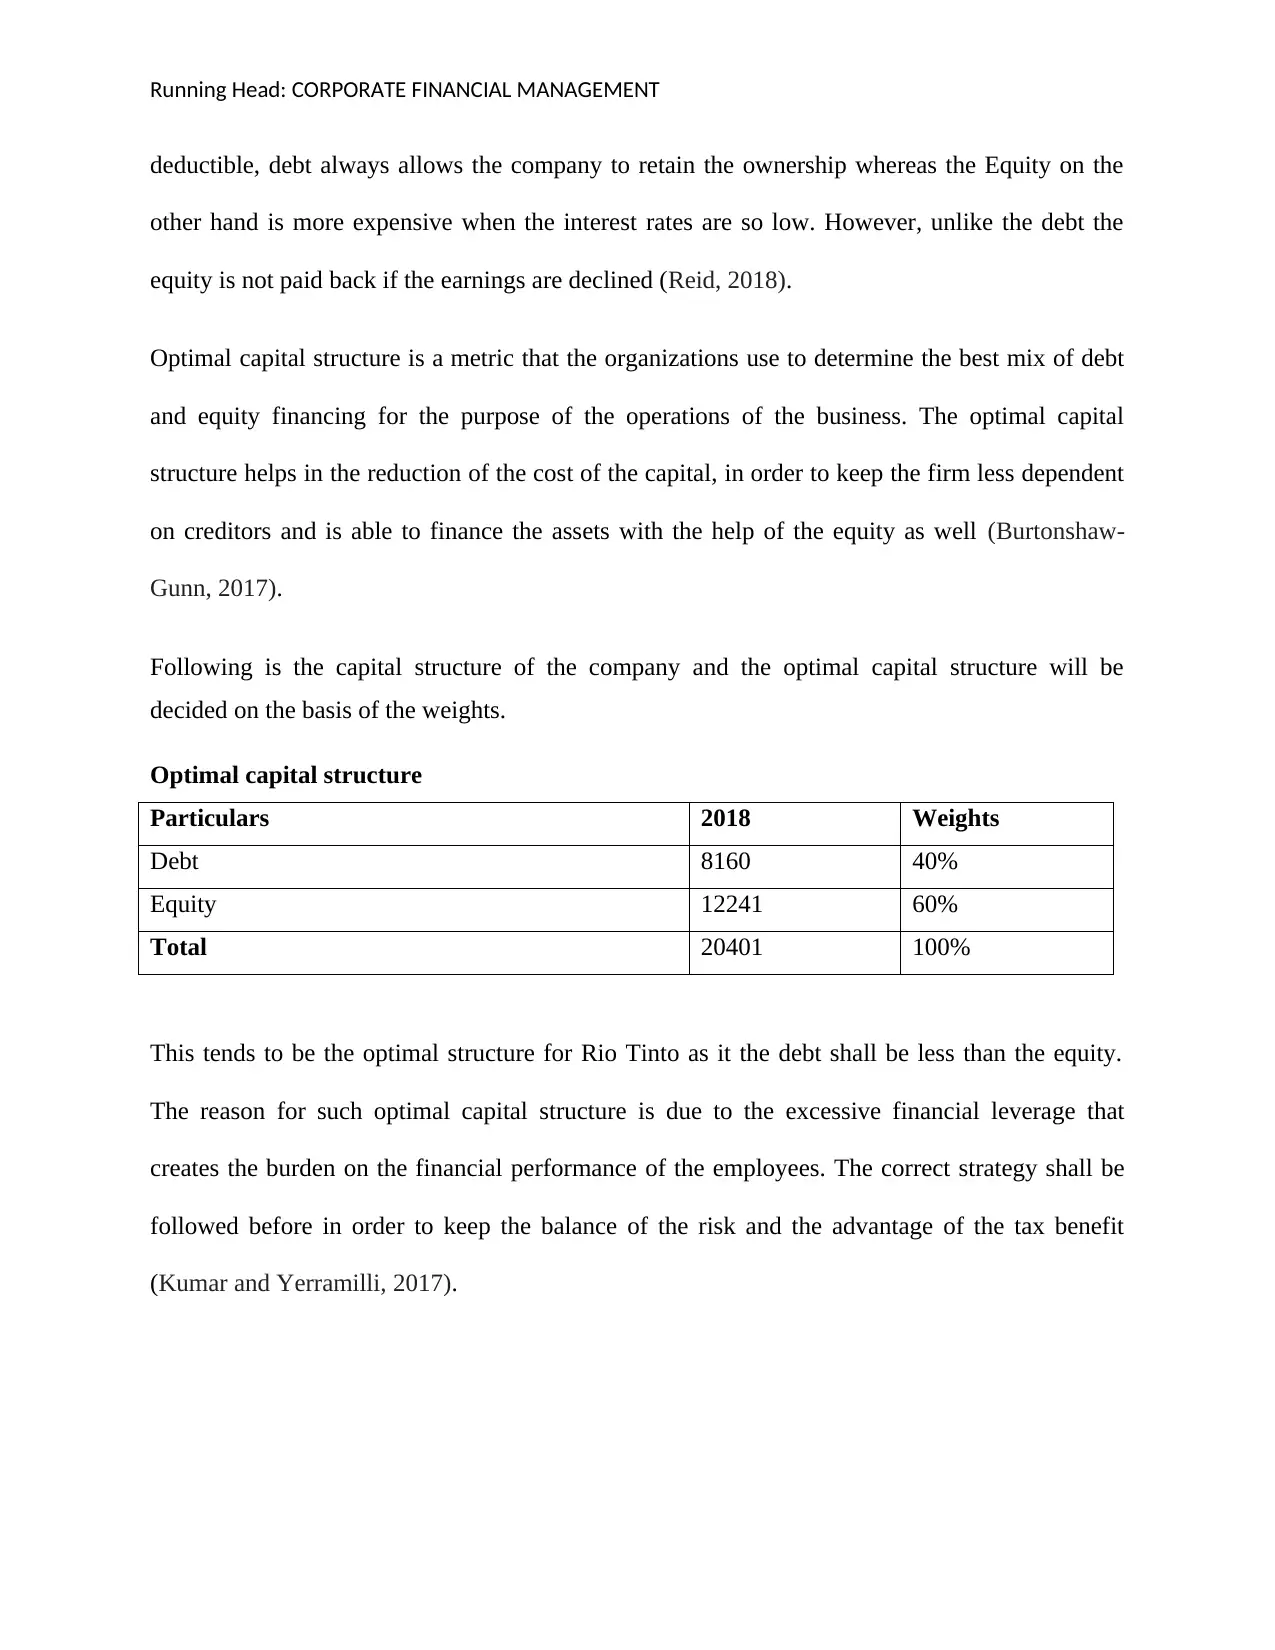
deductible, debt always allows the company to retain the ownership whereas the Equity on the
other hand is more expensive when the interest rates are so low. However, unlike the debt the
equity is not paid back if the earnings are declined (Reid, 2018).
Optimal capital structure is a metric that the organizations use to determine the best mix of debt
and equity financing for the purpose of the operations of the business. The optimal capital
structure helps in the reduction of the cost of the capital, in order to keep the firm less dependent
on creditors and is able to finance the assets with the help of the equity as well (Burtonshaw-
Gunn, 2017).
Following is the capital structure of the company and the optimal capital structure will be
decided on the basis of the weights.
Optimal capital structure
Particulars 2018 Weights
Debt 8160 40%
Equity 12241 60%
Total 20401 100%
This tends to be the optimal structure for Rio Tinto as it the debt shall be less than the equity.
The reason for such optimal capital structure is due to the excessive financial leverage that
creates the burden on the financial performance of the employees. The correct strategy shall be
followed before in order to keep the balance of the risk and the advantage of the tax benefit
(Kumar and Yerramilli, 2017).
Paraphrase This Document
Need a fresh take? Get an instant paraphrase of this document with our AI Paraphraser
Running Head: CORPORATE FINANCIAL MANAGEMENT
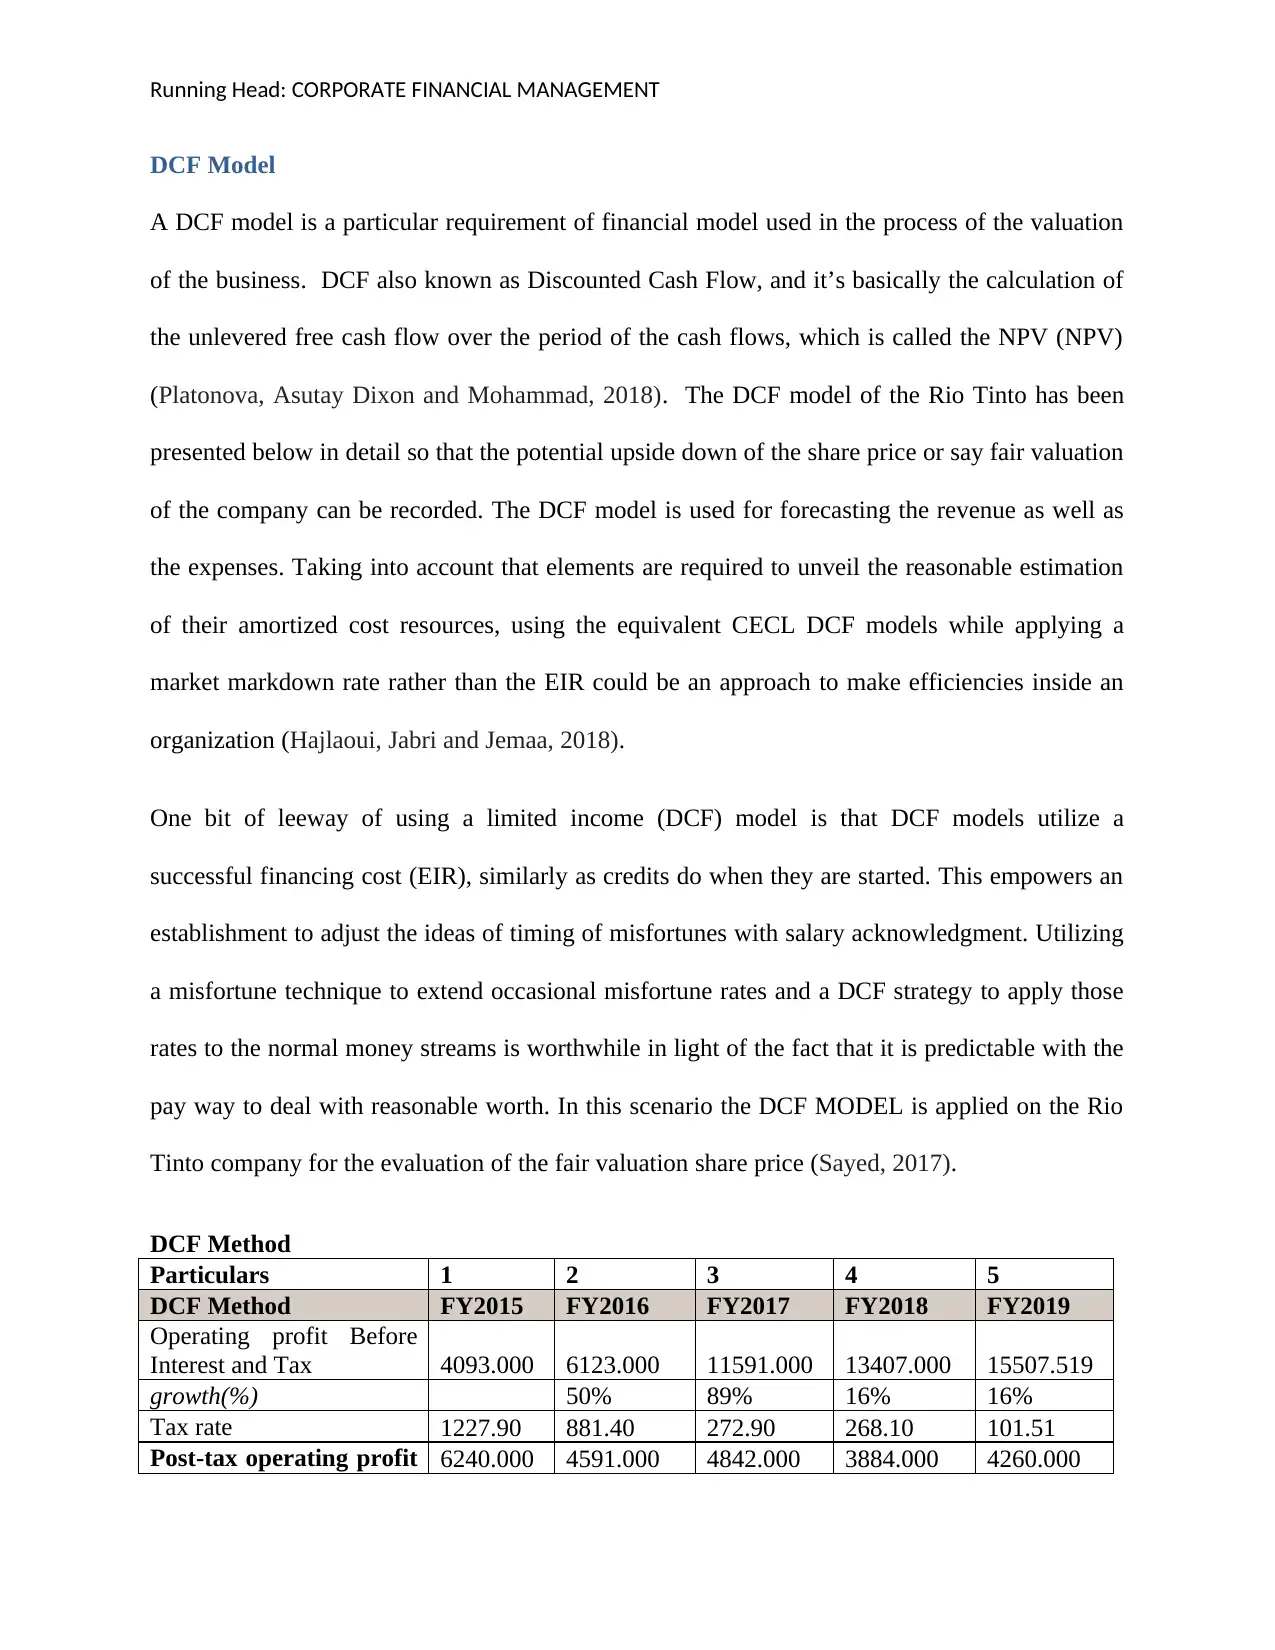
DCF Model
A DCF model is a particular requirement of financial model used in the process of the valuation
of the business. DCF also known as Discounted Cash Flow, and it’s basically the calculation of
the unlevered free cash flow over the period of the cash flows, which is called the NPV (NPV)
(Platonova, Asutay Dixon and Mohammad, 2018). The DCF model of the Rio Tinto has been
presented below in detail so that the potential upside down of the share price or say fair valuation
of the company can be recorded. The DCF model is used for forecasting the revenue as well as
the expenses. Taking into account that elements are required to unveil the reasonable estimation
of their amortized cost resources, using the equivalent CECL DCF models while applying a
market markdown rate rather than the EIR could be an approach to make efficiencies inside an
organization (Hajlaoui, Jabri and Jemaa, 2018).
One bit of leeway of using a limited income (DCF) model is that DCF models utilize a
successful financing cost (EIR), similarly as credits do when they are started. This empowers an
establishment to adjust the ideas of timing of misfortunes with salary acknowledgment. Utilizing
a misfortune technique to extend occasional misfortune rates and a DCF strategy to apply those
rates to the normal money streams is worthwhile in light of the fact that it is predictable with the
pay way to deal with reasonable worth. In this scenario the DCF MODEL is applied on the Rio
Tinto company for the evaluation of the fair valuation share price (Sayed, 2017).
DCF Method
Particulars 1 2 3 4 5
DCF Method FY2015 FY2016 FY2017 FY2018 FY2019
Operating profit Before
Interest and Tax 4093.000 6123.000 11591.000 13407.000 15507.519
growth(%) 50% 89% 16% 16%
Tax rate 1227.90 881.40 272.90 268.10 101.51
Post-tax operating profit 6240.000 4591.000 4842.000 3884.000 4260.000
Running Head: CORPORATE FINANCIAL MANAGEMENT
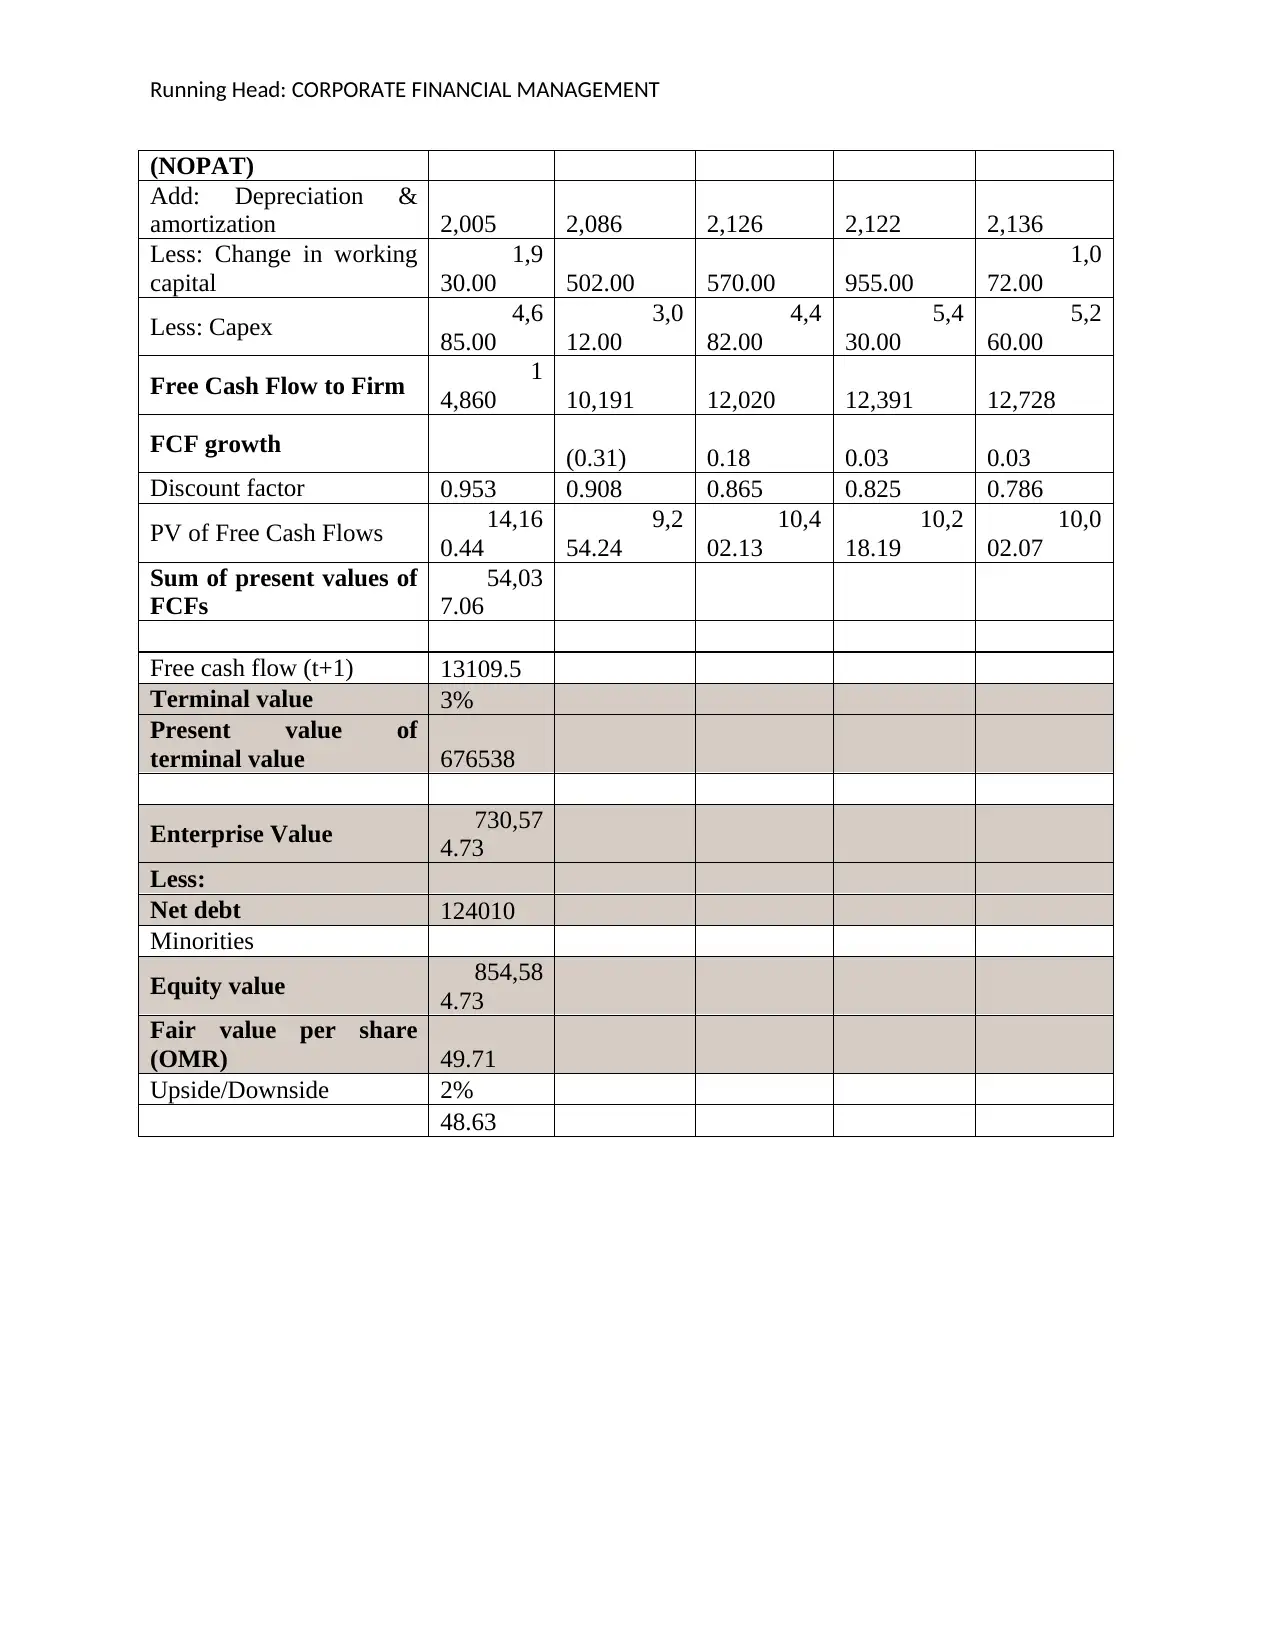
(NOPAT)
Add: Depreciation &
amortization 2,005 2,086 2,126 2,122 2,136
Less: Change in working
capital
1,9
30.00 502.00 570.00 955.00
1,0
72.00
Less: Capex 4,6
85.00
3,0
12.00
4,4
82.00
5,4
30.00
5,2
60.00
Free Cash Flow to Firm 1
4,860 10,191 12,020 12,391 12,728
FCF growth (0.31) 0.18 0.03 0.03
Discount factor 0.953 0.908 0.865 0.825 0.786
PV of Free Cash Flows 14,16
0.44
9,2
54.24
10,4
02.13
10,2
18.19
10,0
02.07
Sum of present values of
FCFs
54,03
7.06
Free cash flow (t+1) 13109.5
Terminal value 3%
Present value of
terminal value 676538
Enterprise Value 730,57
4.73
Less:
Net debt 124010
Minorities
Equity value 854,58
4.73
Fair value per share
(OMR) 49.71
Upside/Downside 2%
48.63
⊘ This is a preview!⊘
Do you want full access?
Subscribe today to unlock all pages.
Trusted by 1+ million students worldwide
1 out of 22
Related Documents


Your All-in-One AI-Powered Toolkit for Academic Success.
+13062052269
info@desklib.com
Available 24*7 on WhatsApp / Email
![[object Object]](/_next/static/media/star-bottom.7253800d.svg)
Unlock your academic potential
Copyright © 2020–2026 A2Z Services. All Rights Reserved. Developed and managed by ZUCOL.