BUS80017: SEM and OLS Regression Analysis of Corporate Governance
VerifiedAdded on 2023/06/10
|22
|4286
|175
Report
AI Summary
This report replicates and expands upon Mohammed Azim's 2012 study on corporate governance mechanisms and their impact on company performance, utilizing Structural Equation Modelling (SEM) and Ordinary Least Squares (OLS) Regression. The study aims to validate Azim's theories and determine the nature of corporate monitoring mechanisms, including shareholders, external auditors, and the executive board. Using data from 613 Australian companies in 2015, obtained from SIRCA and Morning Star DatAnalysis, the analysis explores the substitution and complementary effects among monitoring structures. The report includes descriptive statistics and correlation analysis, addressing assumptions made during the data analysis process, such as data normality and the absence of missing values, to ensure the originality of the data analysis. The findings provide insights into the relationships between corporate governance practices and firm performance within the Australian context.
1. Introduction
1.1 Background to study
Corporate governance entails advocacy for law compliance as well as ethical conduct
demonstration (Datta, 2018), which, is in order to ensure that the company is well
aligned to both the society’s ethical concerns and existing regulations for both
profitability and sustainability prospects. Over the recent years, business performance
has been associated with a number of factors apart from the number of consumers for
their products. Such factors include corporate governance. Beth (2003) in her article
on corporate governance and firm performance notes that “the belief that governance
best practices lead to superior firm performance is widespread” a notion which Beth
refutes to not always be true. A number of studies to examine whether governance
best practices are reflected in the performance of the company have been conducted,
including Azim (2012) study on “Corporate governance mechanisms
and their impact on company performance”
1.2 Purpose of study
The purpose of our study is to replicate the studies data analysis and output done by
Mohammed Azim on “Corporate governance mechanisms and their impact on
company performance: A structural equation model analysis” Azim (2012) using
Structural equation modelling and Ordinary Least Squares (OLS) Regression. Our
focus will be to prove the theories presented by Azim (2012). Additionally, the study
seeks to determine the nature of corporate monitoring mechanisms also addressed as
structures in this study. The mechanisms include:
i. Shareholders
ii. External auditors
iii. Executive board
Paraphrase This Document
Need a fresh take? Get an instant paraphrase of this document with our AI Paraphraser
1.3 Research questions
The research questions for our study are as those used in the original study by Azim.
i. Is there a substitution effect in the corporate monitoring structures? (Azim, 2012)
ii. Is there a complementary effect among the featured monitoring mechanisms?
(Azim, 2012)
1.4 Keywords
Structural equation modelling, Ordinary Least Squares regression, Corporate
governance, Stakeholders
2. Methodology
2.1 Data
The sample data used for this study was obtained from SIRCA and Morning Star
DatAnalysis for 613 Australia’s big companies for the financial year of 2015. It
contains details of shareholders’ activities as well as different monitoring bodies such
as auditors. The data has 9 variables with various levels for the 613 companies, hence
the total number of variables is 22.
2.2 Assumptions
During our study we made the following assumptions:
i. The data for the study is normally distributed
ii. In order to ensure originality of data analysis we assumed that were no missing
values in the data-set and therefore did not explore for missing data, impute or
reconstruct
iii. We also assumed that the sample data was representative enough for estimation
of the population distribution as well as sufficient for testing of hypotheses
iv. The dependent and mediating variables for the SEM are continuous
v. The residuals from a SEM analysis are univariate normally distributed
⊘ This is a preview!⊘
Do you want full access?
Subscribe today to unlock all pages.
Trusted by 1+ million students worldwide
3. Analysis Results
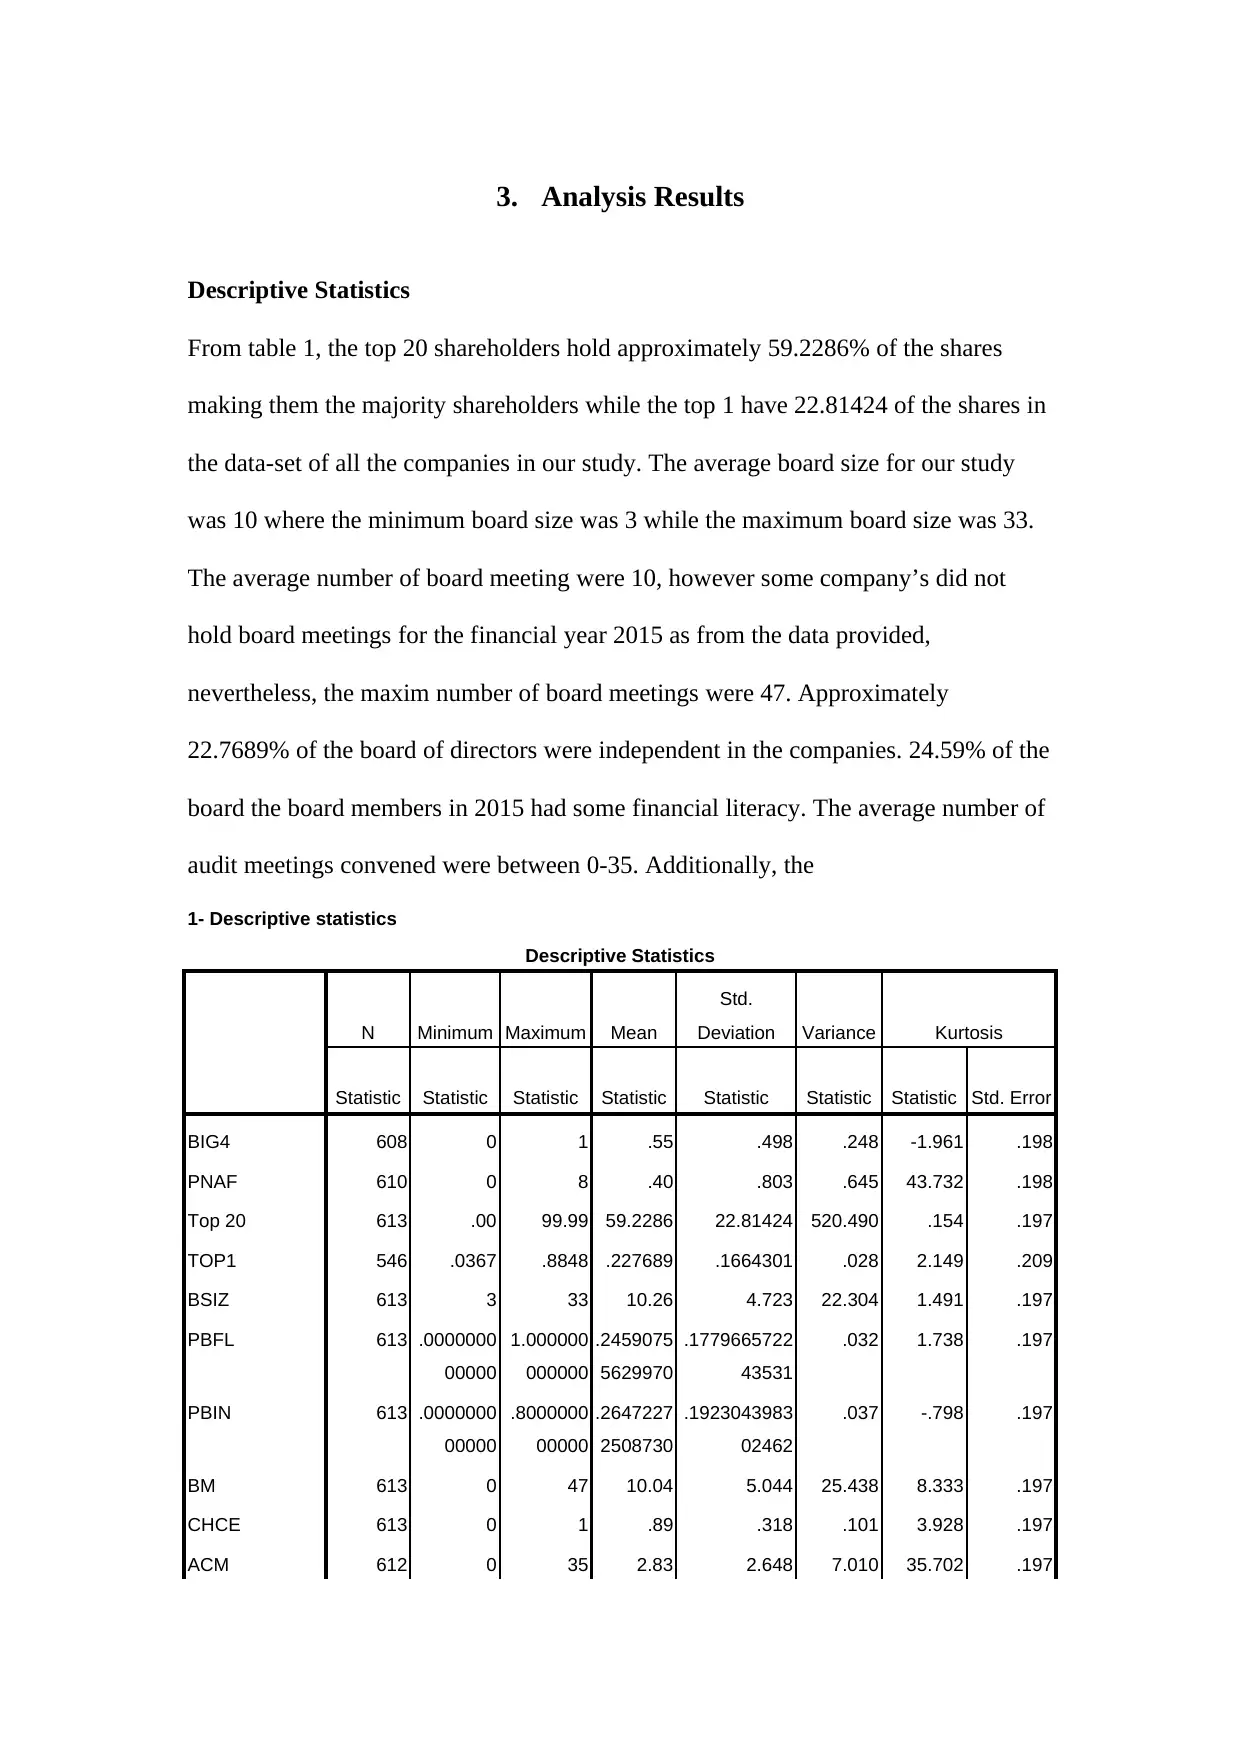
Descriptive Statistics
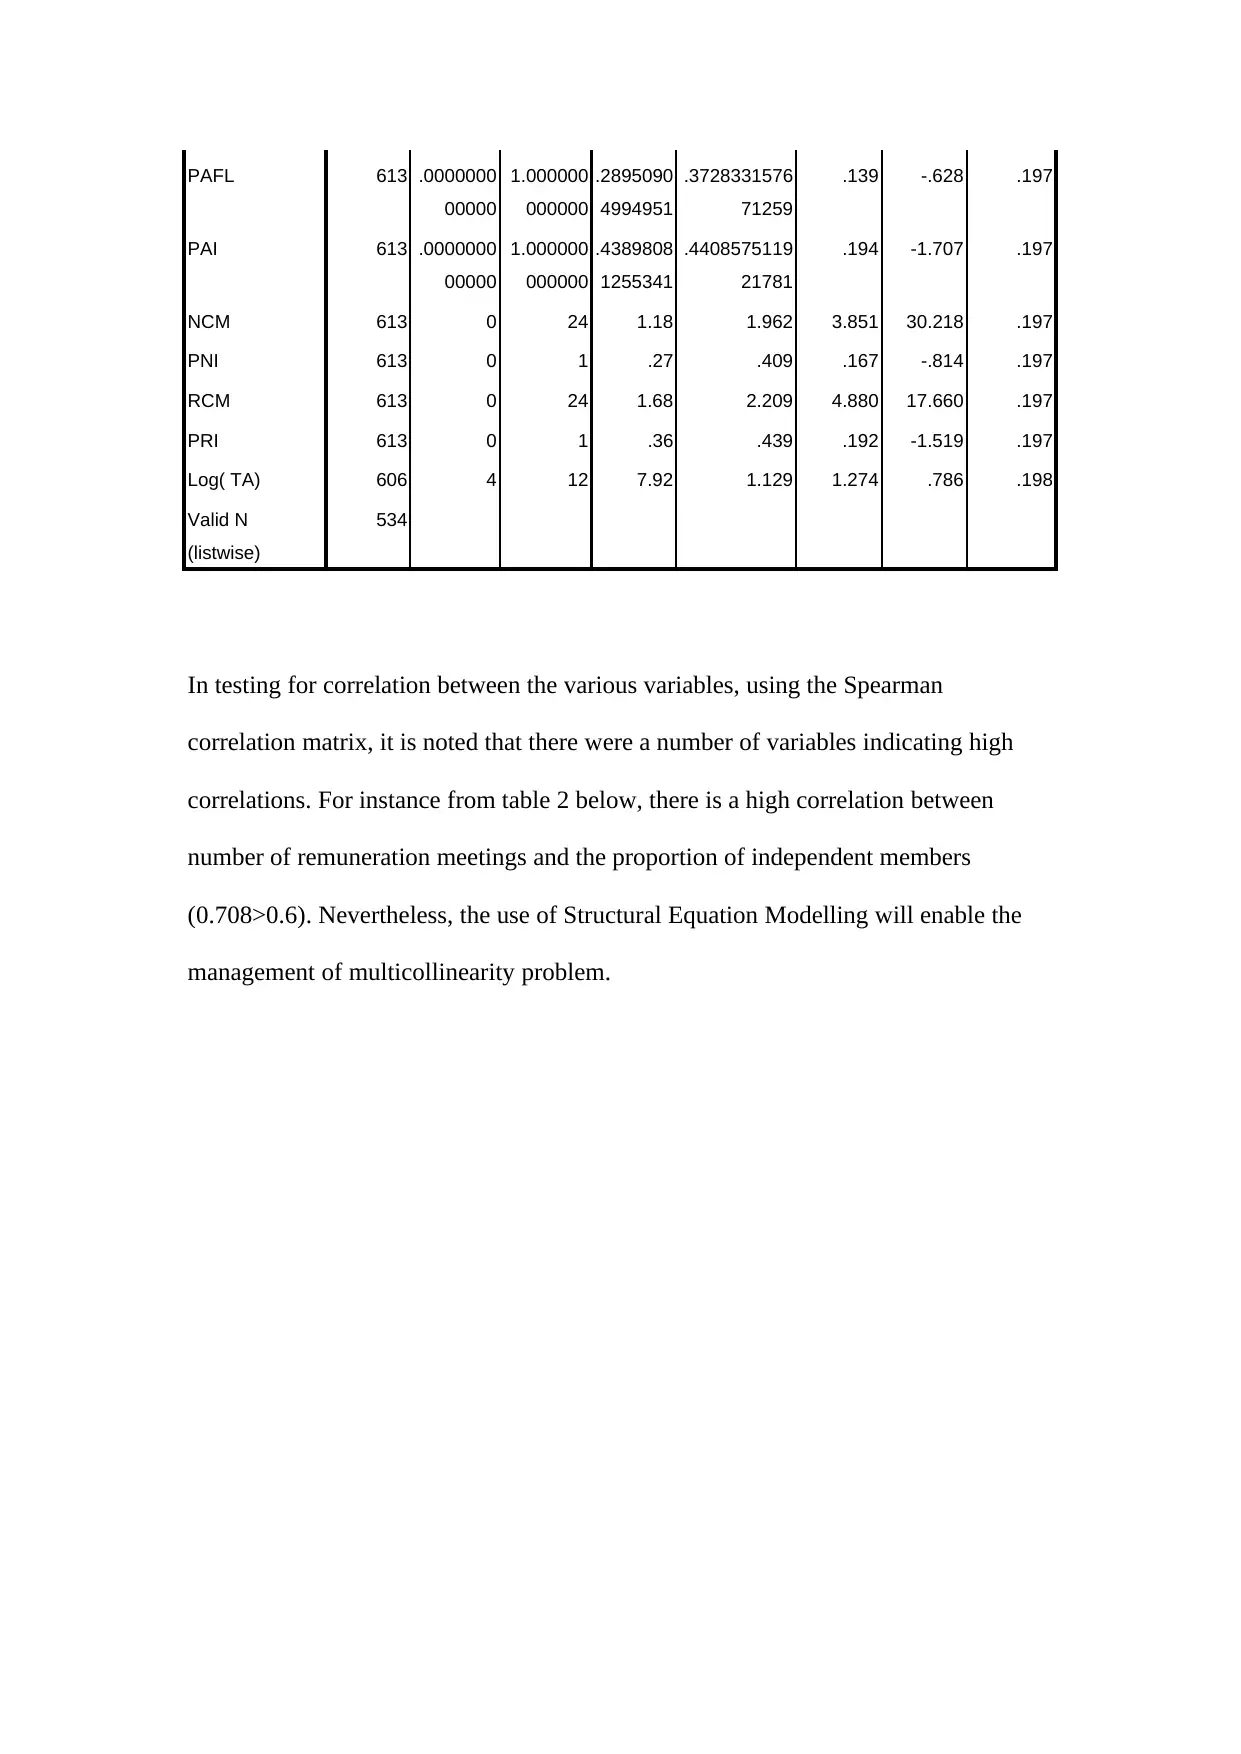
From table 1, the top 20 shareholders hold approximately 59.2286% of the shares
making them the majority shareholders while the top 1 have 22.81424 of the shares in
the data-set of all the companies in our study. The average board size for our study
was 10 where the minimum board size was 3 while the maximum board size was 33.
The average number of board meeting were 10, however some company’s did not
hold board meetings for the financial year 2015 as from the data provided,
nevertheless, the maxim number of board meetings were 47. Approximately
22.7689% of the board of directors were independent in the companies. 24.59% of the
board the board members in 2015 had some financial literacy. The average number of
audit meetings convened were between 0-35. Additionally, the
1- Descriptive statistics
Descriptive Statistics
N Minimum Maximum Mean
Std.
Deviation Variance Kurtosis
Statistic Statistic Statistic Statistic Statistic Statistic Statistic Std. Error
BIG4 608 0 1 .55 .498 .248 -1.961 .198
PNAF 610 0 8 .40 .803 .645 43.732 .198
Top 20 613 .00 99.99 59.2286 22.81424 520.490 .154 .197
TOP1 546 .0367 .8848 .227689 .1664301 .028 2.149 .209
BSIZ 613 3 33 10.26 4.723 22.304 1.491 .197
PBFL 613 .0000000
00000
1.000000
000000
.2459075
5629970
.1779665722
43531
.032 1.738 .197
PBIN 613 .0000000
00000
.8000000
00000
.2647227
2508730
.1923043983
02462
.037 -.798 .197
BM 613 0 47 10.04 5.044 25.438 8.333 .197
CHCE 613 0 1 .89 .318 .101 3.928 .197
ACM 612 0 35 2.83 2.648 7.010 35.702 .197
Descriptive Statistics
From table 1, the top 20 shareholders hold approximately 59.2286% of the shares
making them the majority shareholders while the top 1 have 22.81424 of the shares in
the data-set of all the companies in our study. The average board size for our study
was 10 where the minimum board size was 3 while the maximum board size was 33.
The average number of board meeting were 10, however some company’s did not
hold board meetings for the financial year 2015 as from the data provided,
nevertheless, the maxim number of board meetings were 47. Approximately
22.7689% of the board of directors were independent in the companies. 24.59% of the
board the board members in 2015 had some financial literacy. The average number of
audit meetings convened were between 0-35. Additionally, the
1- Descriptive statistics
Descriptive Statistics
N Minimum Maximum Mean
Std.
Deviation Variance Kurtosis
Statistic Statistic Statistic Statistic Statistic Statistic Statistic Std. Error
BIG4 608 0 1 .55 .498 .248 -1.961 .198
PNAF 610 0 8 .40 .803 .645 43.732 .198
Top 20 613 .00 99.99 59.2286 22.81424 520.490 .154 .197
TOP1 546 .0367 .8848 .227689 .1664301 .028 2.149 .209
BSIZ 613 3 33 10.26 4.723 22.304 1.491 .197
PBFL 613 .0000000
00000
1.000000
000000
.2459075
5629970
.1779665722
43531
.032 1.738 .197
PBIN 613 .0000000
00000
.8000000
00000
.2647227
2508730
.1923043983
02462
.037 -.798 .197
BM 613 0 47 10.04 5.044 25.438 8.333 .197
CHCE 613 0 1 .89 .318 .101 3.928 .197
ACM 612 0 35 2.83 2.648 7.010 35.702 .197
Paraphrase This Document
Need a fresh take? Get an instant paraphrase of this document with our AI Paraphraser
PAFL 613 .0000000
00000
1.000000
000000
.2895090
4994951
.3728331576
71259
.139 -.628 .197
PAI 613 .0000000
00000
1.000000
000000
.4389808
1255341
.4408575119
21781
.194 -1.707 .197
NCM 613 0 24 1.18 1.962 3.851 30.218 .197
PNI 613 0 1 .27 .409 .167 -.814 .197
RCM 613 0 24 1.68 2.209 4.880 17.660 .197
PRI 613 0 1 .36 .439 .192 -1.519 .197
Log( TA) 606 4 12 7.92 1.129 1.274 .786 .198
Valid N
(listwise)
534
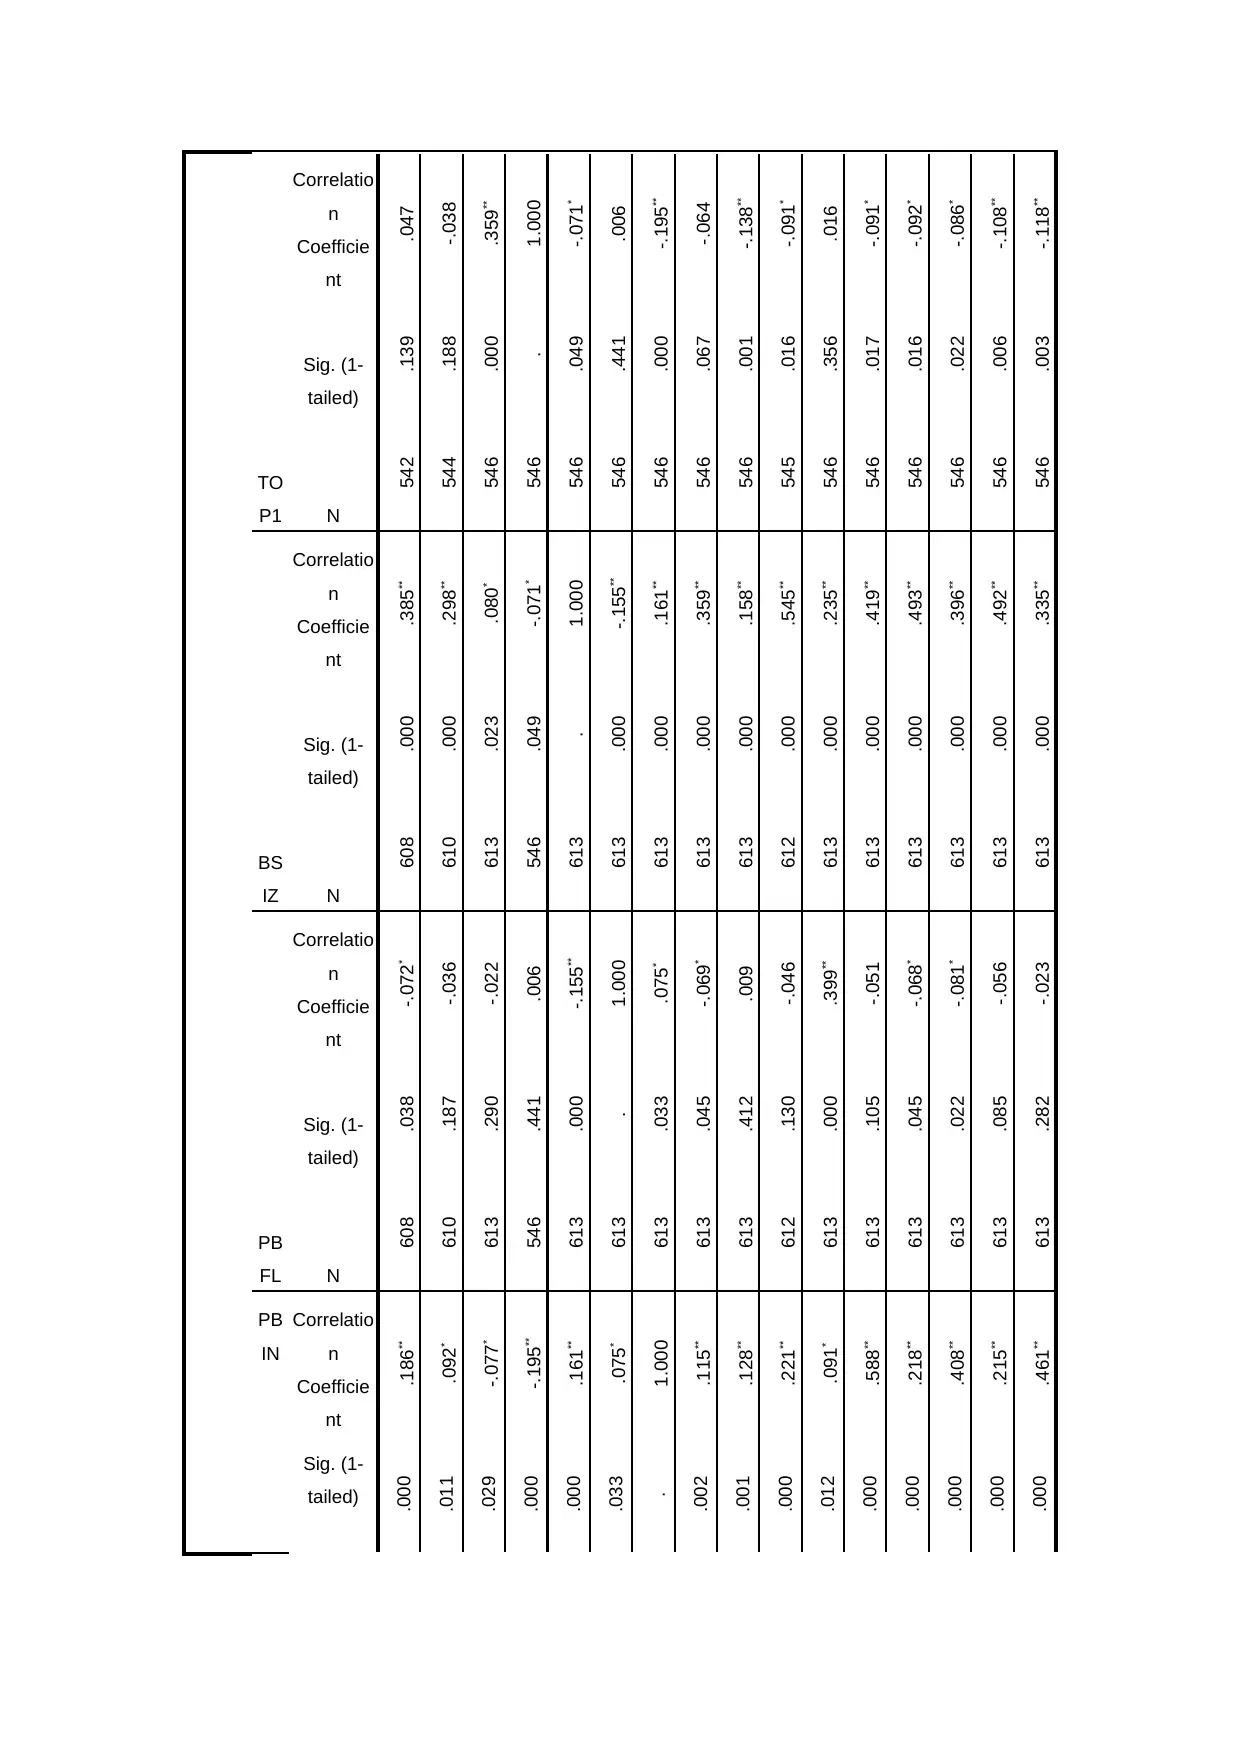
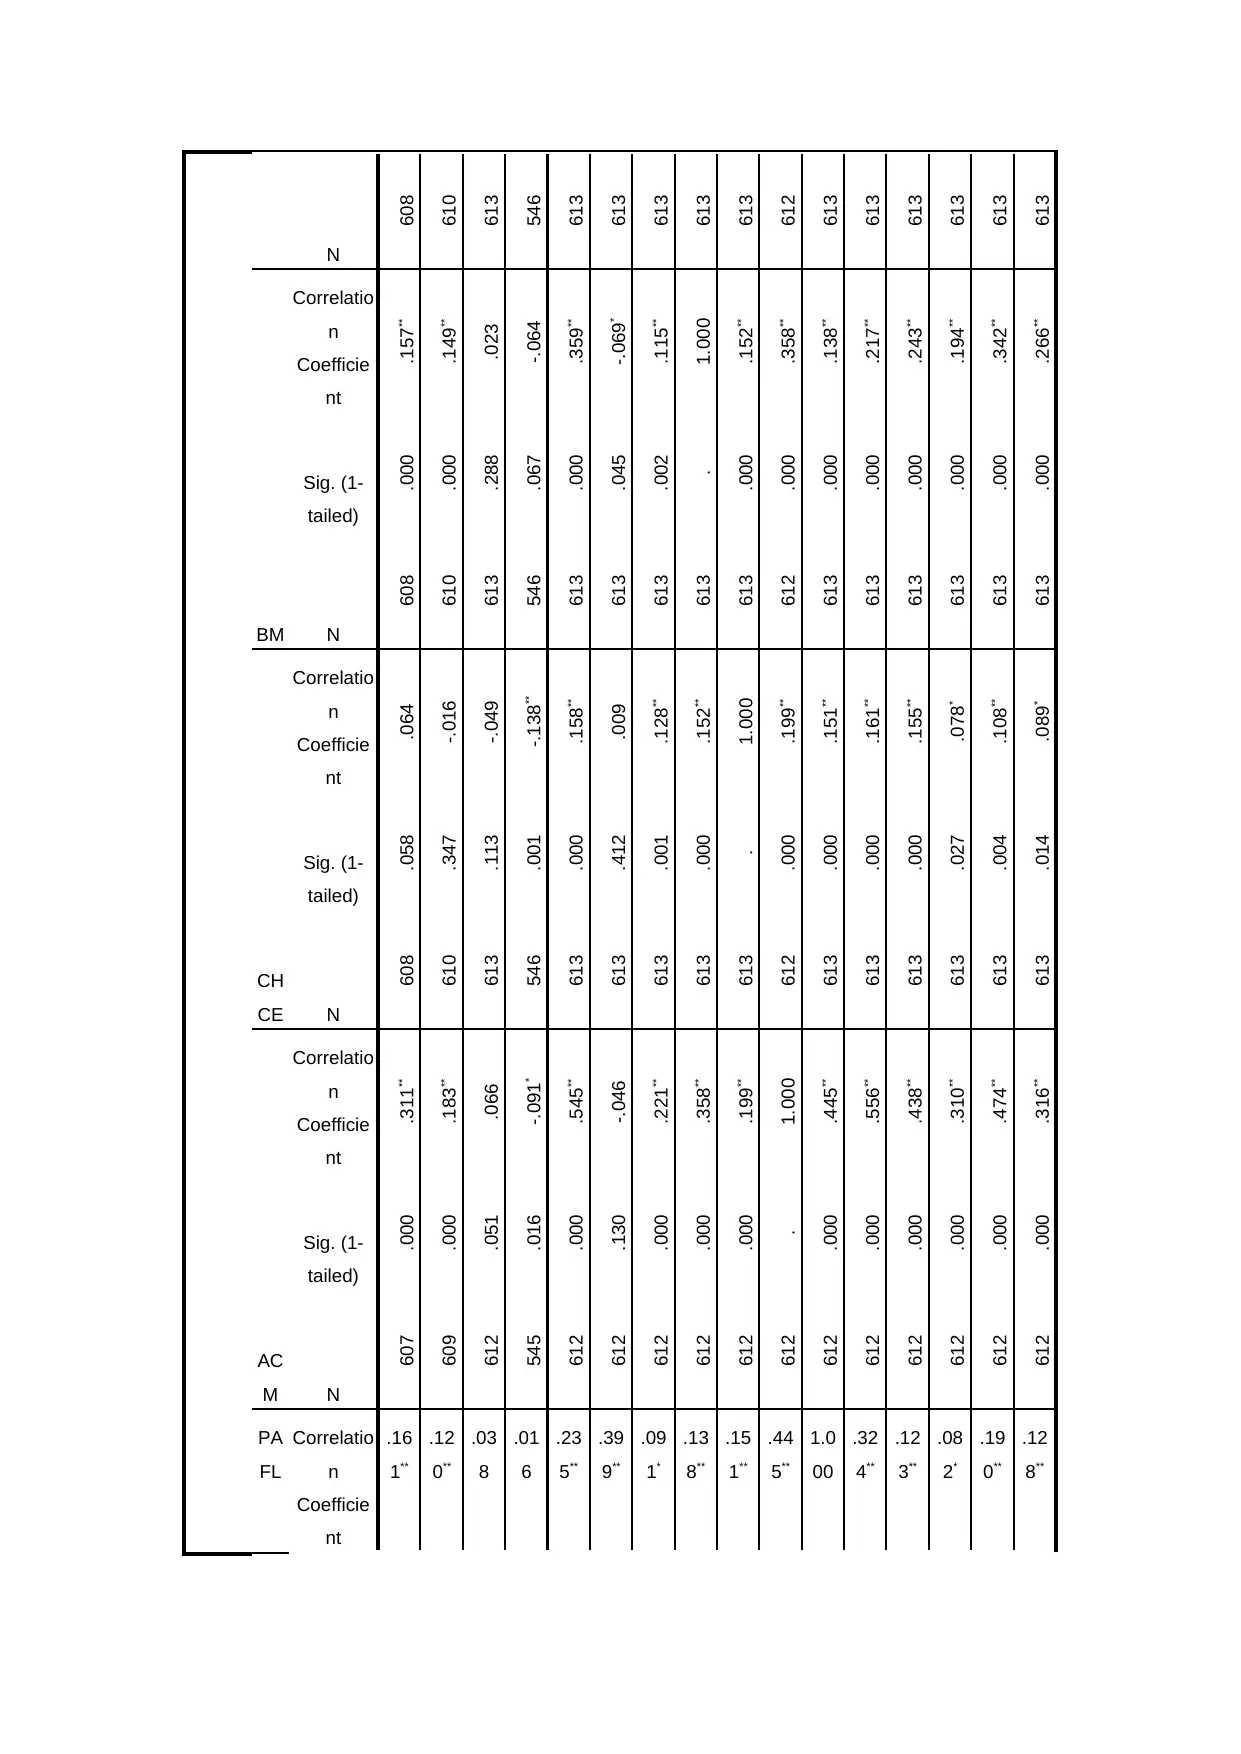
In testing for correlation between the various variables, using the Spearman
correlation matrix, it is noted that there were a number of variables indicating high
correlations. For instance from table 2 below, there is a high correlation between
number of remuneration meetings and the proportion of independent members
(0.708>0.6). Nevertheless, the use of Structural Equation Modelling will enable the
management of multicollinearity problem.
00000
1.000000
000000
.2895090
4994951
.3728331576
71259
.139 -.628 .197
PAI 613 .0000000
00000
1.000000
000000
.4389808
1255341
.4408575119
21781
.194 -1.707 .197
NCM 613 0 24 1.18 1.962 3.851 30.218 .197
PNI 613 0 1 .27 .409 .167 -.814 .197
RCM 613 0 24 1.68 2.209 4.880 17.660 .197
PRI 613 0 1 .36 .439 .192 -1.519 .197
Log( TA) 606 4 12 7.92 1.129 1.274 .786 .198
Valid N
(listwise)
534
In testing for correlation between the various variables, using the Spearman
correlation matrix, it is noted that there were a number of variables indicating high
correlations. For instance from table 2 below, there is a high correlation between
number of remuneration meetings and the proportion of independent members
(0.708>0.6). Nevertheless, the use of Structural Equation Modelling will enable the
management of multicollinearity problem.
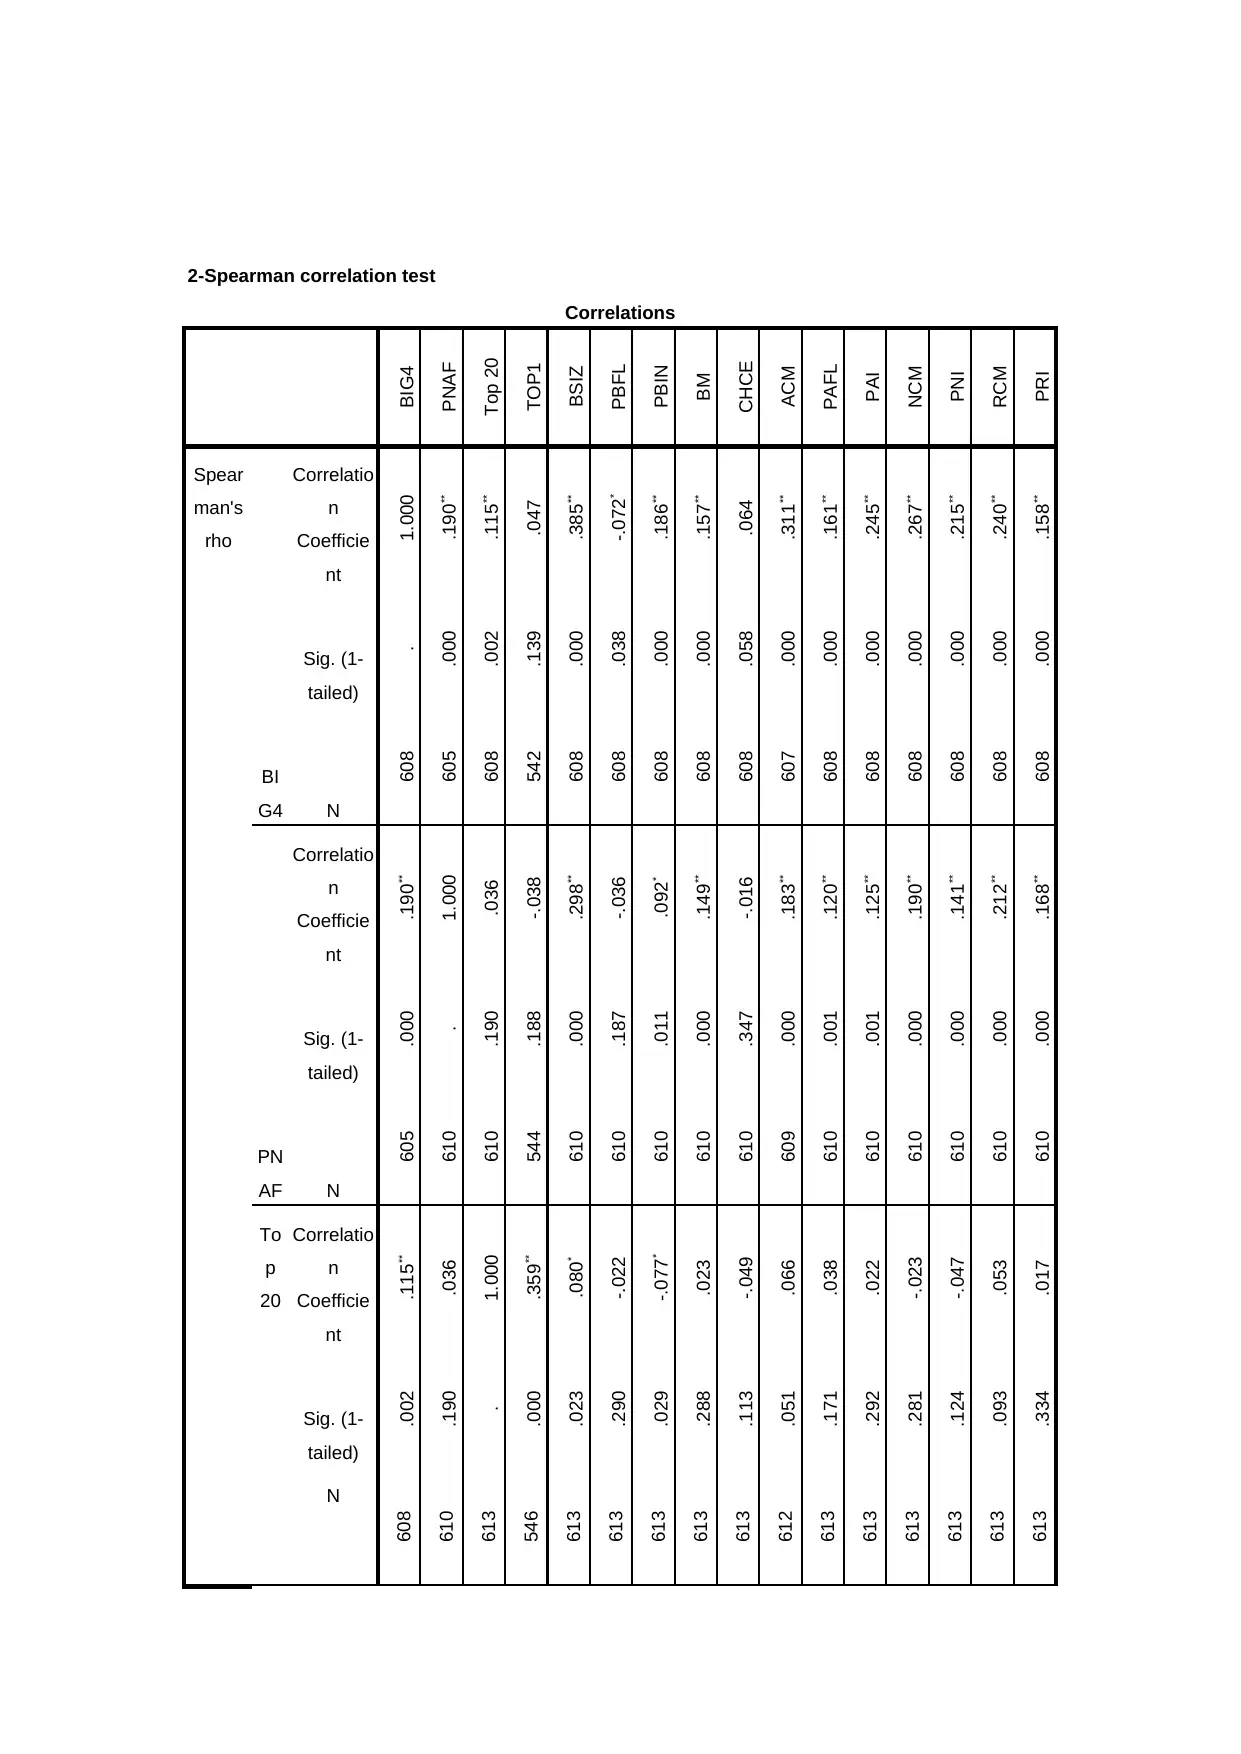
2-Spearman correlation test
Correlations
BIG4
PNAF
Top 20
TOP1
BSIZ
PBFL
PBIN
BM
CHCE
ACM
PAFL
PAI
NCM
PNI
RCM
PRI
Spear
man's
rho
BI
G4
Correlatio
n
Coefficie
nt
1.000
.190**
.115**
.047
.385**
-.072*
.186**
.157**
.064
.311**
.161**
.245**
.267**
.215**
.240**
.158**
Sig. (1-
tailed)
.
.000
.002
.139
.000
.038
.000
.000
.058
.000
.000
.000
.000
.000
.000
.000
N
608
605
608
542
608
608
608
608
608
607
608
608
608
608
608
608
PN
AF
Correlatio
n
Coefficie
nt
.190**
1.000
.036
-.038
.298**
-.036
.092*
.149**
-.016
.183**
.120**
.125**
.190**
.141**
.212**
.168**
Sig. (1-
tailed)
.000
.
.190
.188
.000
.187
.011
.000
.347
.000
.001
.001
.000
.000
.000
.000
N
605
610
610
544
610
610
610
610
610
609
610
610
610
610
610
610
To
p
20
Correlatio
n
Coefficie
nt
.115**
.036
1.000
.359**
.080*
-.022
-.077*
.023
-.049
.066
.038
.022
-.023
-.047
.053
.017
Sig. (1-
tailed)
.002
.190
.
.000
.023
.290
.029
.288
.113
.051
.171
.292
.281
.124
.093
.334
N
608
610
613
546
613
613
613
613
613
612
613
613
613
613
613
613
⊘ This is a preview!⊘
Do you want full access?
Subscribe today to unlock all pages.
Trusted by 1+ million students worldwide
TO
P1
Correlatio
n
Coefficie
nt
.047
-.038
.359**
1.000
-.071*
.006
-.195**
-.064
-.138**
-.091*
.016
-.091*
-.092*
-.086*
-.108**
-.118**
Sig. (1-
tailed)
.139
.188
.000
.
.049
.441
.000
.067
.001
.016
.356
.017
.016
.022
.006
.003
N
542
544
546
546
546
546
546
546
546
545
546
546
546
546
546
546
BS
IZ
Correlatio
n
Coefficie
nt
.385**
.298**
.080*
-.071*
1.000
-.155**
.161**
.359**
.158**
.545**
.235**
.419**
.493**
.396**
.492**
.335**
Sig. (1-
tailed)
.000
.000
.023
.049
.
.000
.000
.000
.000
.000
.000
.000
.000
.000
.000
.000
N
608
610
613
546
613
613
613
613
613
612
613
613
613
613
613
613
PB
FL
Correlatio
n
Coefficie
nt
-.072*
-.036
-.022
.006
-.155**
1.000
.075*
-.069*
.009
-.046
.399**
-.051
-.068*
-.081*
-.056
-.023
Sig. (1-
tailed)
.038
.187
.290
.441
.000
.
.033
.045
.412
.130
.000
.105
.045
.022
.085
.282
N
608
610
613
546
613
613
613
613
613
612
613
613
613
613
613
613
PB
IN
Correlatio
n
Coefficie
nt
.186**
.092*
-.077*
-.195**
.161**
.075*
1.000
.115**
.128**
.221**
.091*
.588**
.218**
.408**
.215**
.461**
Sig. (1-
tailed)
.000
.011
.029
.000
.000
.033
.
.002
.001
.000
.012
.000
.000
.000
.000
.000
Paraphrase This Document
Need a fresh take? Get an instant paraphrase of this document with our AI Paraphraser
N
608
610
613
546
613
613
613
613
613
612
613
613
613
613
613
613
BM
Correlatio
n
Coefficie
nt
.157**
.149**
.023
-.064
.359**
-.069*
.115**
1.000
.152**
.358**
.138**
.217**
.243**
.194**
.342**
.266**
Sig. (1-
tailed)
.000
.000
.288
.067
.000
.045
.002
.
.000
.000
.000
.000
.000
.000
.000
.000
N
608
610
613
546
613
613
613
613
613
612
613
613
613
613
613
613
CH
CE
Correlatio
n
Coefficie
nt
.064
-.016
-.049
-.138**
.158**
.009
.128**
.152**
1.000
.199**
.151**
.161**
.155**
.078*
.108**
.089*
Sig. (1-
tailed)
.058
.347
.113
.001
.000
.412
.001
.000
.
.000
.000
.000
.000
.027
.004
.014
N
608
610
613
546
613
613
613
613
613
612
613
613
613
613
613
613
AC
M
Correlatio
n
Coefficie
nt
.311**
.183**
.066
-.091*
.545**
-.046
.221**
.358**
.199**
1.000
.445**
.556**
.438**
.310**
.474**
.316**
Sig. (1-
tailed)
.000
.000
.051
.016
.000
.130
.000
.000
.000
.
.000
.000
.000
.000
.000
.000
N
607
609
612
545
612
612
612
612
612
612
612
612
612
612
612
612
PA
FL
Correlatio
n
Coefficie
nt
.16
1**
.12
0**
.03
8
.01
6
.23
5**
.39
9**
.09
1*
.13
8**
.15
1**
.44
5**
1.0
00
.32
4**
.12
3**
.08
2*
.19
0**
.12
8**
608
610
613
546
613
613
613
613
613
612
613
613
613
613
613
613
BM
Correlatio
n
Coefficie
nt
.157**
.149**
.023
-.064
.359**
-.069*
.115**
1.000
.152**
.358**
.138**
.217**
.243**
.194**
.342**
.266**
Sig. (1-
tailed)
.000
.000
.288
.067
.000
.045
.002
.
.000
.000
.000
.000
.000
.000
.000
.000
N
608
610
613
546
613
613
613
613
613
612
613
613
613
613
613
613
CH
CE
Correlatio
n
Coefficie
nt
.064
-.016
-.049
-.138**
.158**
.009
.128**
.152**
1.000
.199**
.151**
.161**
.155**
.078*
.108**
.089*
Sig. (1-
tailed)
.058
.347
.113
.001
.000
.412
.001
.000
.
.000
.000
.000
.000
.027
.004
.014
N
608
610
613
546
613
613
613
613
613
612
613
613
613
613
613
613
AC
M
Correlatio
n
Coefficie
nt
.311**
.183**
.066
-.091*
.545**
-.046
.221**
.358**
.199**
1.000
.445**
.556**
.438**
.310**
.474**
.316**
Sig. (1-
tailed)
.000
.000
.051
.016
.000
.130
.000
.000
.000
.
.000
.000
.000
.000
.000
.000
N
607
609
612
545
612
612
612
612
612
612
612
612
612
612
612
612
PA
FL
Correlatio
n
Coefficie
nt
.16
1**
.12
0**
.03
8
.01
6
.23
5**
.39
9**
.09
1*
.13
8**
.15
1**
.44
5**
1.0
00
.32
4**
.12
3**
.08
2*
.19
0**
.12
8**

Sig. (1-
tailed)
.00
0
.00
1
.17
1
.35
6
.00
0
.00
0
.01
2
.00
0
.00
0
.00
0 .
.00
0
.00
1
.02
1
.00
0
.00
1
N 608 610 613 546 613 613 613 613 613 612 613 613 613 613 613 613
PA
I
Correlatio
n
Coefficie
nt
.24
5**
.12
5**
.02
2
-.09
1*
.41
9**
-.05
1
.58
8**
.21
7**
.16
1**
.55
6**
.32
4**
1.0
00
.28
1**
.36
4**
.30
7**
.43
4**
Sig. (1-
tailed)
.00
0
.00
1
.29
2
.01
7
.00
0
.10
5
.00
0
.00
0
.00
0
.00
0
.00
0 .
.00
0
.00
0
.00
0
.00
0
N 608 610 613 546 613 613 613 613 613 612 613 613 613 613 613 613
NC
M
Correlatio
n
Coefficie
nt
.26
7**
.19
0**
-.02
3
-.09
2*
.49
3**
-.06
8*
.21
8**
.24
3**
.15
5**
.43
8**
.12
3**
.28
1**
1.0
00
.70
8**
.57
1**
.37
4**
Sig. (1-
tailed)
.00
0
.00
0
.28
1
.01
6
.00
0
.04
5
.00
0
.00
0
.00
0
.00
0
.00
1
.00
0 .
.00
0
.00
0
.00
0
N 608 610 613 546 613 613 613 613 613 612 613 613 613 613 613 613
PN
I
Correlatio
n
Coefficie
nt
.21
5**
.14
1**
-.04
7
-.08
6*
.39
6**
-.08
1*
.40
8**
.19
4**
.07
8*
.31
0**
.08
2*
.36
4**
.70
8**
1.0
00
.38
9**
.53
6**
Sig. (1-
tailed)
.00
0
.00
0
.12
4
.02
2
.00
0
.02
2
.00
0
.00
0
.02
7
.00
0
.02
1
.00
0
.00
0 .
.00
0
.00
0
N 608 610 613 546 613 613 613 613 613 612 613 613 613 613 613 613
RC
M
Correlatio
n
Coefficie
nt
.24
0**
.21
2**
.05
3
-.10
8**
.49
2**
-.05
6
.21
5**
.342**
.10
8**
.47
4**
.19
0**
.30
7**
.57
1**
.38
9**
1.0
00
.66
4**
Sig. (1-
tailed)
.00
0
.00
0
.09
3
.00
6
.00
0
.08
5
.00
0
.00
0
.00
4
.00
0
.00
0
.00
0
.00
0
.00
0 .
.00
0
N 608 610 613 546 613 613 613 613 613 612 613 613 613 613 613 613
PR
I
Correlatio
n
Coefficie
nt
.15
8**
.16
8**
.01
7
-.11
8**
.33
5**
-.02
3
.46
1**
.26
6**
.08
9*
.31
6**
.12
8**
.43
4**
.37
4**
.53
6**
.66
4**
1.0
00
Sig. (1-
tailed)
.00
0
.00
0
.33
4
.00
3
.00
0
.28
2
.00
0
.00
0
.01
4
.00
0
.00
1
.00
0
.00
0
.00
0
.00
0 .
N 608 610 613 546 613 613 613 613 613 612 613 613 613 613 613 613
tailed)
.00
0
.00
1
.17
1
.35
6
.00
0
.00
0
.01
2
.00
0
.00
0
.00
0 .
.00
0
.00
1
.02
1
.00
0
.00
1
N 608 610 613 546 613 613 613 613 613 612 613 613 613 613 613 613
PA
I
Correlatio
n
Coefficie
nt
.24
5**
.12
5**
.02
2
-.09
1*
.41
9**
-.05
1
.58
8**
.21
7**
.16
1**
.55
6**
.32
4**
1.0
00
.28
1**
.36
4**
.30
7**
.43
4**
Sig. (1-
tailed)
.00
0
.00
1
.29
2
.01
7
.00
0
.10
5
.00
0
.00
0
.00
0
.00
0
.00
0 .
.00
0
.00
0
.00
0
.00
0
N 608 610 613 546 613 613 613 613 613 612 613 613 613 613 613 613
NC
M
Correlatio
n
Coefficie
nt
.26
7**
.19
0**
-.02
3
-.09
2*
.49
3**
-.06
8*
.21
8**
.24
3**
.15
5**
.43
8**
.12
3**
.28
1**
1.0
00
.70
8**
.57
1**
.37
4**
Sig. (1-
tailed)
.00
0
.00
0
.28
1
.01
6
.00
0
.04
5
.00
0
.00
0
.00
0
.00
0
.00
1
.00
0 .
.00
0
.00
0
.00
0
N 608 610 613 546 613 613 613 613 613 612 613 613 613 613 613 613
PN
I
Correlatio
n
Coefficie
nt
.21
5**
.14
1**
-.04
7
-.08
6*
.39
6**
-.08
1*
.40
8**
.19
4**
.07
8*
.31
0**
.08
2*
.36
4**
.70
8**
1.0
00
.38
9**
.53
6**
Sig. (1-
tailed)
.00
0
.00
0
.12
4
.02
2
.00
0
.02
2
.00
0
.00
0
.02
7
.00
0
.02
1
.00
0
.00
0 .
.00
0
.00
0
N 608 610 613 546 613 613 613 613 613 612 613 613 613 613 613 613
RC
M
Correlatio
n
Coefficie
nt
.24
0**
.21
2**
.05
3
-.10
8**
.49
2**
-.05
6
.21
5**
.342**
.10
8**
.47
4**
.19
0**
.30
7**
.57
1**
.38
9**
1.0
00
.66
4**
Sig. (1-
tailed)
.00
0
.00
0
.09
3
.00
6
.00
0
.08
5
.00
0
.00
0
.00
4
.00
0
.00
0
.00
0
.00
0
.00
0 .
.00
0
N 608 610 613 546 613 613 613 613 613 612 613 613 613 613 613 613
PR
I
Correlatio
n
Coefficie
nt
.15
8**
.16
8**
.01
7
-.11
8**
.33
5**
-.02
3
.46
1**
.26
6**
.08
9*
.31
6**
.12
8**
.43
4**
.37
4**
.53
6**
.66
4**
1.0
00
Sig. (1-
tailed)
.00
0
.00
0
.33
4
.00
3
.00
0
.28
2
.00
0
.00
0
.01
4
.00
0
.00
1
.00
0
.00
0
.00
0
.00
0 .
N 608 610 613 546 613 613 613 613 613 612 613 613 613 613 613 613
⊘ This is a preview!⊘
Do you want full access?
Subscribe today to unlock all pages.
Trusted by 1+ million students worldwide

**. Correlation is significant at the 0.01 level (1-tailed).
*. Correlation is significant at the 0.05 level (1-tailed).
*. Correlation is significant at the 0.05 level (1-tailed).
Paraphrase This Document
Need a fresh take? Get an instant paraphrase of this document with our AI Paraphraser
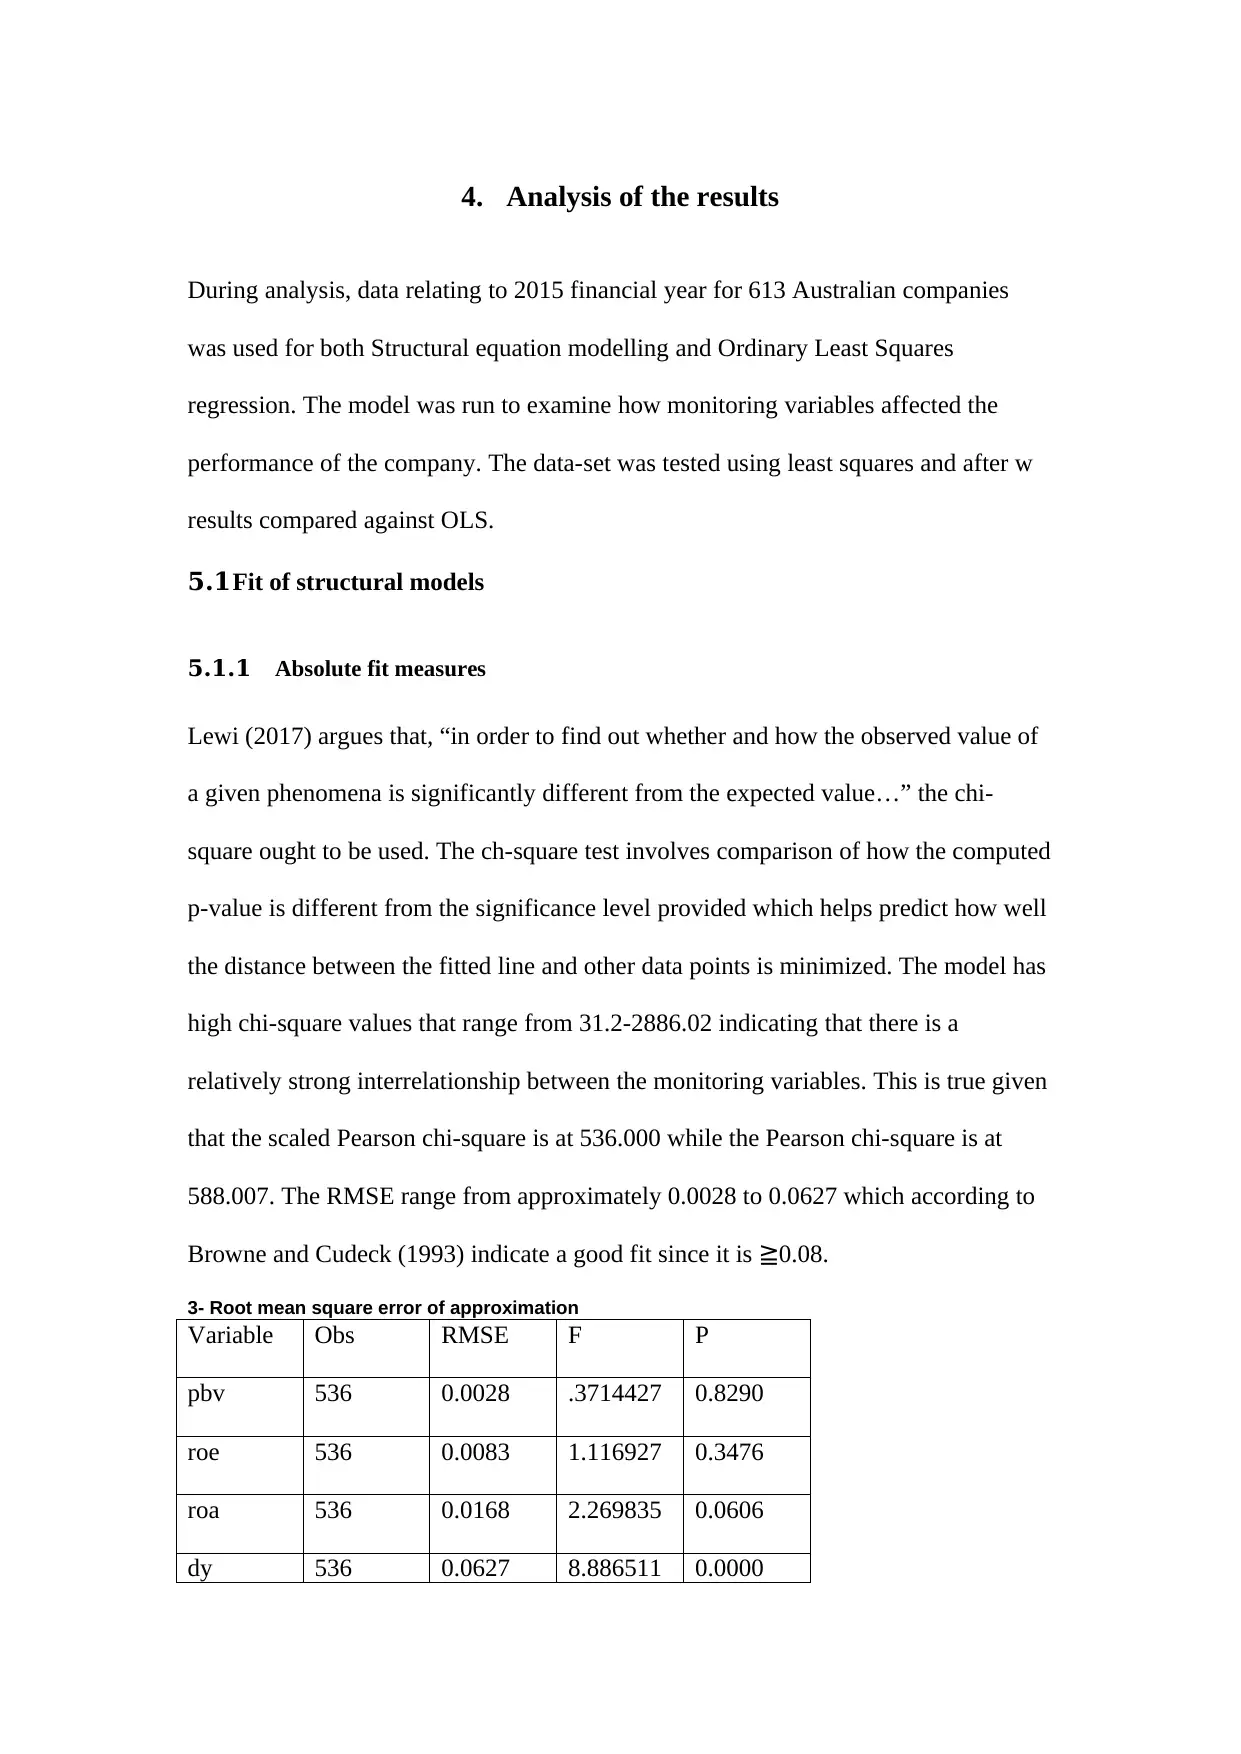
4. Analysis of the results
During analysis, data relating to 2015 financial year for 613 Australian companies
was used for both Structural equation modelling and Ordinary Least Squares
regression. The model was run to examine how monitoring variables affected the
performance of the company. The data-set was tested using least squares and after w
results compared against OLS.
5.1Fit of structural models
5.1.1 Absolute fit measures
Lewi (2017) argues that, “in order to find out whether and how the observed value of
a given phenomena is significantly different from the expected value…” the chi-
square ought to be used. The ch-square test involves comparison of how the computed
p-value is different from the significance level provided which helps predict how well
the distance between the fitted line and other data points is minimized. The model has
high chi-square values that range from 31.2-2886.02 indicating that there is a
relatively strong interrelationship between the monitoring variables. This is true given
that the scaled Pearson chi-square is at 536.000 while the Pearson chi-square is at
588.007. The RMSE range from approximately 0.0028 to 0.0627 which according to
Browne and Cudeck (1993) indicate a good fit since it is ≧0.08.
3- Root mean square error of approximation
Variable Obs RMSE F P
pbv 536 0.0028 .3714427 0.8290
roe 536 0.0083 1.116927 0.3476
roa 536 0.0168 2.269835 0.0606
dy 536 0.0627 8.886511 0.0000
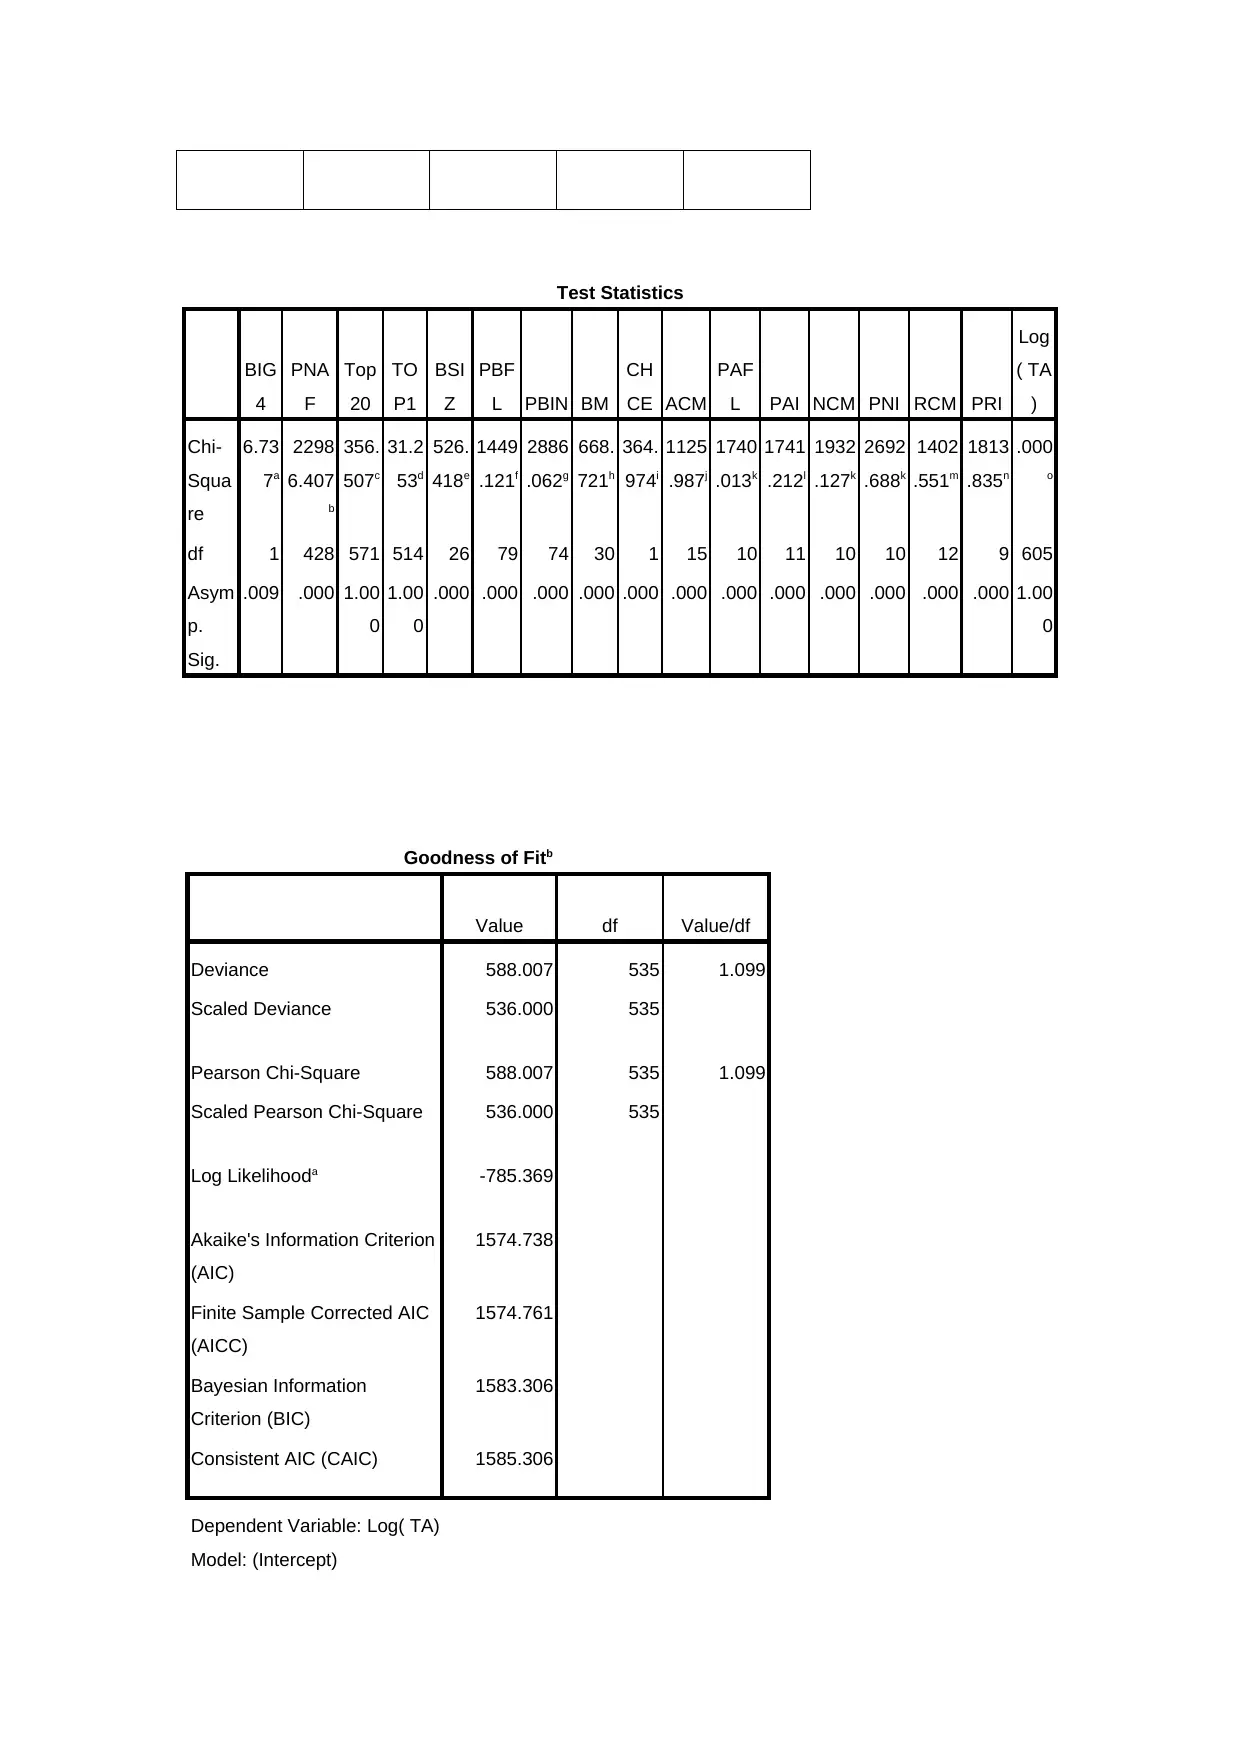
Test Statistics
BIG
4
PNA
F
Top
20
TO
P1
BSI
Z
PBF
L PBIN BM
CH
CE ACM
PAF
L PAI NCM PNI RCM PRI
Log
( TA
)
Chi-
Squa
re
6.73
7a
2298
6.407
b
356.
507c
31.2
53d
526.
418e
1449
.121f
2886
.062g
668.
721h
364.
974i
1125
.987j
1740
.013k
1741
.212l
1932
.127k
2692
.688k
1402
.551m
1813
.835n
.000
o
df 1 428 571 514 26 79 74 30 1 15 10 11 10 10 12 9 605
Asym
p.
Sig.
.009 .000 1.00
0
1.00
0
.000 .000 .000 .000 .000 .000 .000 .000 .000 .000 .000 .000 1.00
0
Goodness of Fitb
Value df Value/df
Deviance 588.007 535 1.099
Scaled Deviance 536.000 535
Pearson Chi-Square 588.007 535 1.099
Scaled Pearson Chi-Square 536.000 535
Log Likelihooda -785.369
Akaike's Information Criterion
(AIC)
1574.738
Finite Sample Corrected AIC
(AICC)
1574.761
Bayesian Information
Criterion (BIC)
1583.306
Consistent AIC (CAIC) 1585.306
Dependent Variable: Log( TA)
Model: (Intercept)
⊘ This is a preview!⊘
Do you want full access?
Subscribe today to unlock all pages.
Trusted by 1+ million students worldwide
1 out of 22

Your All-in-One AI-Powered Toolkit for Academic Success.
+13062052269
info@desklib.com
Available 24*7 on WhatsApp / Email
![[object Object]](/_next/static/media/star-bottom.7253800d.svg)
Unlock your academic potential
Copyright © 2020–2026 A2Z Services. All Rights Reserved. Developed and managed by ZUCOL.