Correlation Analysis in Statistics for Science Behavior Lab 1 Homework

Verified

Added on  2022/11/14

|4
|453
|76
Homework Assignment
AI Summary
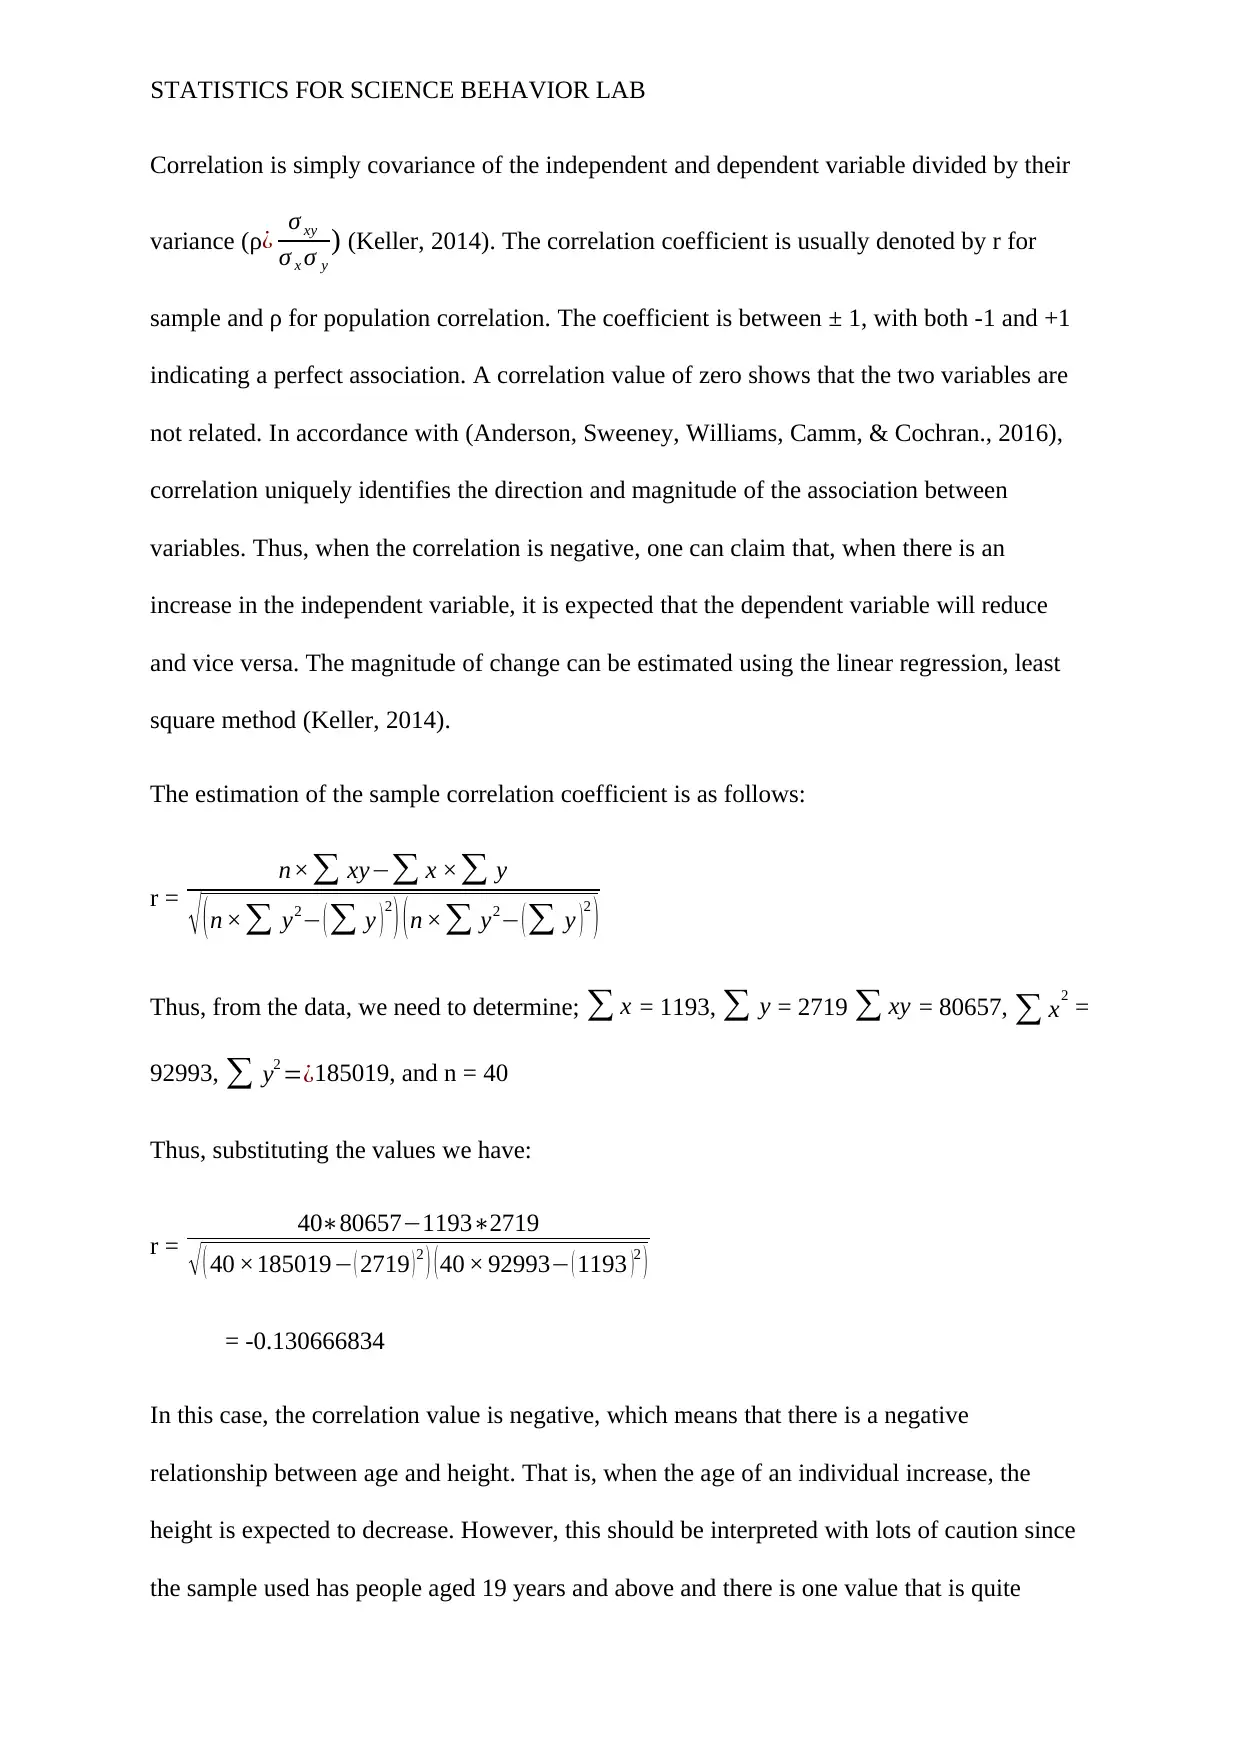
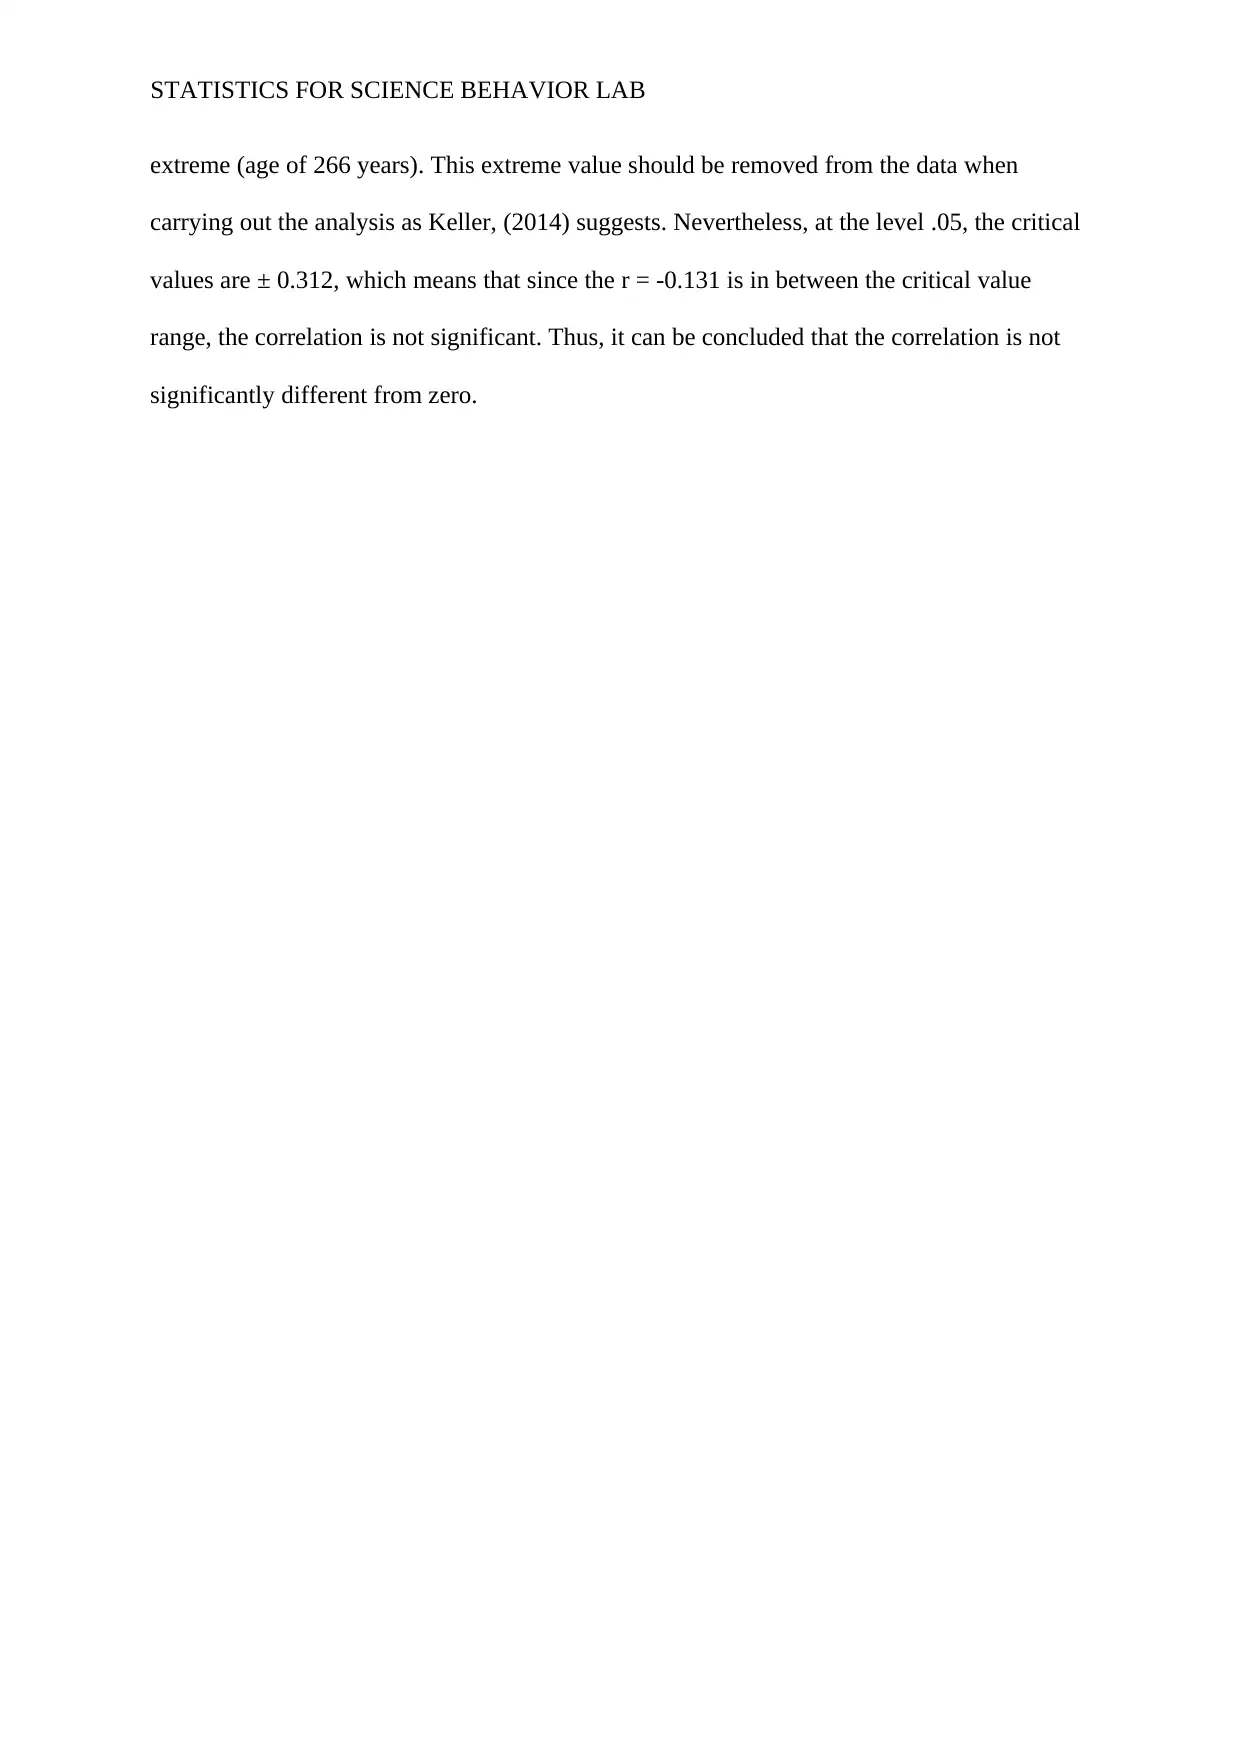
This homework assignment, from a Statistics for Science Behavior Lab, focuses on correlation analysis. The student calculates the correlation coefficient between age and height using provided data. The analysis reveals a negative correlation, indicating that as age increases, height tends to decrease, although the student notes that the result should be interpreted with caution due to an extreme outlier in the age data. The student determines that the correlation is not statistically significant based on a comparison with critical values at the 0.05 level. The solution includes the formula used for calculating the correlation coefficient, the values from the dataset, the resulting correlation value, and a conclusion about the significance of the correlation, referencing key statistical concepts and relevant sources.
tabler-icon-diamond-filled.svg

Contribute Materials

Your contribution can guide someone’s learning journey. Share your documents today.
Document Page
Running head: STATISTICS FOR SCIENCE BEHAVIOR LAB
Statistics for Science Behavior Lab
Name:
Institution:
tabler-icon-diamond-filled.svg

Secure Best Marks with AI Grader

Need help grading? Try our AI Grader for instant feedback on your assignments.
Document Page
STATISTICS FOR SCIENCE BEHAVIOR LAB
Correlation is simply covariance of the independent and dependent variable divided by their
variance (ρ¿ σ xy
σ x σ y
) (Keller, 2014). The correlation coefficient is usually denoted by r for
sample and ρ for population correlation. The coefficient is between ± 1, with both -1 and +1
indicating a perfect association. A correlation value of zero shows that the two variables are
not related. In accordance with (Anderson, Sweeney, Williams, Camm, & Cochran., 2016),
correlation uniquely identifies the direction and magnitude of the association between
variables. Thus, when the correlation is negative, one can claim that, when there is an
increase in the independent variable, it is expected that the dependent variable will reduce
and vice versa. The magnitude of change can be estimated using the linear regression, least
square method (Keller, 2014).
The estimation of the sample correlation coefficient is as follows:
r =
n× xy x × y
(n × y2 ( y )2
) (n × y2 ( y )2
)
Thus, from the data, we need to determine; x = 1193, y = 2719 xy = 80657, x2 =
92993, y2 =¿185019, and n = 40
Thus, substituting the values we have:
r = 408065711932719
( 40 ×185019 ( 2719 )2 ) (40 × 92993 ( 1193 )2 )
= -0.130666834
In this case, the correlation value is negative, which means that there is a negative
relationship between age and height. That is, when the age of an individual increase, the
height is expected to decrease. However, this should be interpreted with lots of caution since
the sample used has people aged 19 years and above and there is one value that is quite
Document Page
STATISTICS FOR SCIENCE BEHAVIOR LAB
extreme (age of 266 years). This extreme value should be removed from the data when
carrying out the analysis as Keller, (2014) suggests. Nevertheless, at the level .05, the critical
values are ± 0.312, which means that since the r = -0.131 is in between the critical value
range, the correlation is not significant. Thus, it can be concluded that the correlation is not
significantly different from zero.
Document Page
STATISTICS FOR SCIENCE BEHAVIOR LAB
References
Anderson, D. R., Sweeney, D. J., Williams, T. A., Camm, J. D., & Cochran., J. J. (2016).
Statistics for business & economics (13th ed.). Nelson Education.
Keller, G. (2014). Statistics for Management and Economics (10th ed.). Stamford: Cengage
Learning.
chevron_up_icon
1 out of 4
circle_padding
hide_on_mobile
zoom_out_icon
logo.png

Your All-in-One AI-Powered Toolkit for Academic Success.

Available 24*7 on WhatsApp / Email

[object Object]