Correlation Analysis of Emotional Intelligence, Motivation,Absences

Verified

Added on  2023/06/12

|13
|659
|53
Homework Assignment
AI Summary
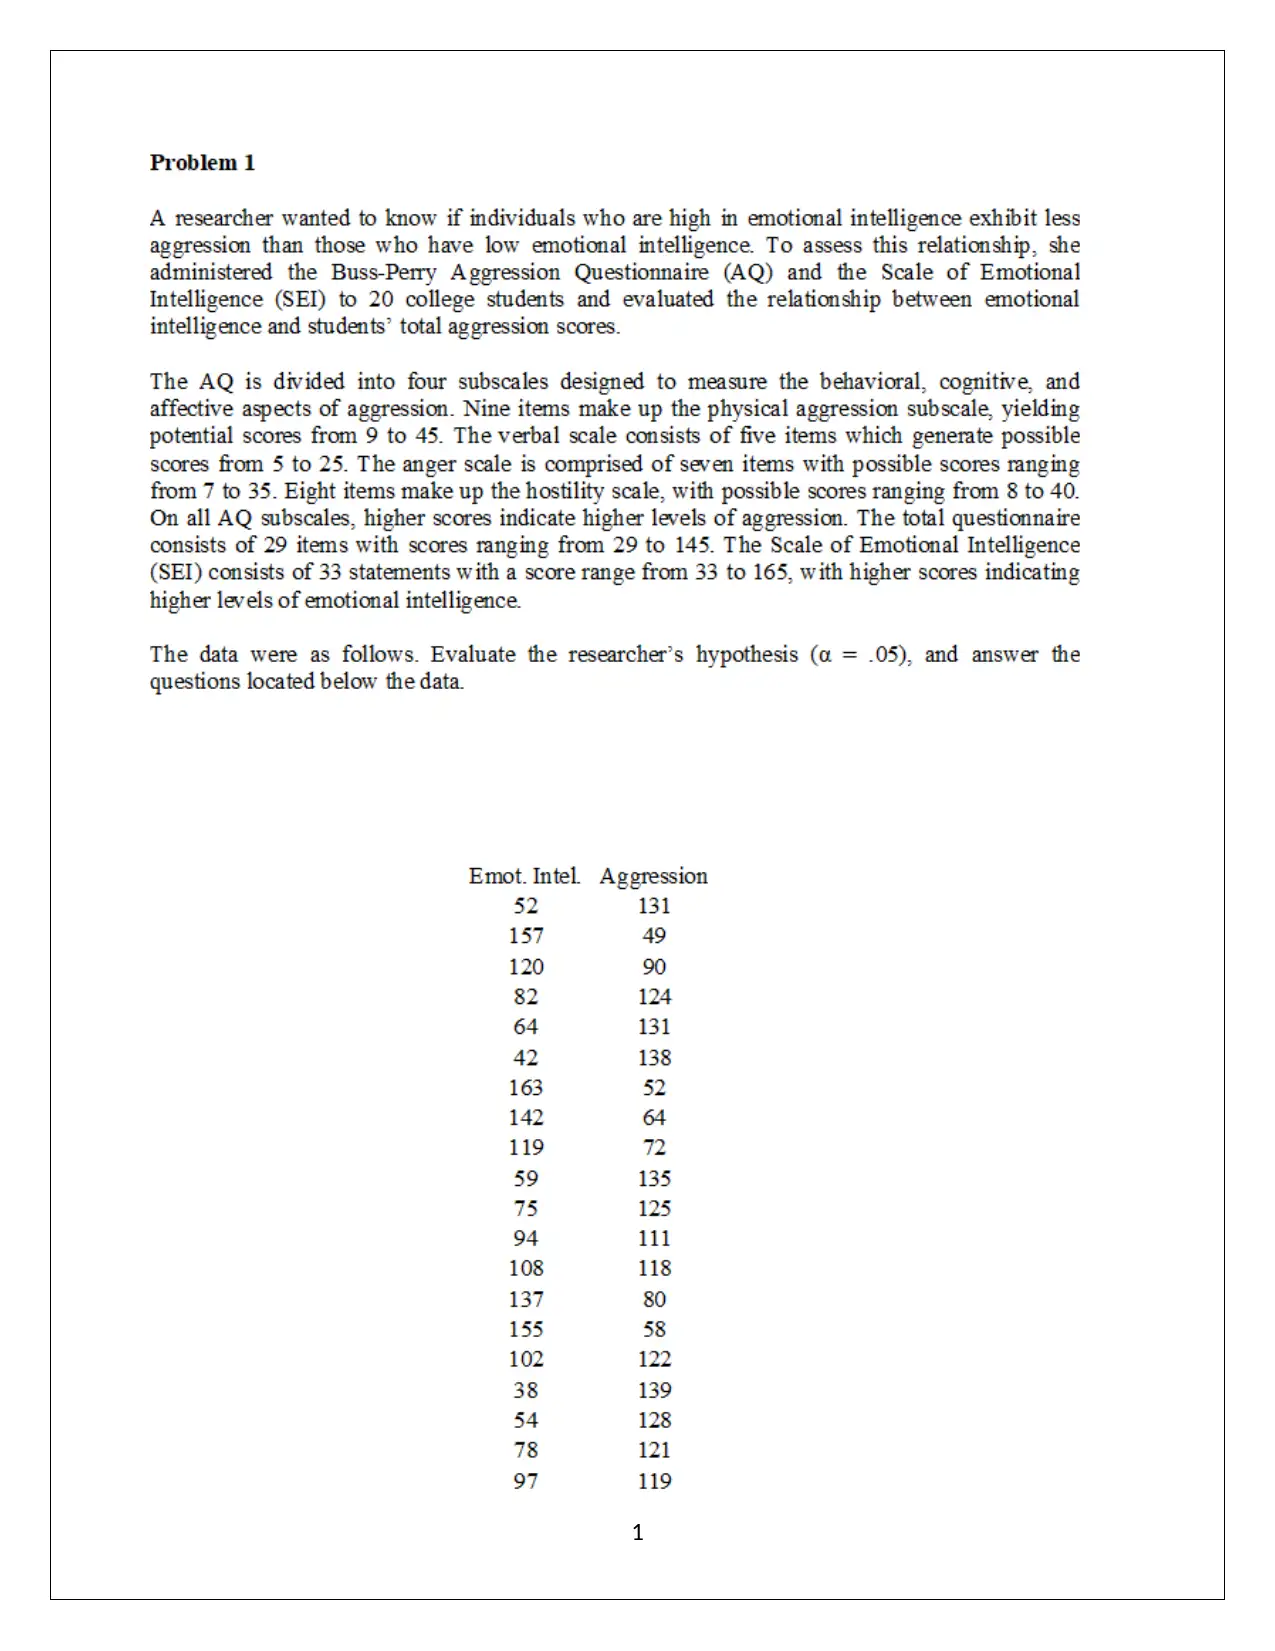
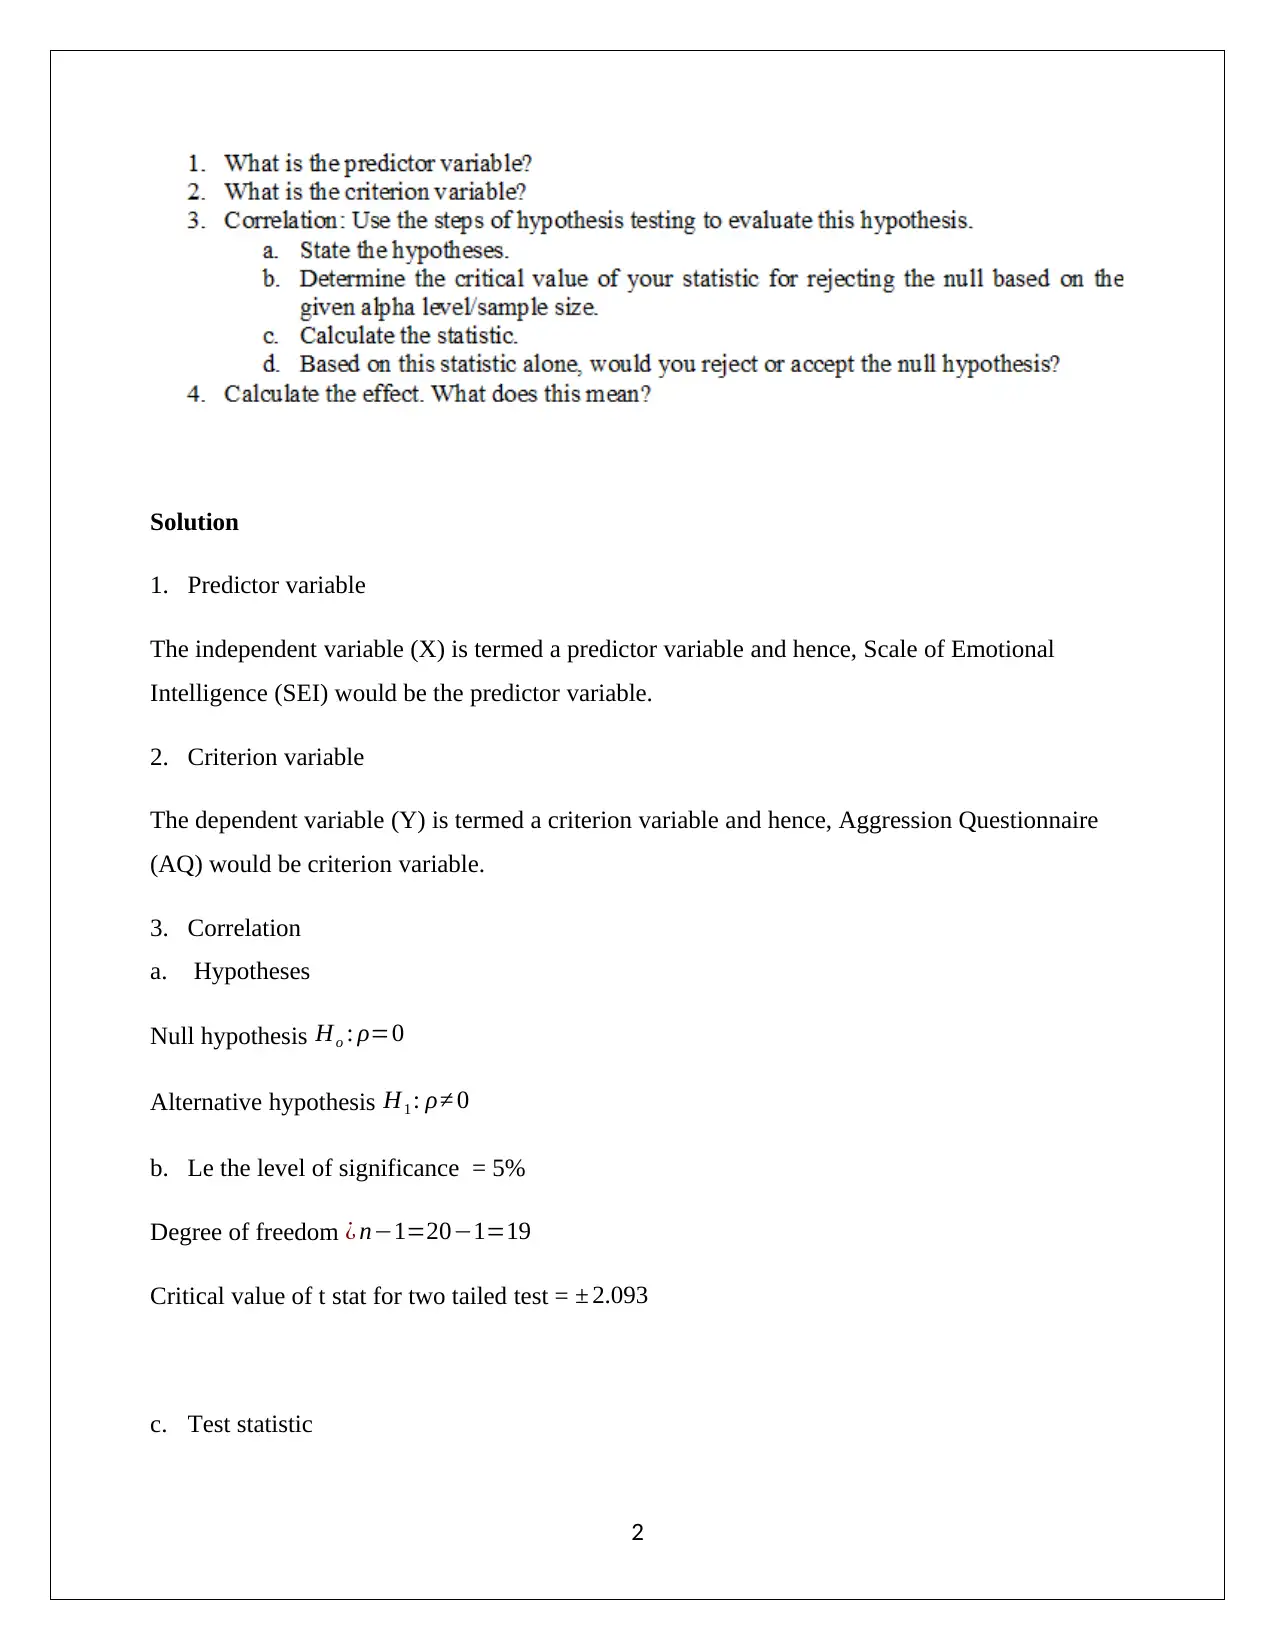
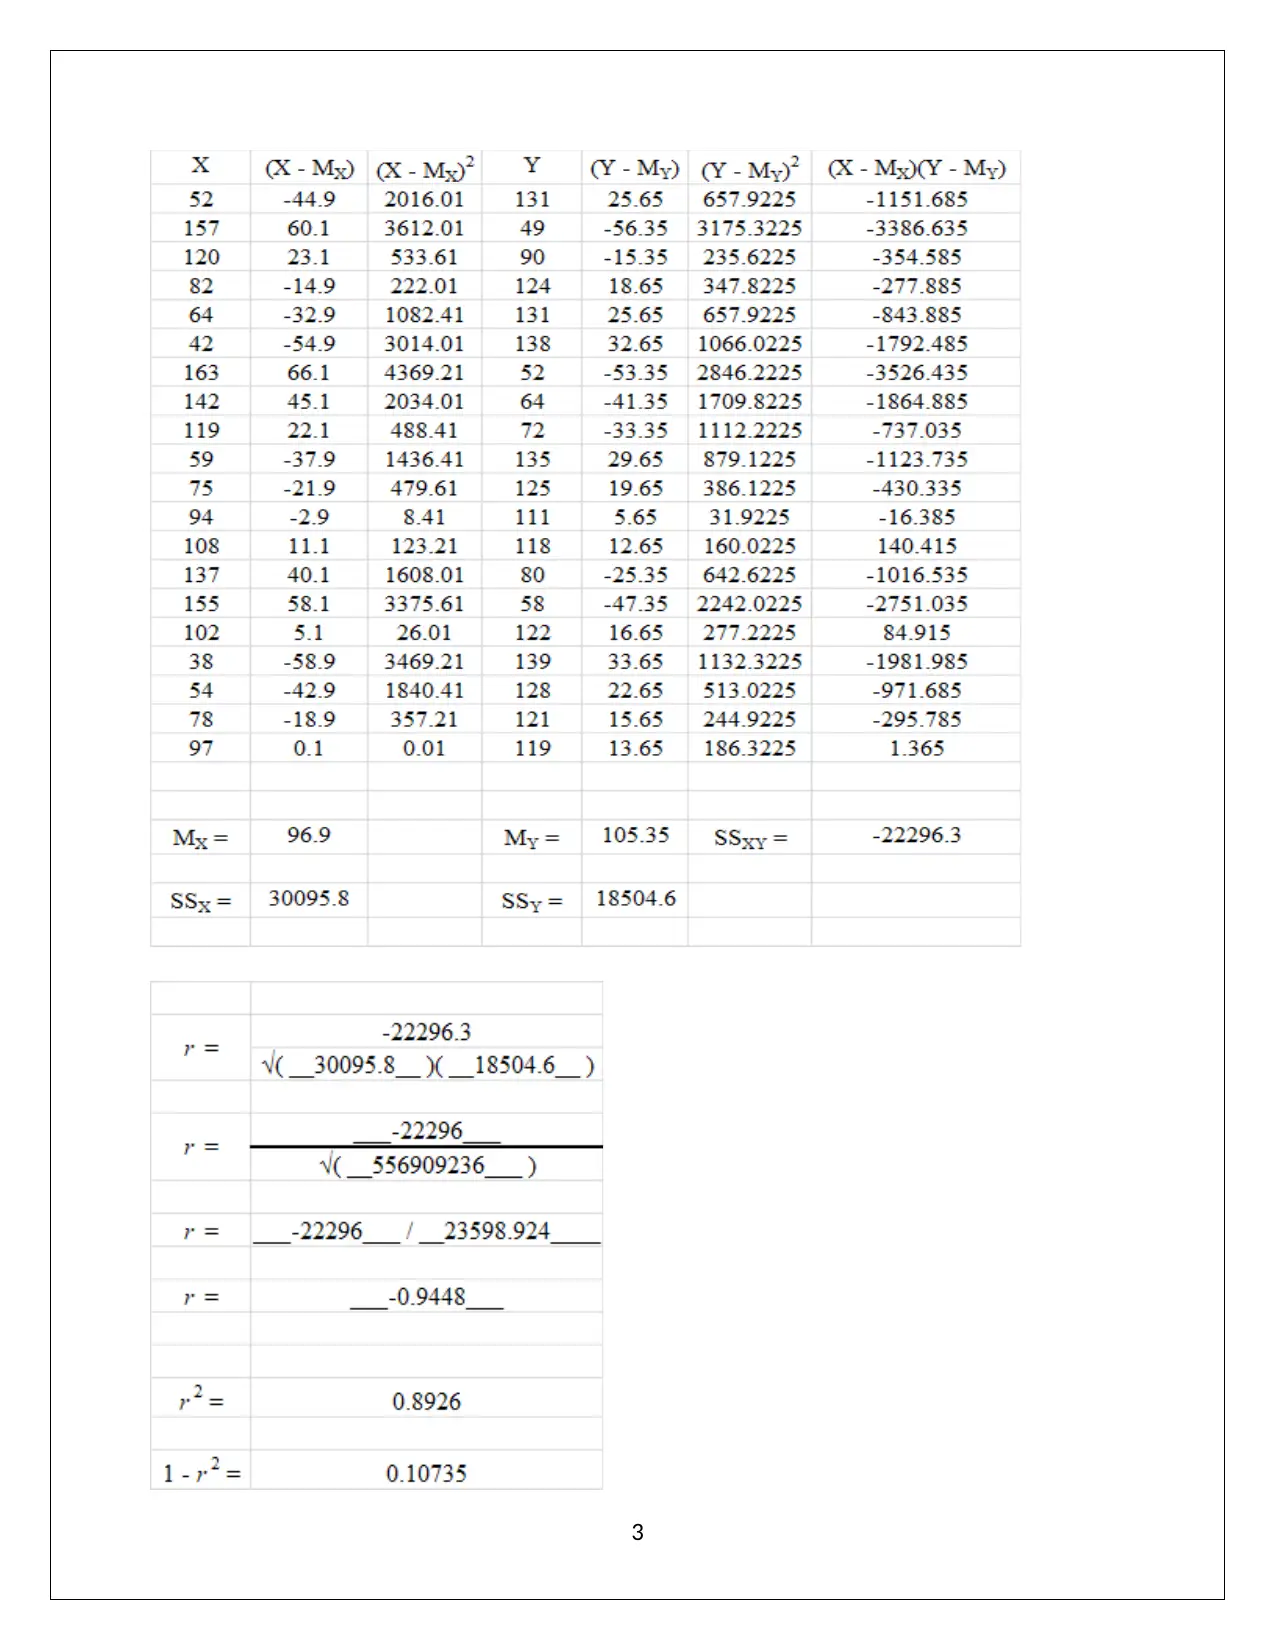
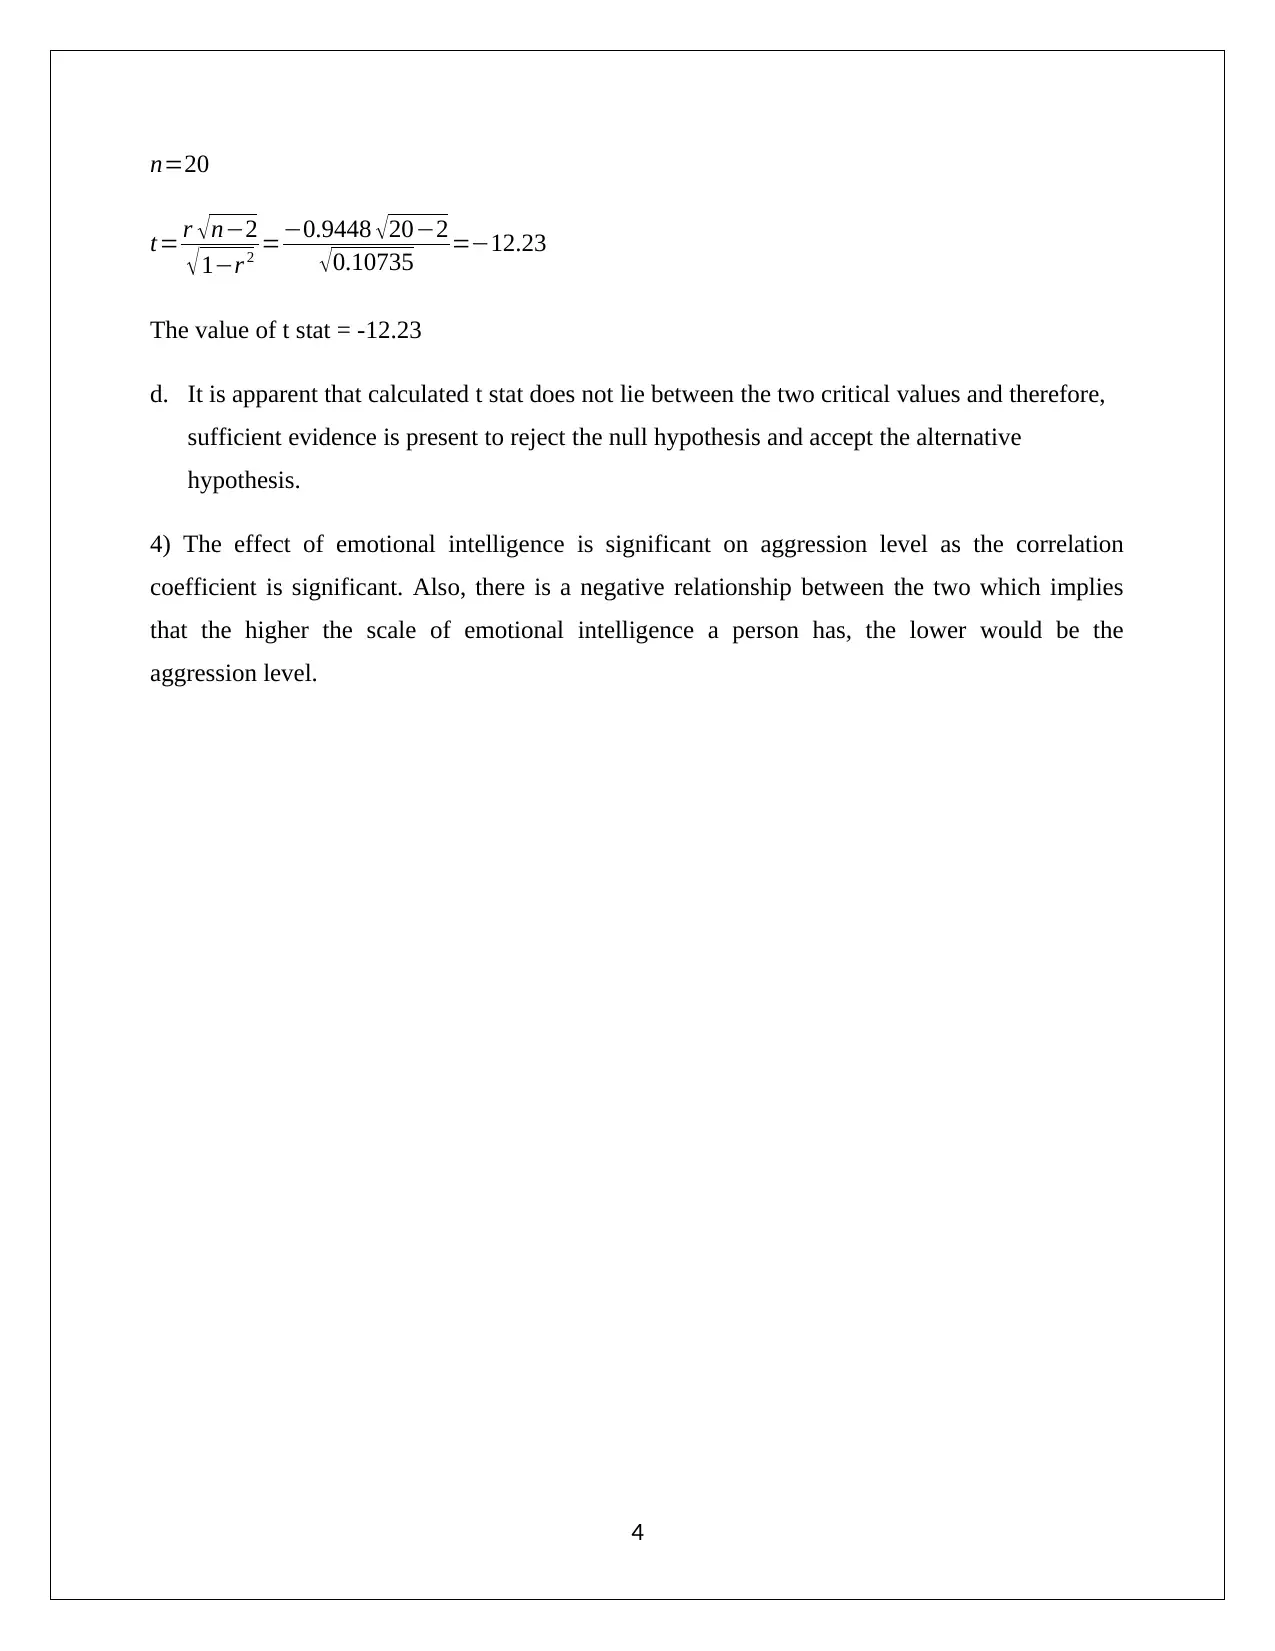
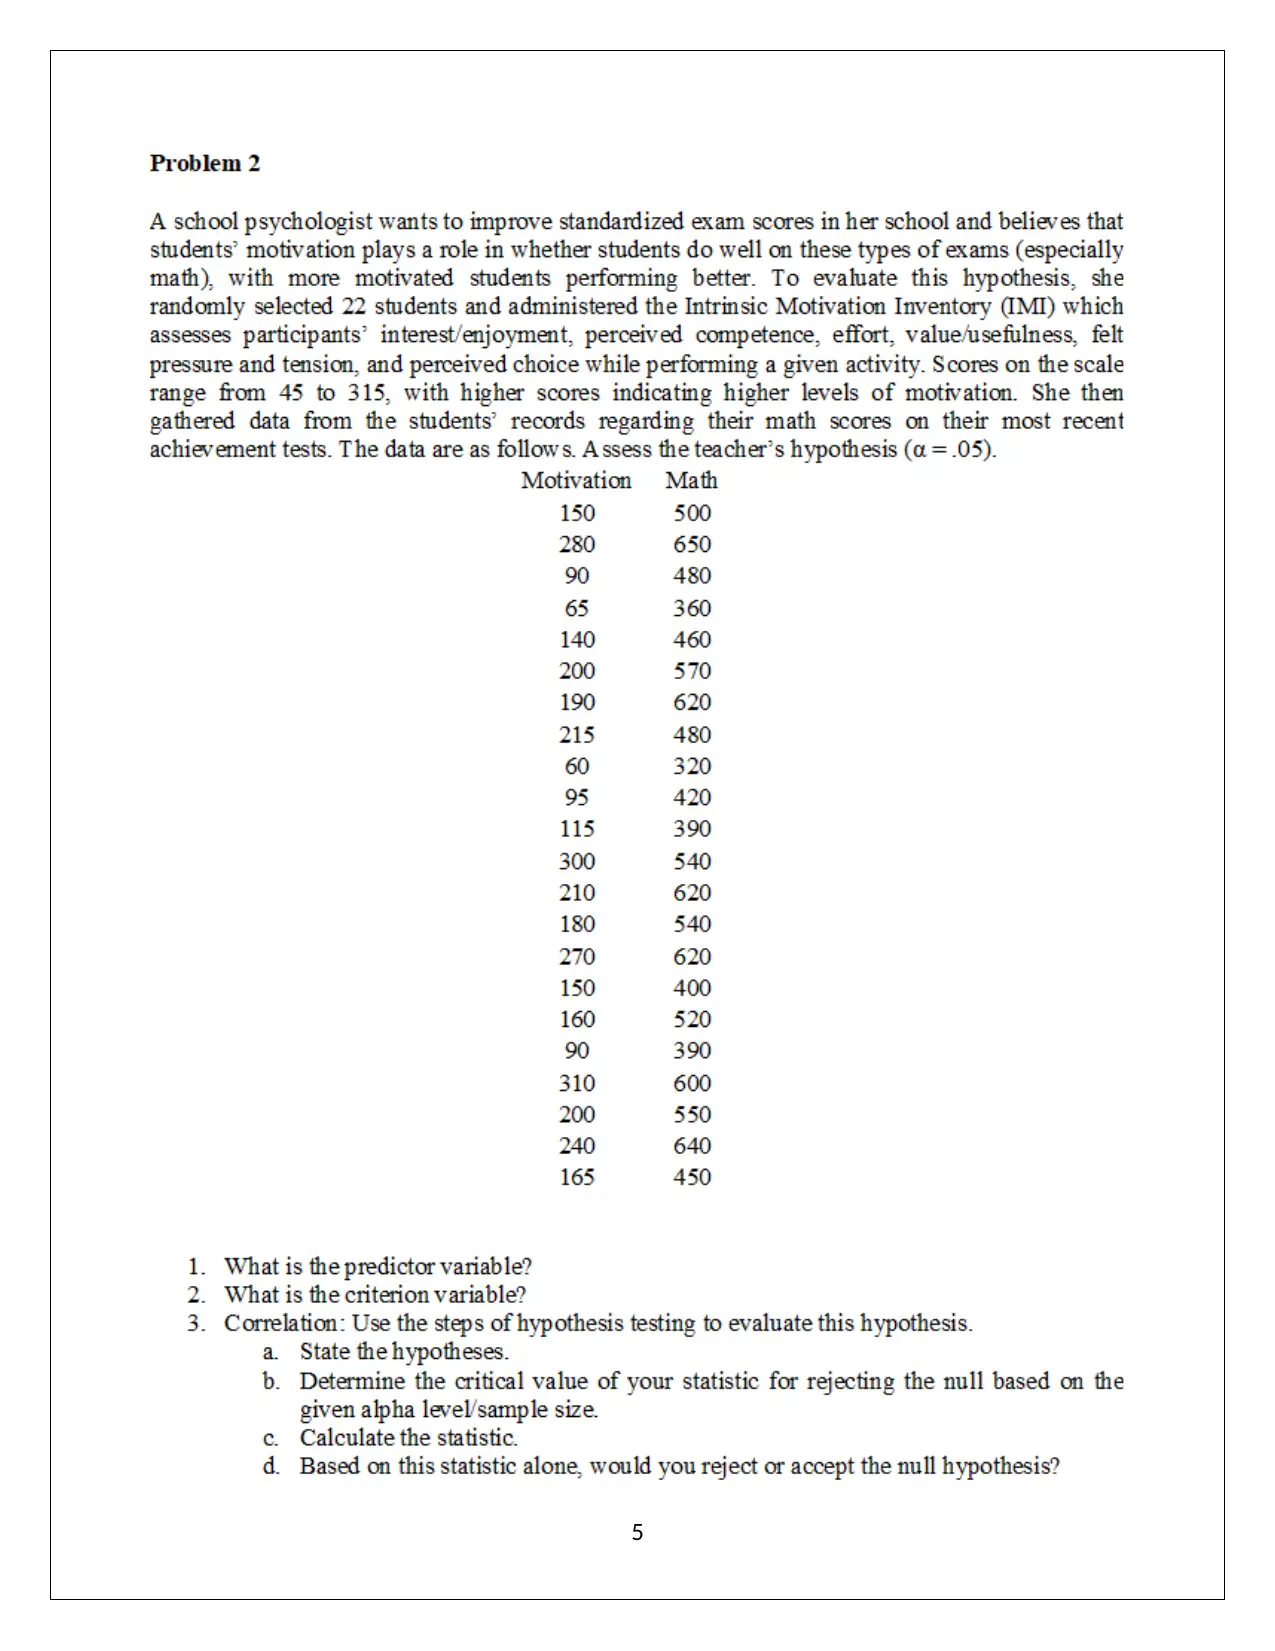
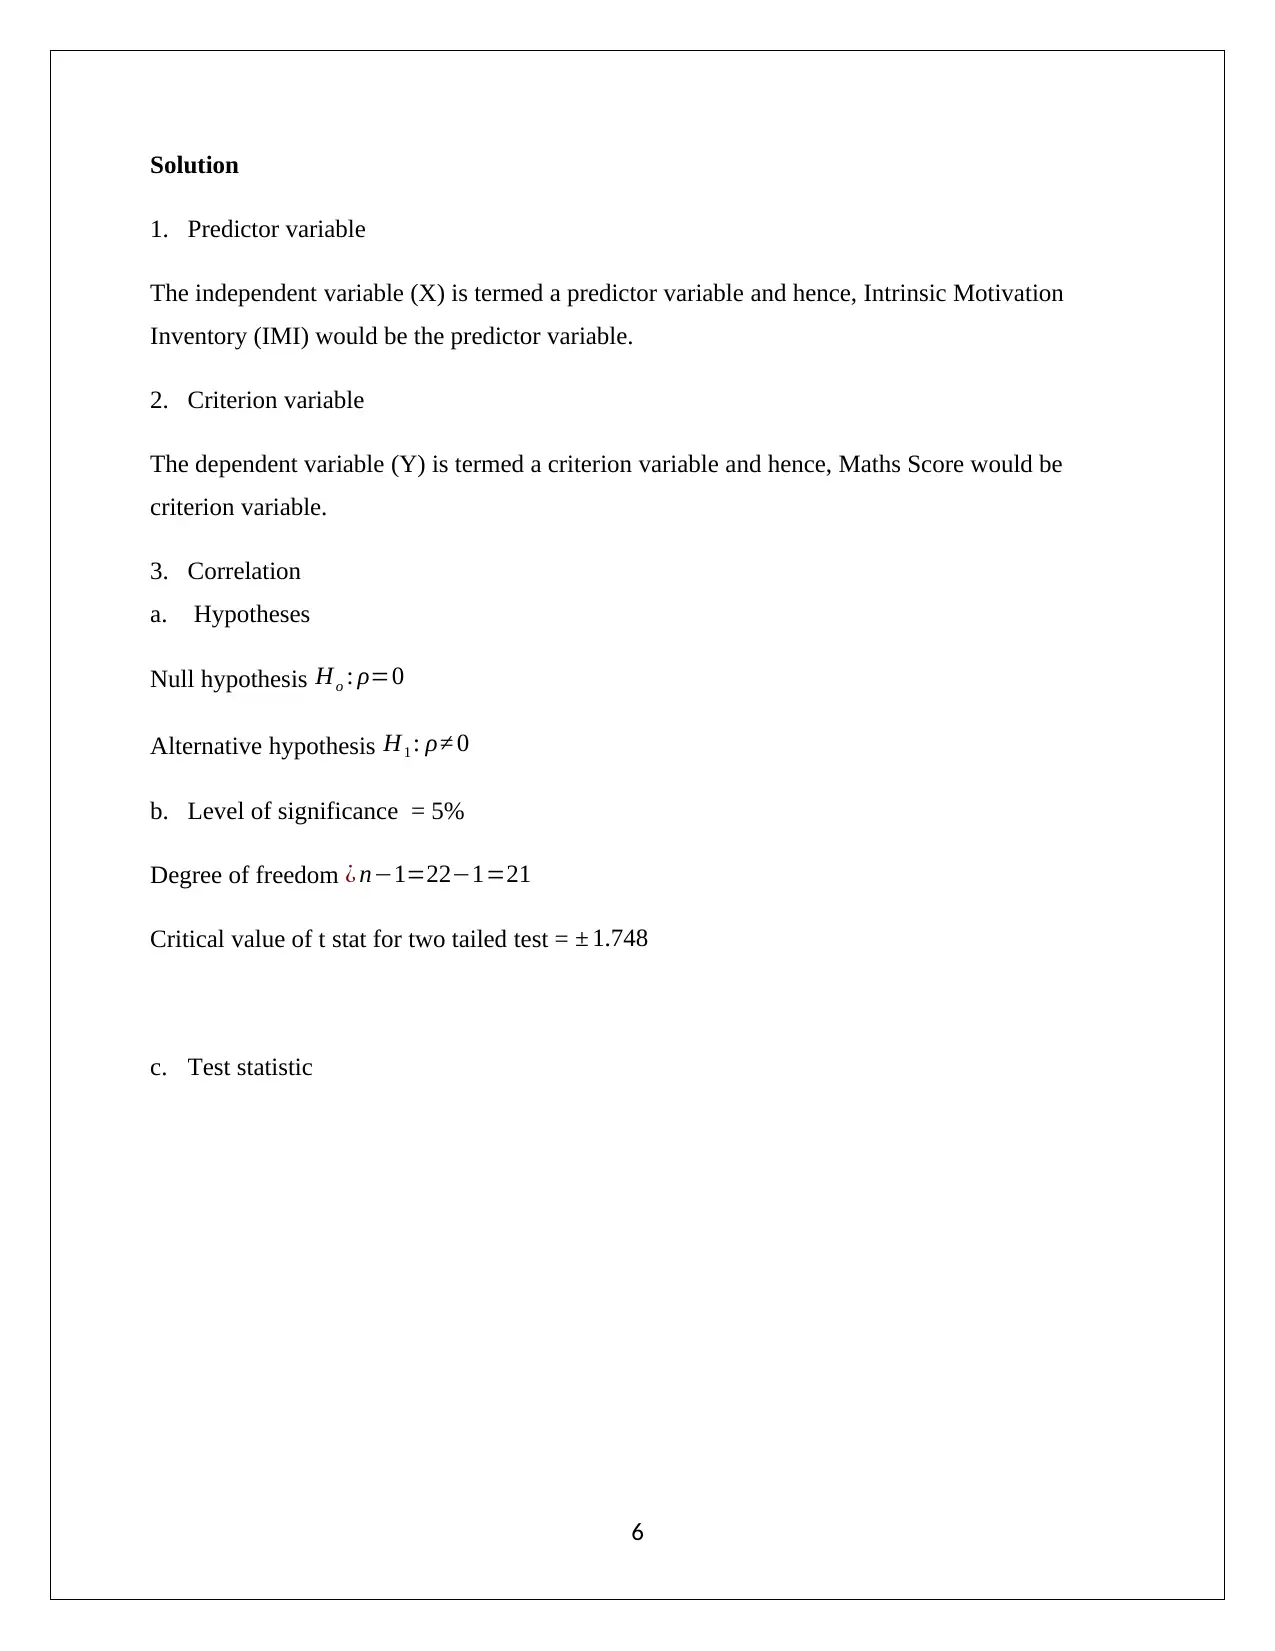
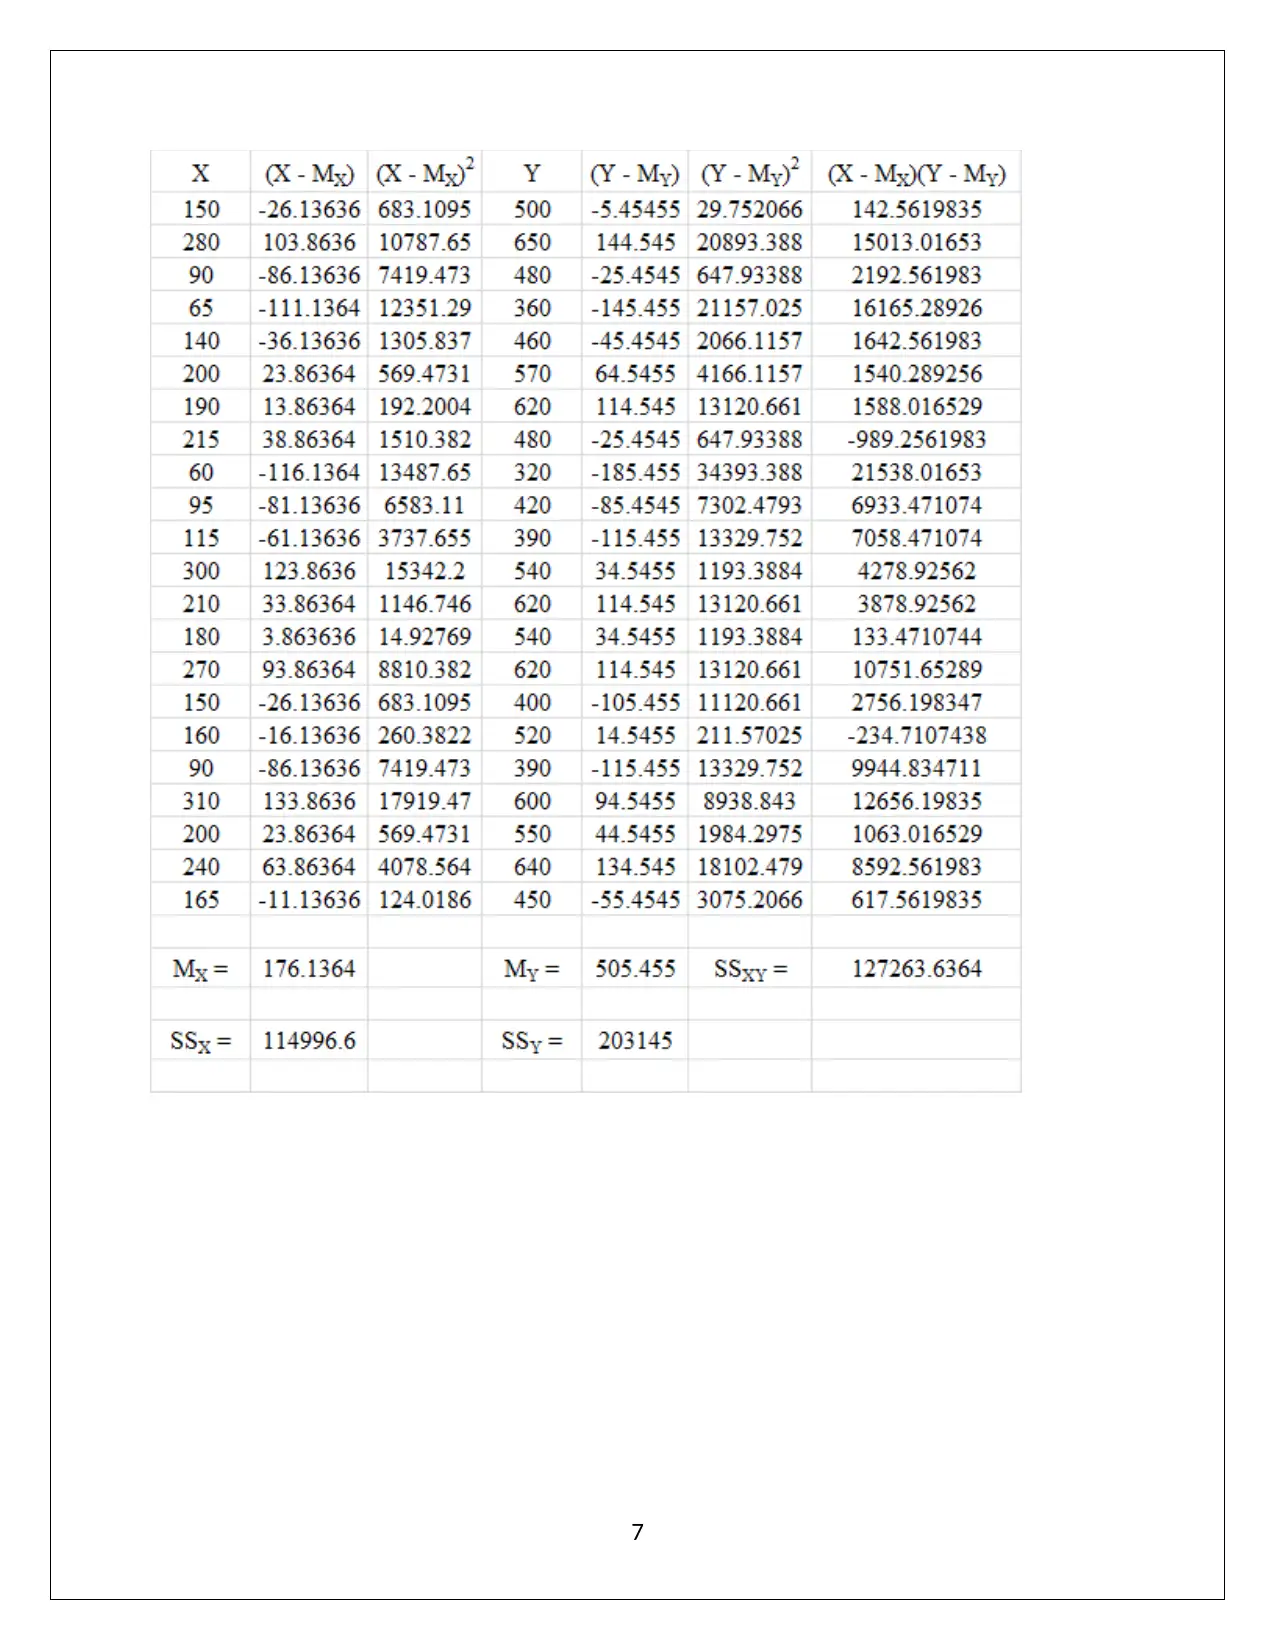
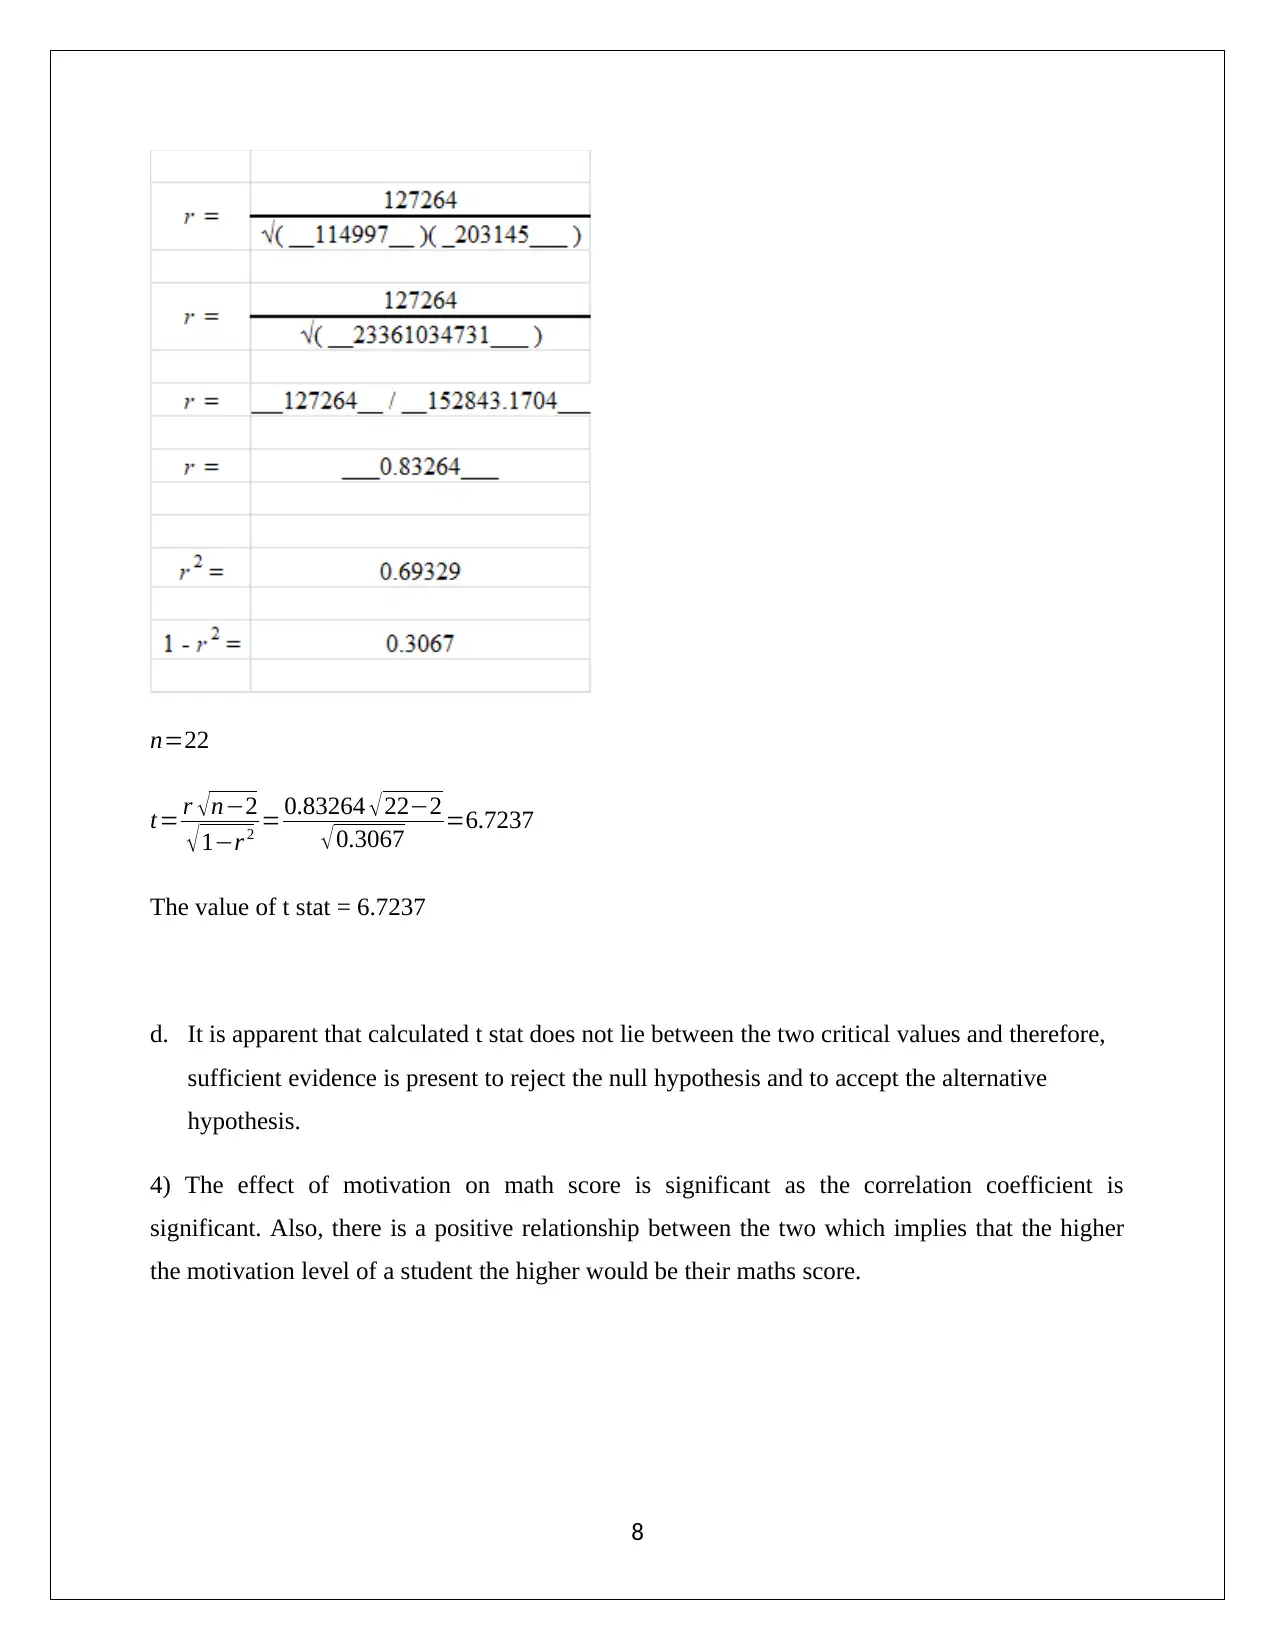
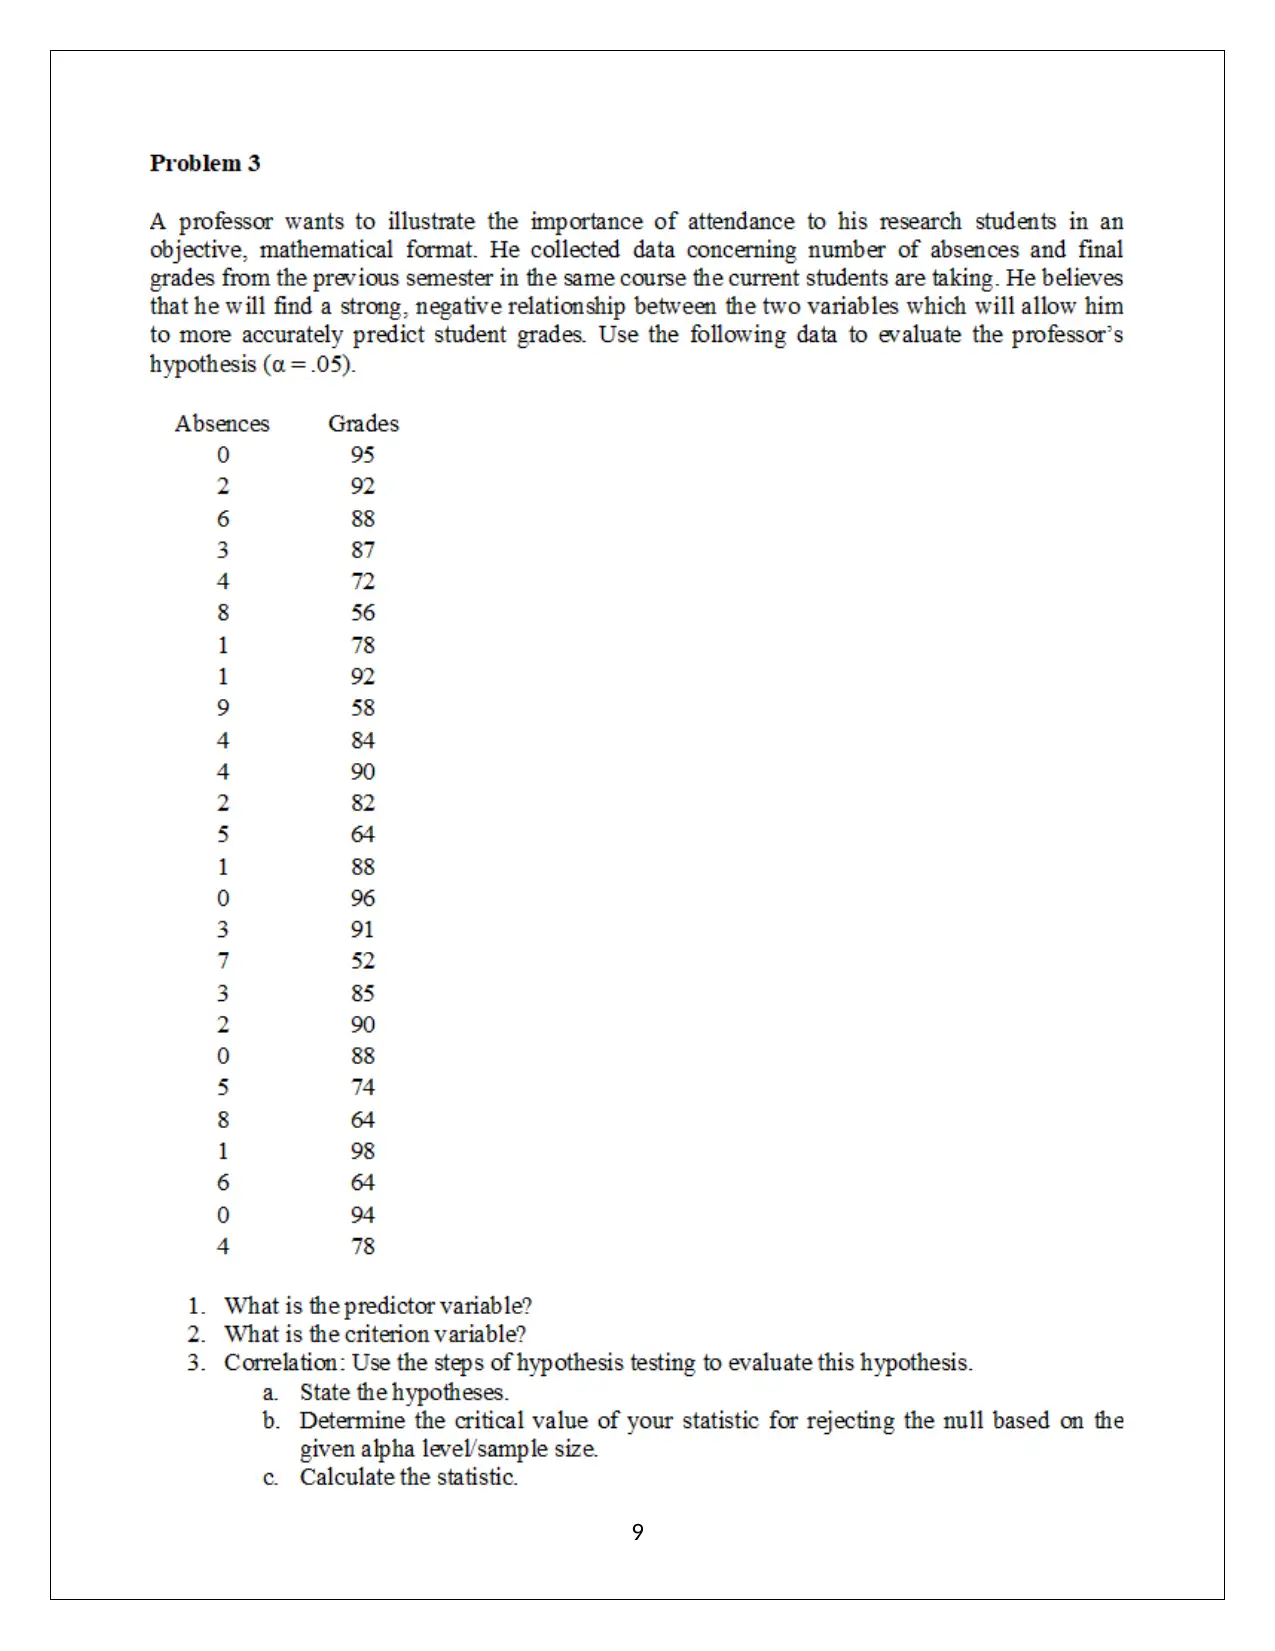
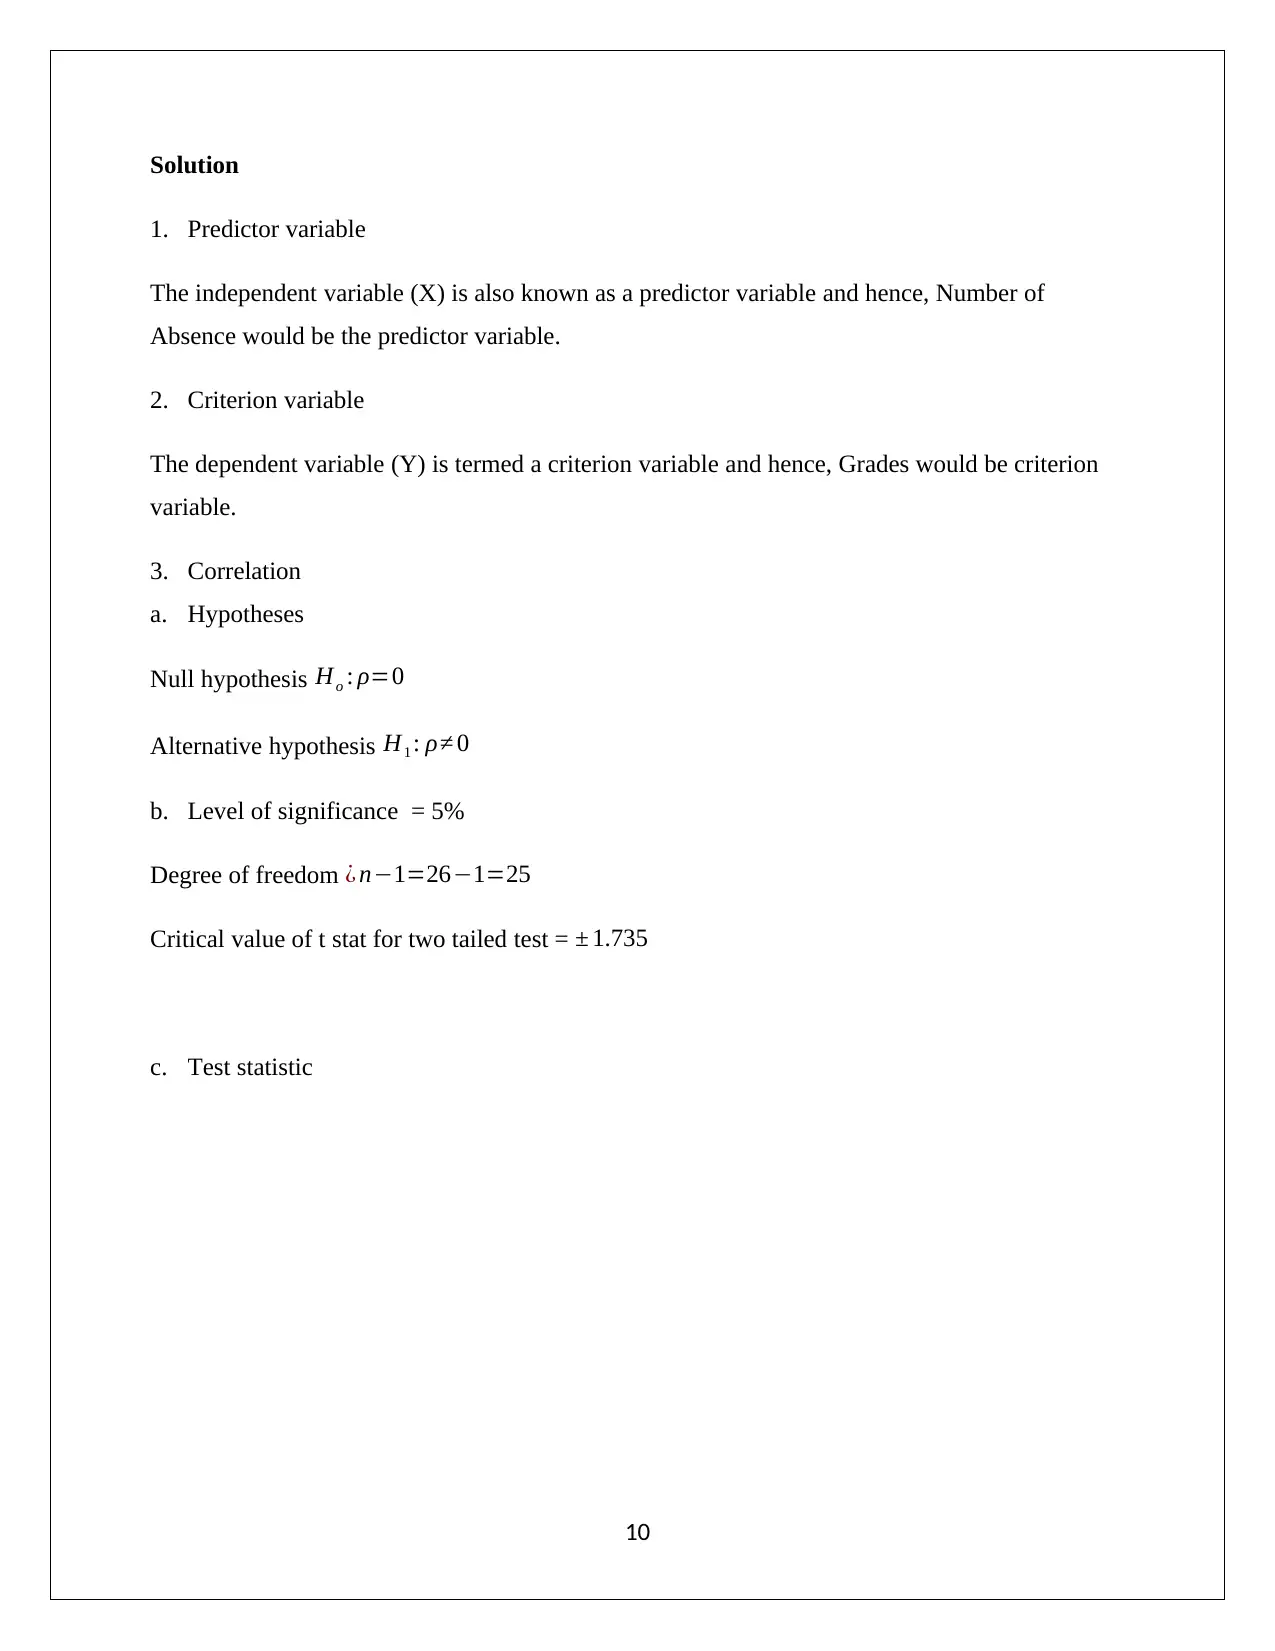
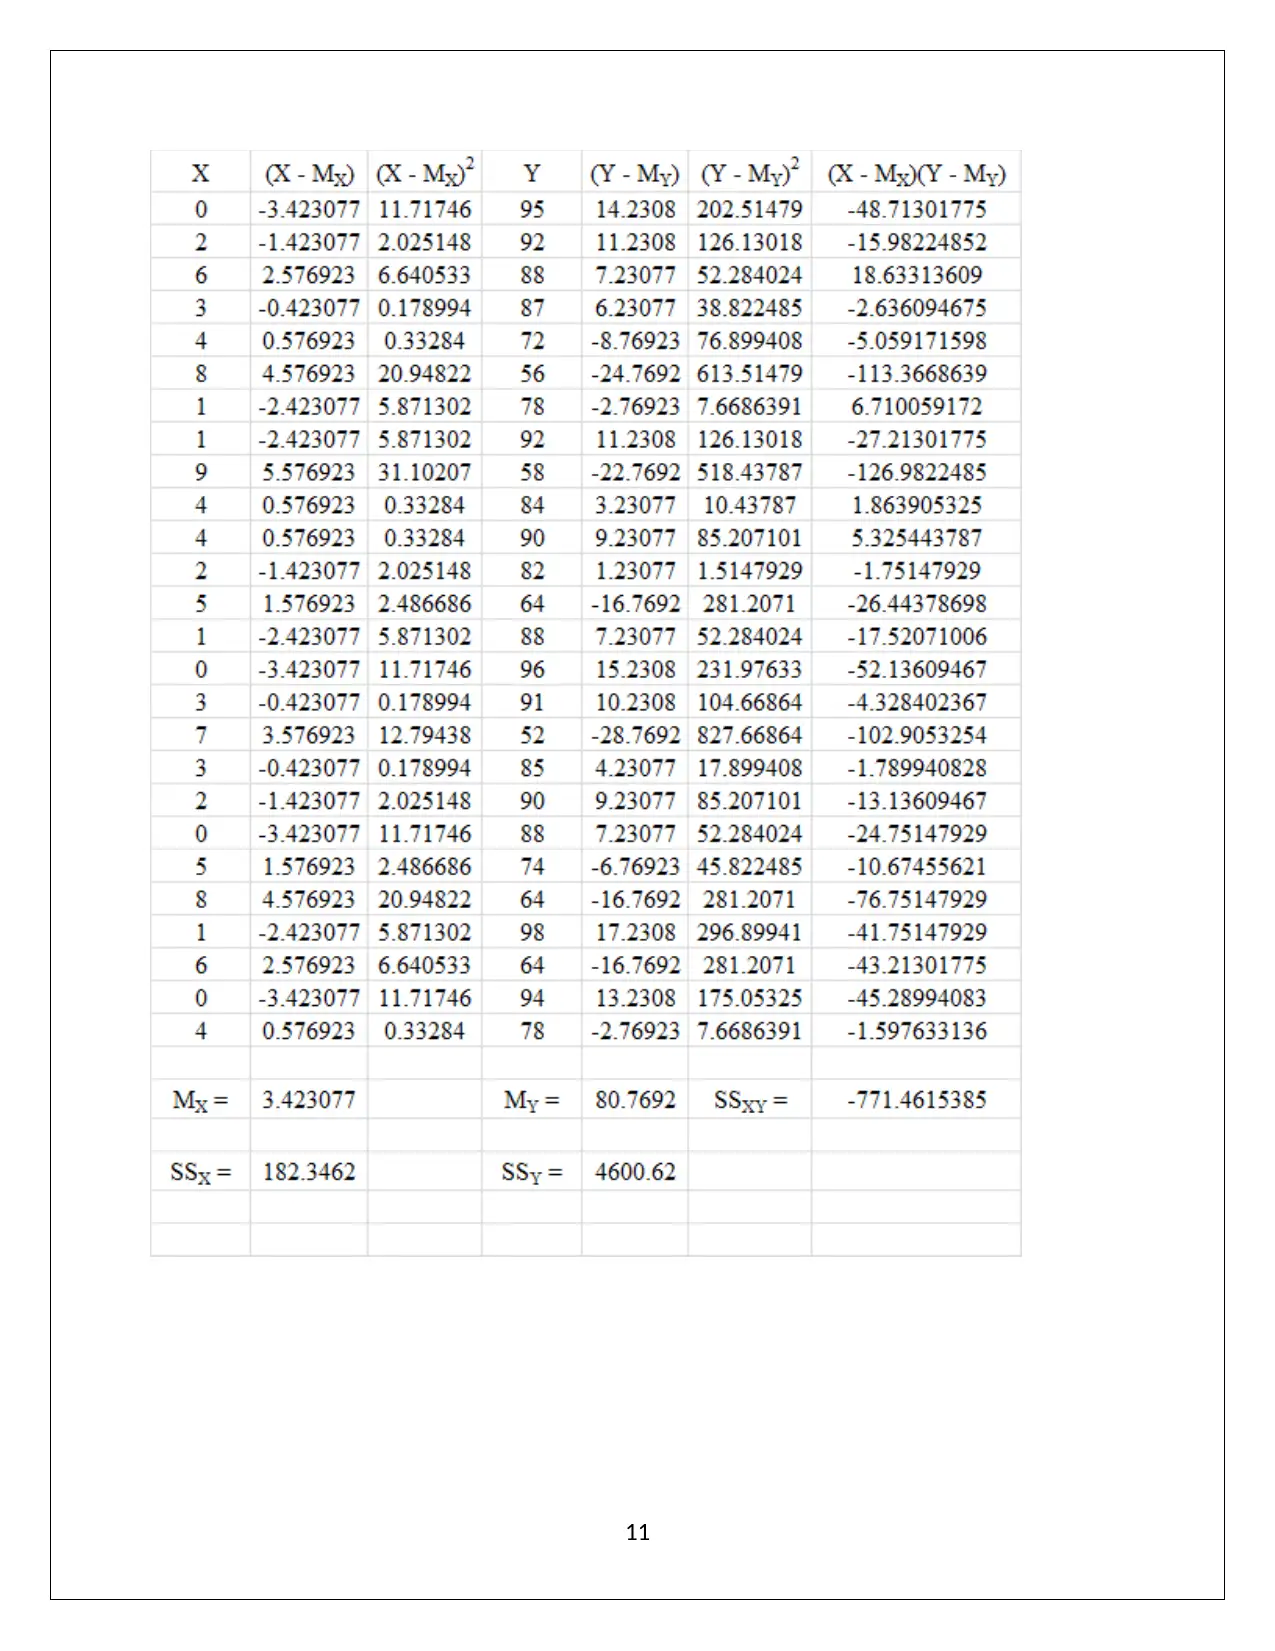
This assignment provides detailed solutions to correlation problems, focusing on hypothesis testing and the relationships between different variables. The first problem examines the correlation between emotional intelligence and aggression, finding a significant negative relationship. The second problem analyzes the correlation between intrinsic motivation and math scores, revealing a significant positive relationship. The third problem investigates the correlation between the number of absences and grades, indicating a significant negative relationship. Each solution includes the null and alternative hypotheses, level of significance, degrees of freedom, test statistic calculation, and a conclusion based on the t-statistic and critical values. Desklib provides a platform for students to access similar solved assignments and past papers.
Document Page
CORRELATION
Assignment 8
[Pick the date]
Student Name
tabler-icon-diamond-filled.svg

Paraphrase This Document

Need a fresh take? Get an instant paraphrase of this document with our AI Paraphraser
Document Page
1
Document Page
Solution
1. Predictor variable
The independent variable (X) is termed a predictor variable and hence, Scale of Emotional
Intelligence (SEI) would be the predictor variable.
2. Criterion variable
The dependent variable (Y) is termed a criterion variable and hence, Aggression Questionnaire
(AQ) would be criterion variable.
3. Correlation
a. Hypotheses
Null hypothesis Ho : ρ=0
Alternative hypothesis H1 : ρ 0
b. Le the level of significance = 5%
Degree of freedom ¿ n1=201=19
Critical value of t stat for two tailed test = ± 2.093
c. Test statistic
2
Document Page
3
tabler-icon-diamond-filled.svg

Paraphrase This Document

Need a fresh take? Get an instant paraphrase of this document with our AI Paraphraser
Document Page
n=20
t= r n2
1r 2 =0.9448 202
0.10735 =12.23
The value of t stat = -12.23
d. It is apparent that calculated t stat does not lie between the two critical values and therefore,
sufficient evidence is present to reject the null hypothesis and accept the alternative
hypothesis.
4) The effect of emotional intelligence is significant on aggression level as the correlation
coefficient is significant. Also, there is a negative relationship between the two which implies
that the higher the scale of emotional intelligence a person has, the lower would be the
aggression level.
4
Document Page
5
Document Page
Solution
1. Predictor variable
The independent variable (X) is termed a predictor variable and hence, Intrinsic Motivation
Inventory (IMI) would be the predictor variable.
2. Criterion variable
The dependent variable (Y) is termed a criterion variable and hence, Maths Score would be
criterion variable.
3. Correlation
a. Hypotheses
Null hypothesis Ho : ρ=0
Alternative hypothesis H1 : ρ 0
b. Level of significance = 5%
Degree of freedom ¿ n1=221=21
Critical value of t stat for two tailed test = ± 1.748
c. Test statistic
6
tabler-icon-diamond-filled.svg

Paraphrase This Document

Need a fresh take? Get an instant paraphrase of this document with our AI Paraphraser
Document Page
7
Document Page
n=22
t= r n2
1r 2 = 0.83264 222
0.3067 =6.7237
The value of t stat = 6.7237
d. It is apparent that calculated t stat does not lie between the two critical values and therefore,
sufficient evidence is present to reject the null hypothesis and to accept the alternative
hypothesis.
4) The effect of motivation on math score is significant as the correlation coefficient is
significant. Also, there is a positive relationship between the two which implies that the higher
the motivation level of a student the higher would be their maths score.
8
Document Page
9
tabler-icon-diamond-filled.svg

Paraphrase This Document

Need a fresh take? Get an instant paraphrase of this document with our AI Paraphraser
Document Page
Solution
1. Predictor variable
The independent variable (X) is also known as a predictor variable and hence, Number of
Absence would be the predictor variable.
2. Criterion variable
The dependent variable (Y) is termed a criterion variable and hence, Grades would be criterion
variable.
3. Correlation
a. Hypotheses
Null hypothesis Ho : ρ=0
Alternative hypothesis H1 : ρ 0
b. Level of significance = 5%
Degree of freedom ¿ n1=261=25
Critical value of t stat for two tailed test = ± 1.735
c. Test statistic
10
Document Page
11
chevron_up_icon
1 out of 13
circle_padding
hide_on_mobile
zoom_out_icon
[object Object]