Statistics for Behavioral Lab: Correlation and Confidence Analysis

Verified

Added on  2022/11/14

|3
|389
|54
Report
AI Summary
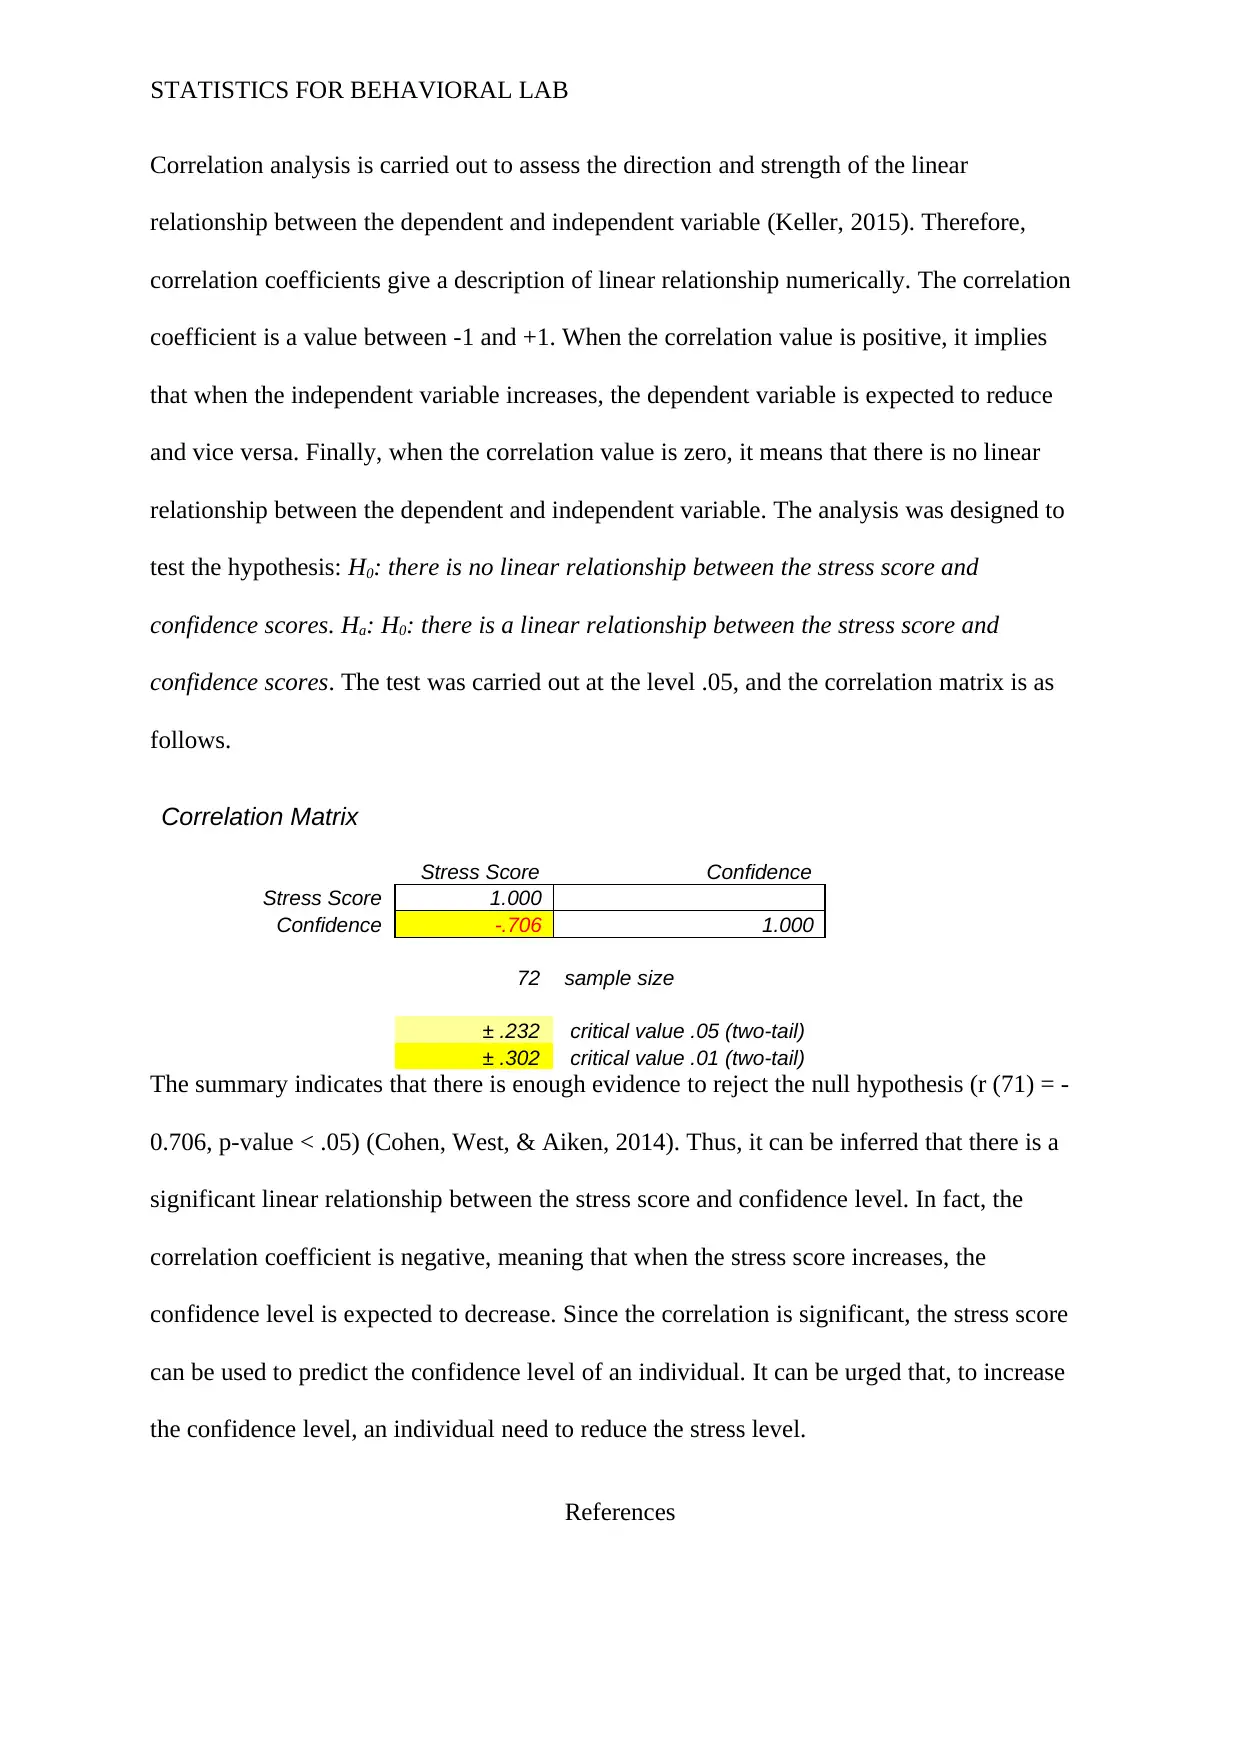
This report presents a correlation analysis conducted to assess the linear relationship between stress and confidence scores. The analysis aimed to test the hypothesis that there is no linear relationship between the two variables. The correlation coefficient, a value between -1 and +1, was used to describe the strength and direction of the relationship. The results, based on a sample size of 72, indicated a significant negative correlation (r (71) = -0.706, p-value < .05), leading to the rejection of the null hypothesis. This suggests that as stress scores increase, confidence levels tend to decrease. The report concludes that stress score can be used to predict confidence level, and reducing stress may increase confidence. The report references key statistical resources and data analysis to support the findings.
Document Page
Running head: STATISTICS FOR BEHAVIORAL LAB
Statistics for Behavioral Lab
Name:
Institution:
tabler-icon-diamond-filled.svg

Paraphrase This Document

Need a fresh take? Get an instant paraphrase of this document with our AI Paraphraser
Document Page
STATISTICS FOR BEHAVIORAL LAB
Correlation analysis is carried out to assess the direction and strength of the linear
relationship between the dependent and independent variable (Keller, 2015). Therefore,
correlation coefficients give a description of linear relationship numerically. The correlation
coefficient is a value between -1 and +1. When the correlation value is positive, it implies
that when the independent variable increases, the dependent variable is expected to reduce
and vice versa. Finally, when the correlation value is zero, it means that there is no linear
relationship between the dependent and independent variable. The analysis was designed to
test the hypothesis: H0: there is no linear relationship between the stress score and
confidence scores. Ha: H0: there is a linear relationship between the stress score and
confidence scores. The test was carried out at the level .05, and the correlation matrix is as
follows.
Correlation Matrix
Stress Score Confidence
Stress Score 1.000
Confidence -.706 1.000
72 sample size
± .232 critical value .05 (two-tail)
± .302 critical value .01 (two-tail)
The summary indicates that there is enough evidence to reject the null hypothesis (r (71) = -
0.706, p-value < .05) (Cohen, West, & Aiken, 2014). Thus, it can be inferred that there is a
significant linear relationship between the stress score and confidence level. In fact, the
correlation coefficient is negative, meaning that when the stress score increases, the
confidence level is expected to decrease. Since the correlation is significant, the stress score
can be used to predict the confidence level of an individual. It can be urged that, to increase
the confidence level, an individual need to reduce the stress level.
References
Document Page
STATISTICS FOR BEHAVIORAL LAB
Cohen, P., West, S. G., & Aiken, L. S. (2014). Applied multiple regression/correlation
analysis for the behavioral sciences (2nd ed.). Psychology Press.
Keller, G. (2015). Statistics for Management and Economics, Abbreviated. Cengage
Learning.
chevron_up_icon
1 out of 3
circle_padding
hide_on_mobile
zoom_out_icon
[object Object]