University Statistics Assignment: Correlation and Interpretation

Verified

Added on  2022/11/14

|10
|1866
|454
Homework Assignment
AI Summary
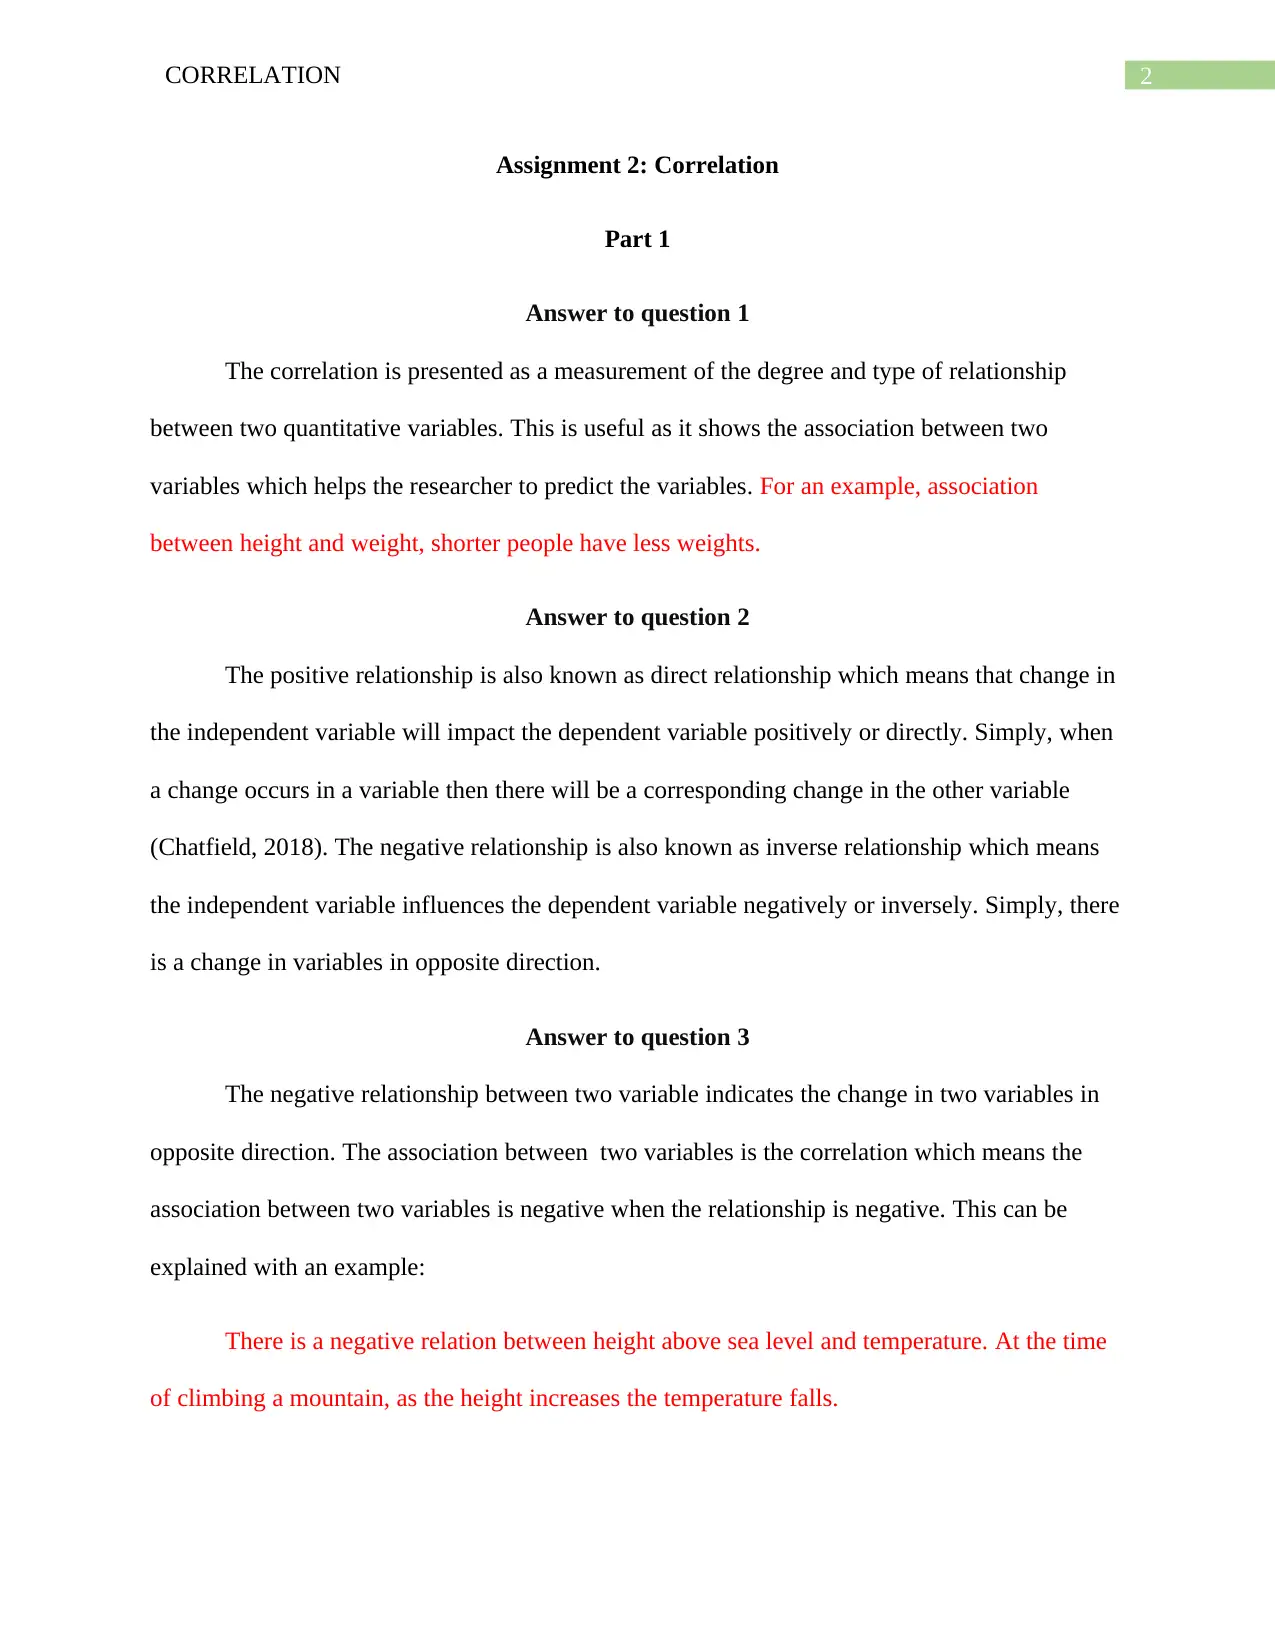
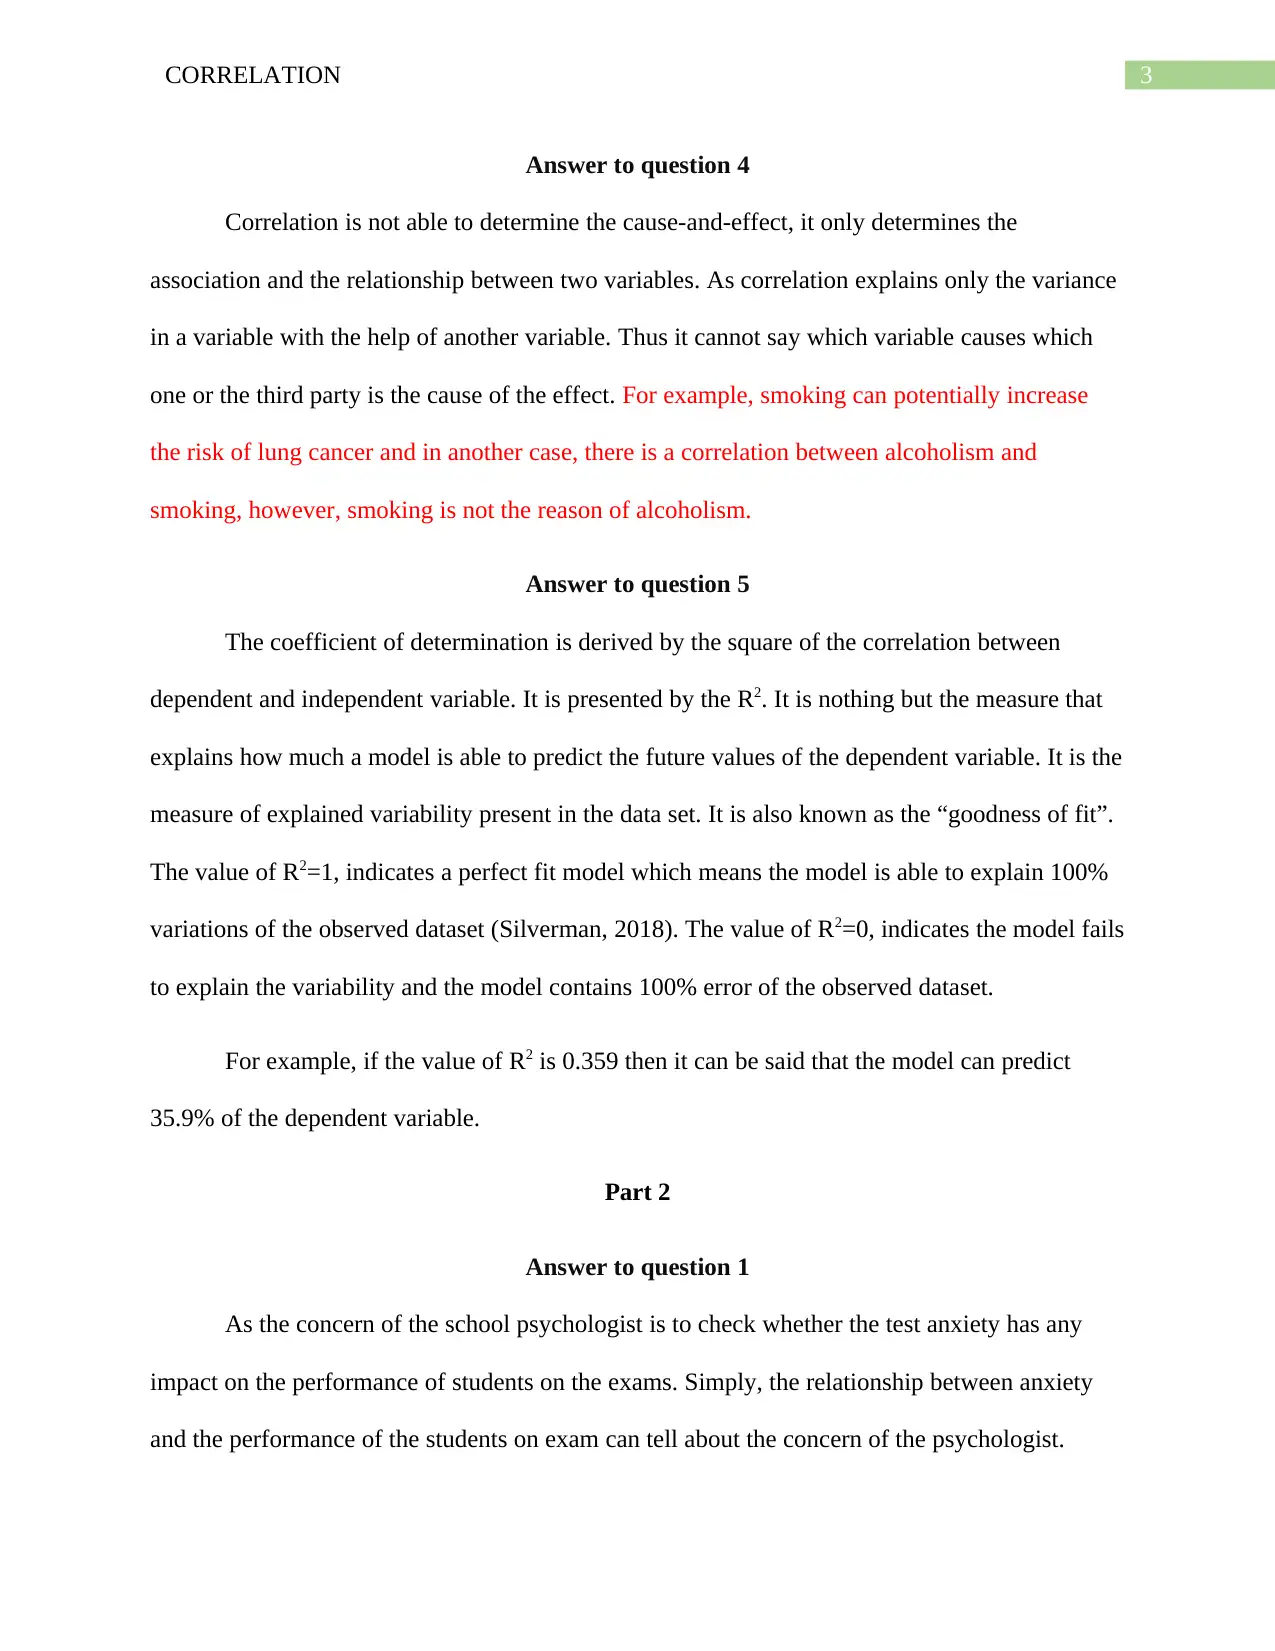
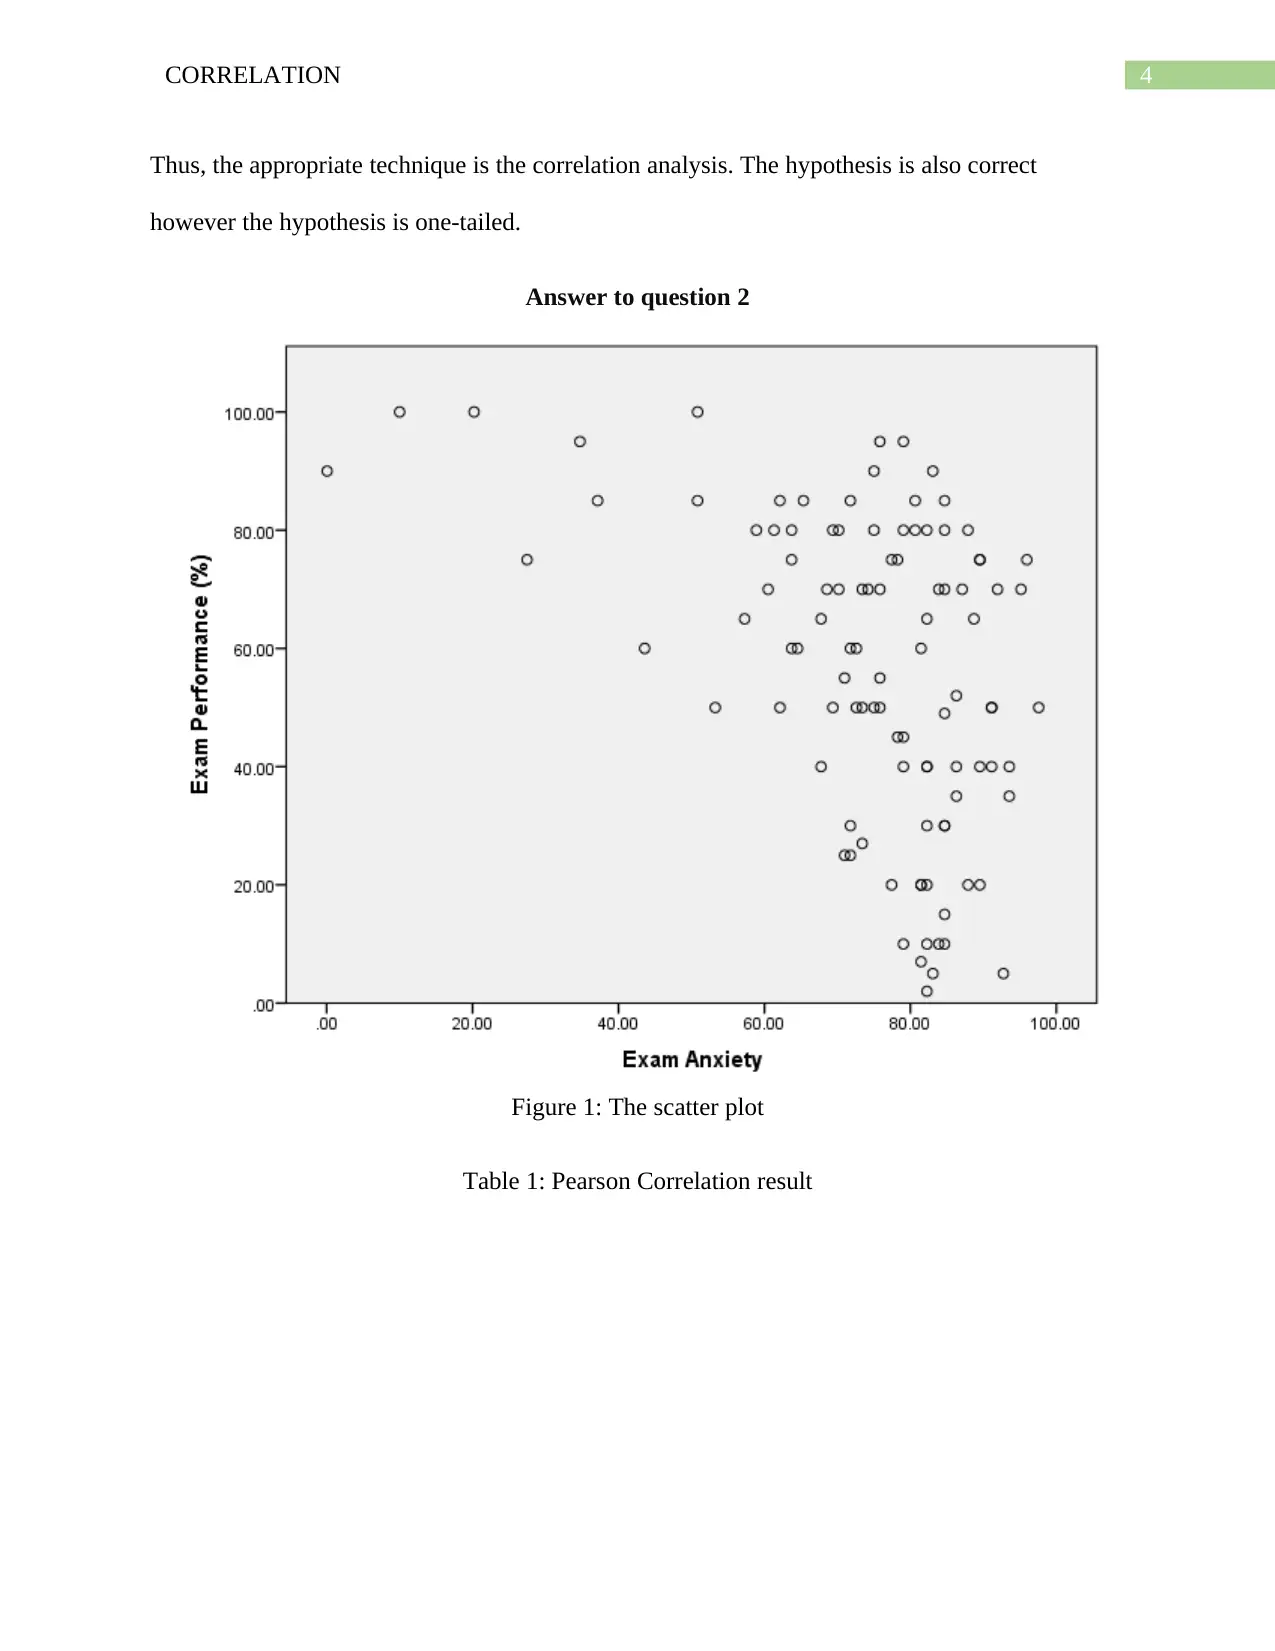
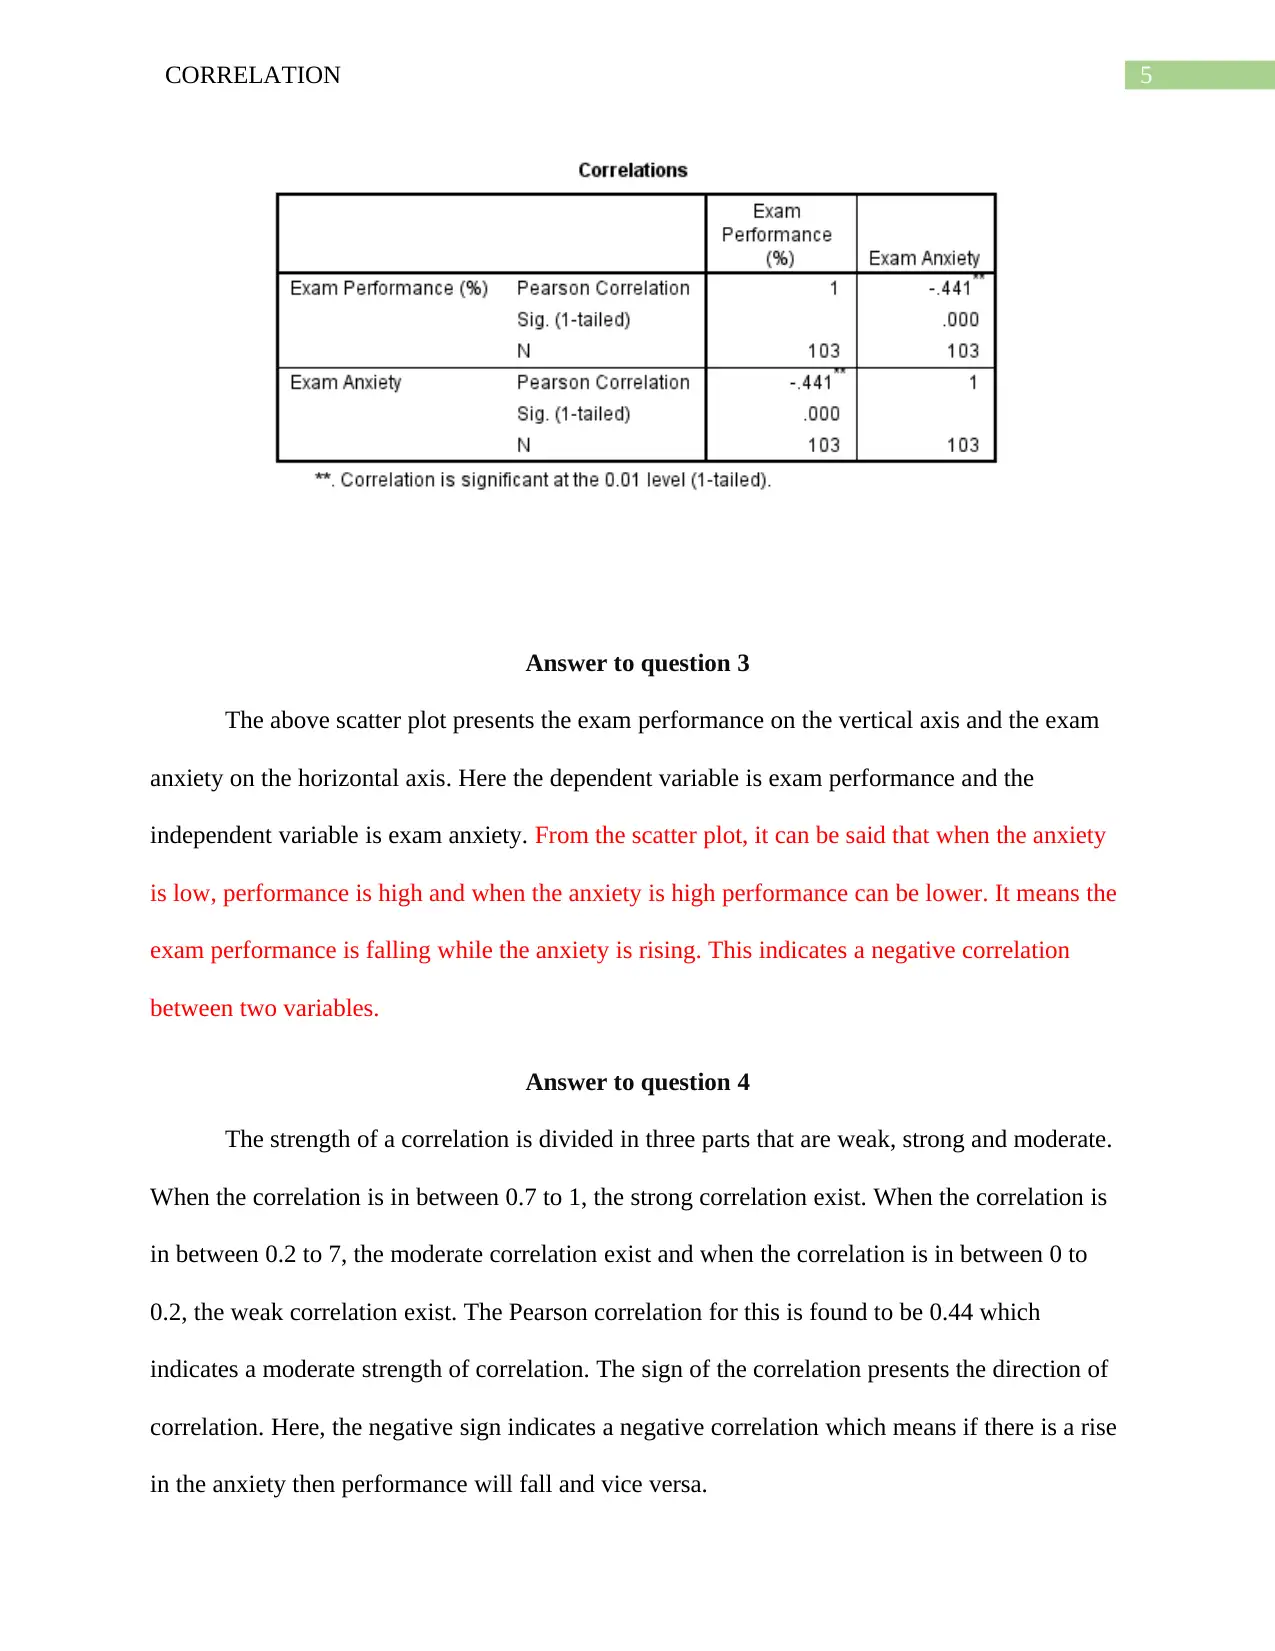
This assignment delves into the concept of correlation, exploring its definition as a measure of the degree and type of relationship between two quantitative variables. It differentiates between positive and negative correlations, providing examples to illustrate their meanings. The assignment also covers the coefficient of determination (R2) and its role in explaining the variability in a dataset. The student analyzes a research scenario, applying correlation analysis to assess the relationship between test anxiety and exam performance, including interpreting a scatter plot and Pearson correlation results. The assignment also discusses the strength and direction of correlations, and distinguishes between correlation and causation. Finally, the assignment explains strong and weak positive and negative correlations with examples, and the value of correlation coefficients. The student provides definitions, interpretations, and practical applications of correlation in statistical analysis.
Document Page
Running head: CORRELATION
Correlation
Name of the Student
Name of the University
Course ID
tabler-icon-diamond-filled.svg

Paraphrase This Document

Need a fresh take? Get an instant paraphrase of this document with our AI Paraphraser
Document Page
1CORRELATION
Table of Contents
Assignment 2: Correlation...............................................................................................................2
Part 1............................................................................................................................................2
Answer to question 1...............................................................................................................2
Answer to question 2...............................................................................................................2
Answer to question 3...............................................................................................................2
Answer to question 4...............................................................................................................3
Answer to question 5...............................................................................................................3
Part 2............................................................................................................................................3
Answer to question 1...............................................................................................................3
Answer to question 2...............................................................................................................4
Answer to question 3...............................................................................................................5
Answer to question 4...............................................................................................................5
Answer to question 5...............................................................................................................5
Answer to question 6...............................................................................................................6
Part 3............................................................................................................................................6
Reference.........................................................................................................................................8
Document Page
2CORRELATION
Assignment 2: Correlation
Part 1
Answer to question 1
The correlation is presented as a measurement of the degree and type of relationship
between two quantitative variables. This is useful as it shows the association between two
variables which helps the researcher to predict the variables. For an example, association
between height and weight, shorter people have less weights.
Answer to question 2
The positive relationship is also known as direct relationship which means that change in
the independent variable will impact the dependent variable positively or directly. Simply, when
a change occurs in a variable then there will be a corresponding change in the other variable
(Chatfield, 2018). The negative relationship is also known as inverse relationship which means
the independent variable influences the dependent variable negatively or inversely. Simply, there
is a change in variables in opposite direction.
Answer to question 3
The negative relationship between two variable indicates the change in two variables in
opposite direction. The association between two variables is the correlation which means the
association between two variables is negative when the relationship is negative. This can be
explained with an example:
There is a negative relation between height above sea level and temperature. At the time
of climbing a mountain, as the height increases the temperature falls.
Document Page
3CORRELATION
Answer to question 4
Correlation is not able to determine the cause-and-effect, it only determines the
association and the relationship between two variables. As correlation explains only the variance
in a variable with the help of another variable. Thus it cannot say which variable causes which
one or the third party is the cause of the effect. For example, smoking can potentially increase
the risk of lung cancer and in another case, there is a correlation between alcoholism and
smoking, however, smoking is not the reason of alcoholism.
Answer to question 5
The coefficient of determination is derived by the square of the correlation between
dependent and independent variable. It is presented by the R2. It is nothing but the measure that
explains how much a model is able to predict the future values of the dependent variable. It is the
measure of explained variability present in the data set. It is also known as the “goodness of fit”.
The value of R2=1, indicates a perfect fit model which means the model is able to explain 100%
variations of the observed dataset (Silverman, 2018). The value of R2=0, indicates the model fails
to explain the variability and the model contains 100% error of the observed dataset.
For example, if the value of R2 is 0.359 then it can be said that the model can predict
35.9% of the dependent variable.
Part 2
Answer to question 1
As the concern of the school psychologist is to check whether the test anxiety has any
impact on the performance of students on the exams. Simply, the relationship between anxiety
and the performance of the students on exam can tell about the concern of the psychologist.
tabler-icon-diamond-filled.svg

Paraphrase This Document

Need a fresh take? Get an instant paraphrase of this document with our AI Paraphraser
Document Page
4CORRELATION
Thus, the appropriate technique is the correlation analysis. The hypothesis is also correct
however the hypothesis is one-tailed.
Answer to question 2
Figure 1: The scatter plot
Table 1: Pearson Correlation result
Document Page
5CORRELATION
Answer to question 3
The above scatter plot presents the exam performance on the vertical axis and the exam
anxiety on the horizontal axis. Here the dependent variable is exam performance and the
independent variable is exam anxiety. From the scatter plot, it can be said that when the anxiety
is low, performance is high and when the anxiety is high performance can be lower. It means the
exam performance is falling while the anxiety is rising. This indicates a negative correlation
between two variables.
Answer to question 4
The strength of a correlation is divided in three parts that are weak, strong and moderate.
When the correlation is in between 0.7 to 1, the strong correlation exist. When the correlation is
in between 0.2 to 7, the moderate correlation exist and when the correlation is in between 0 to
0.2, the weak correlation exist. The Pearson correlation for this is found to be 0.44 which
indicates a moderate strength of correlation. The sign of the correlation presents the direction of
correlation. Here, the negative sign indicates a negative correlation which means if there is a rise
in the anxiety then performance will fall and vice versa.
Document Page
6CORRELATION
Answer to question 5
The above analysis shows the relationship which tells the story about the size and change
in two or more variables. The correlation does not imply the change in a variable is the cause of
change in the other variable. There is a concept of causation which implies that one event is the
cause of occurrence of the other (. The correlation and causation are two different concepts.
Answer to question 6
The table 1 shows the correlation between performance on exam and anxiety. The
Pearson correlation is -0.44 which indicates that there is a negative moderate correlation between
those variables. Now, the p-value for the correlation is 0.00 which indicates that this is
statistically significant at 5% significance level. The school psychologist now can conclude with
strong statistical evidences that the performance will fall is there is a rise in anxiety.
Part 3
The value of correlation coefficient lies between -1 and +1. The correlation is positive
when the correlation coefficient is greater than 0. The correlation is said to be stronger when the
absolute value of correlation coefficient is close to 1 and the correlation is said to be weaker
when the absolute value of correlation coefficient is close to 0.
Strong Positive Correlation means the actual value of correlation coefficient is close to
+1. For example, the correlation between variable A and B is 0.86. Here, the correlation value is
enough high and close to +1. This indicates the strong correlation between A and B. This implies
that there is a change in A for which there exist a corresponding positive change in B. Now, if
the correlation between C and D is 0.96. This implies the strong correlation between C and D
(Fishkind et al., 2019). Moreover, there correlation between C and D is stronger than the
tabler-icon-diamond-filled.svg

Paraphrase This Document

Need a fresh take? Get an instant paraphrase of this document with our AI Paraphraser
Document Page
7CORRELATION
correlation between A and B as the correlation coefficient for C and D is greater than the
correlation coefficient for A and B.
Weak Positive Correlation means the actual value of correlation coefficient is close to 0.
For example, the correlation between variable E and F is 0.06. Here, the value is very low and
close to 0. This specifies the weak correlation between E and F. This suggests that there is a
change in A for which there exist a corresponding very small positive change in F.
Strong Negative Correlation means the actual value of correlation coefficient is close to
-1. Say, the correlation coefficient between variable G and H is -0.975. Here, the correlation
value is very close to -1. This indicates the strong negative correlation between G and H. This
implies that there is a change in G for which there exist a corresponding large amount of
negative change in H.
Weak Negative Correlation means the actual value of correlation coefficient is close to 0.
For example, the correlation between variable I and J is -0.18. Here, the value is very low. This
postulates the weak correlation between I and J. This means that there is a change in A for which
there is a very small in J in the opposite direction.
Document Page
8CORRELATION
Reference and Bibliography
Altman, N., & Krzywinski, M. (2015). Points of Significance: Association, correlation and
causation.
Chatfield, C. (2018). Statistics for technology: a course in applied statistics. Routledge.
Cronk, B. C. (2017). How to use SPSS®: A step-by-step guide to analysis and interpretation.
Routledge.
Fieremans, E., Burcaw, L. M., Lee, H. H., Lemberskiy, G., Veraart, J., & Novikov, D. S. (2016).
In vivo observation and biophysical interpretation of time-dependent diffusion in human
white matter. NeuroImage, 129, 414-427.
Fishkind, D. E., Meng, L., Sun, A., Priebe, C. E., & Lyzinski, V. (2019). Alignment strength and
correlation for graphs. Pattern Recognition Letters, 125, 295-302.
Holcomb, Z. C. (2016). Fundamentals of descriptive statistics. Routledge.
Pers, T. H., Karjalainen, J. M., Chan, Y., Westra, H. J., Wood, A. R., Yang, J., ... & Frayling, T.
(2015). Biological interpretation of genome-wide association studies using predicted gene
functions. Nature communications, 6, 5890.
Pyrczak, F. (2016). Success at statistics: A worktext with humor. Routledge.
Radue, E. W., Barkhof, F., Kappos, L., Sprenger, T., Häring, D. A., de Vera, A., ... & Cohen, J.
A. (2015). Correlation between brain volume loss and clinical and MRI outcomes in
multiple sclerosis. Neurology, 84(8), 784-793.
Schober, P., Boer, C., & Schwarte, L. A. (2018). Correlation coefficients: appropriate use and
interpretation. Anesthesia & Analgesia, 126(5), 1763-1768.
Document Page
9CORRELATION
Silverman, B. W. (2018). Density estimation for statistics and data analysis. Routledge.
Wiedermann, W., & Hagmann, M. (2016). Asymmetric properties of the Pearson correlation
coefficient: Correlation as the negative association between linear regression residuals.
Communications in Statistics-Theory and Methods, 45(21), 6263-6283.
chevron_up_icon
1 out of 10
circle_padding
hide_on_mobile
zoom_out_icon
[object Object]