Correlation Project: Income, Expenditure, and Regression Analysis

Verified

Added on  2023/05/29

|4
|538
|377
Project
AI Summary
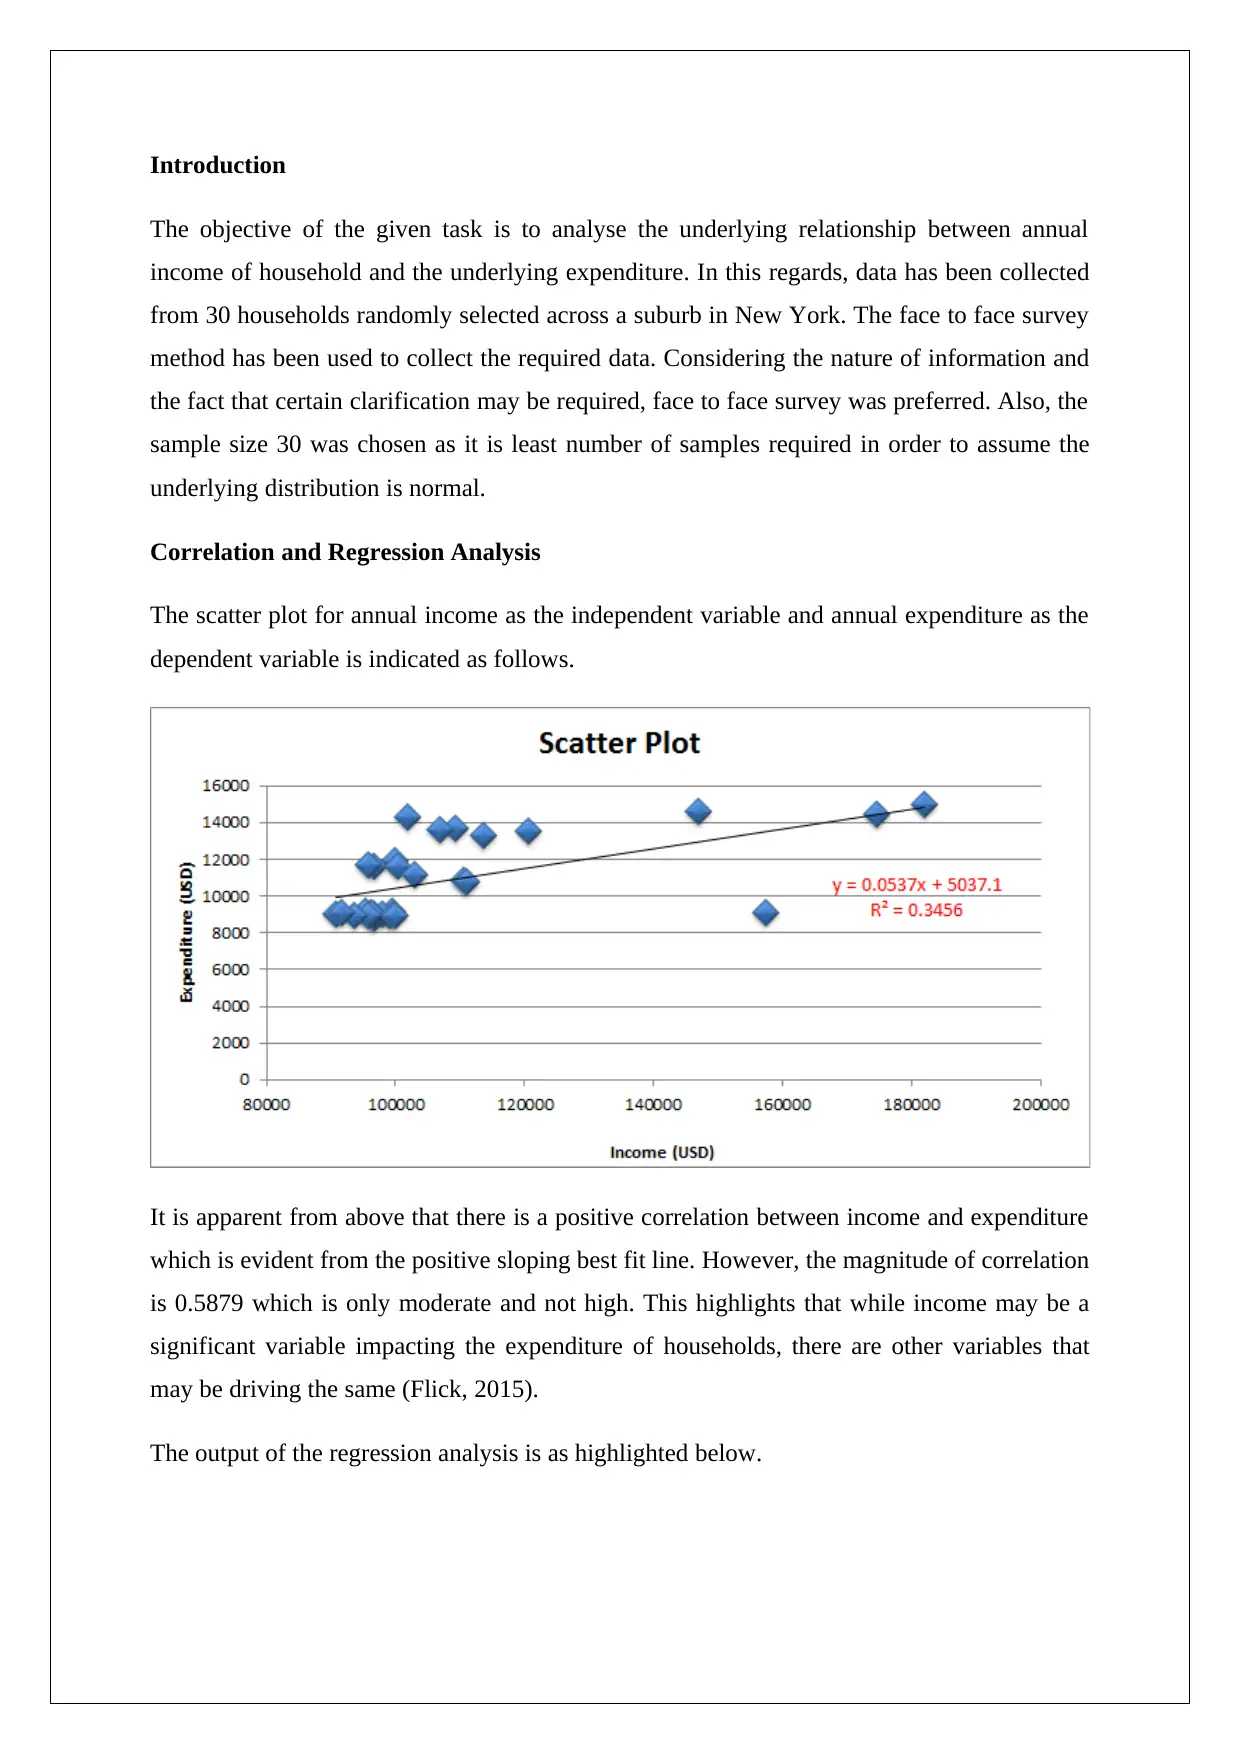
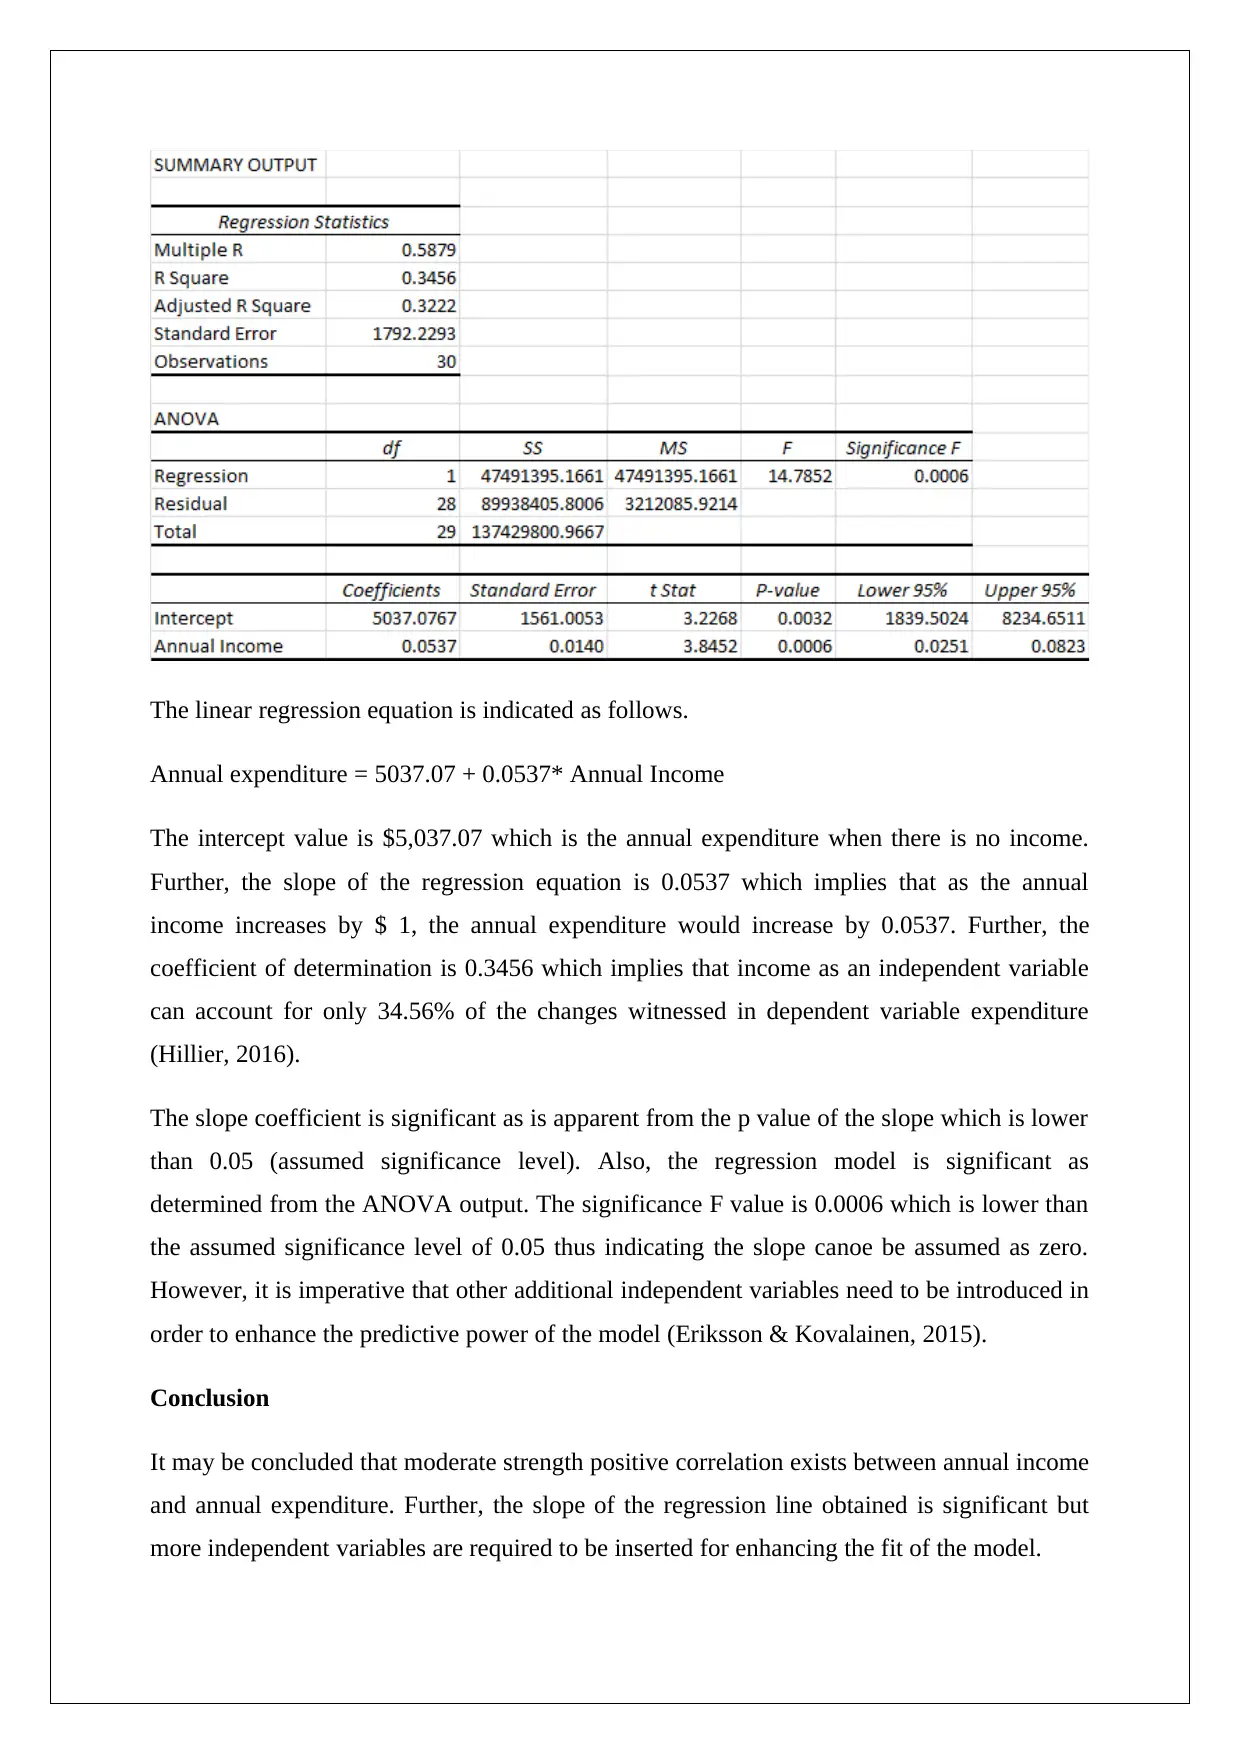
This project investigates the correlation between annual household income and expenditure using data collected from a random sample of 30 households in a New York suburb. Face-to-face surveys were employed for data collection, and correlation and regression analyses were performed. The results indicate a moderate positive correlation (0.5879) between income and expenditure, with the regression equation showing that annual expenditure increases by $0.0537 for every $1 increase in annual income. However, income only accounts for 34.56% of the variance in expenditure, suggesting other factors influence household spending. The regression model is statistically significant, but the project concludes that additional independent variables are needed to improve its predictive power. Desklib provides access to similar projects and study resources for students.
Document Page
CORRELATION PROJECT
STUDENT ID:
[Pick the date]
tabler-icon-diamond-filled.svg

Paraphrase This Document

Need a fresh take? Get an instant paraphrase of this document with our AI Paraphraser
Document Page
Introduction
The objective of the given task is to analyse the underlying relationship between annual
income of household and the underlying expenditure. In this regards, data has been collected
from 30 households randomly selected across a suburb in New York. The face to face survey
method has been used to collect the required data. Considering the nature of information and
the fact that certain clarification may be required, face to face survey was preferred. Also, the
sample size 30 was chosen as it is least number of samples required in order to assume the
underlying distribution is normal.
Correlation and Regression Analysis
The scatter plot for annual income as the independent variable and annual expenditure as the
dependent variable is indicated as follows.
It is apparent from above that there is a positive correlation between income and expenditure
which is evident from the positive sloping best fit line. However, the magnitude of correlation
is 0.5879 which is only moderate and not high. This highlights that while income may be a
significant variable impacting the expenditure of households, there are other variables that
may be driving the same (Flick, 2015).
The output of the regression analysis is as highlighted below.
Document Page
The linear regression equation is indicated as follows.
Annual expenditure = 5037.07 + 0.0537* Annual Income
The intercept value is $5,037.07 which is the annual expenditure when there is no income.
Further, the slope of the regression equation is 0.0537 which implies that as the annual
income increases by $ 1, the annual expenditure would increase by 0.0537. Further, the
coefficient of determination is 0.3456 which implies that income as an independent variable
can account for only 34.56% of the changes witnessed in dependent variable expenditure
(Hillier, 2016).
The slope coefficient is significant as is apparent from the p value of the slope which is lower
than 0.05 (assumed significance level). Also, the regression model is significant as
determined from the ANOVA output. The significance F value is 0.0006 which is lower than
the assumed significance level of 0.05 thus indicating the slope canoe be assumed as zero.
However, it is imperative that other additional independent variables need to be introduced in
order to enhance the predictive power of the model (Eriksson & Kovalainen, 2015).
Conclusion
It may be concluded that moderate strength positive correlation exists between annual income
and annual expenditure. Further, the slope of the regression line obtained is significant but
more independent variables are required to be inserted for enhancing the fit of the model.
Document Page
References
Eriksson, P. & Kovalainen, A. (2015). Quantitative methods in business research London:
Sage Publications.
Flick, U. (2015). Introducing research methodology: A beginner's guide to doing a research
project New York: Sage Publications.
Hillier, F. (2016). Introduction to Operations Research.New York: McGraw Hill Publications
chevron_up_icon
1 out of 4
circle_padding
hide_on_mobile
zoom_out_icon
[object Object]