Analyzing Big Data: Correlation, Regression & Time Series Methods
VerifiedAdded on 2023/06/10
|18
|3287
|384
Presentation
AI Summary
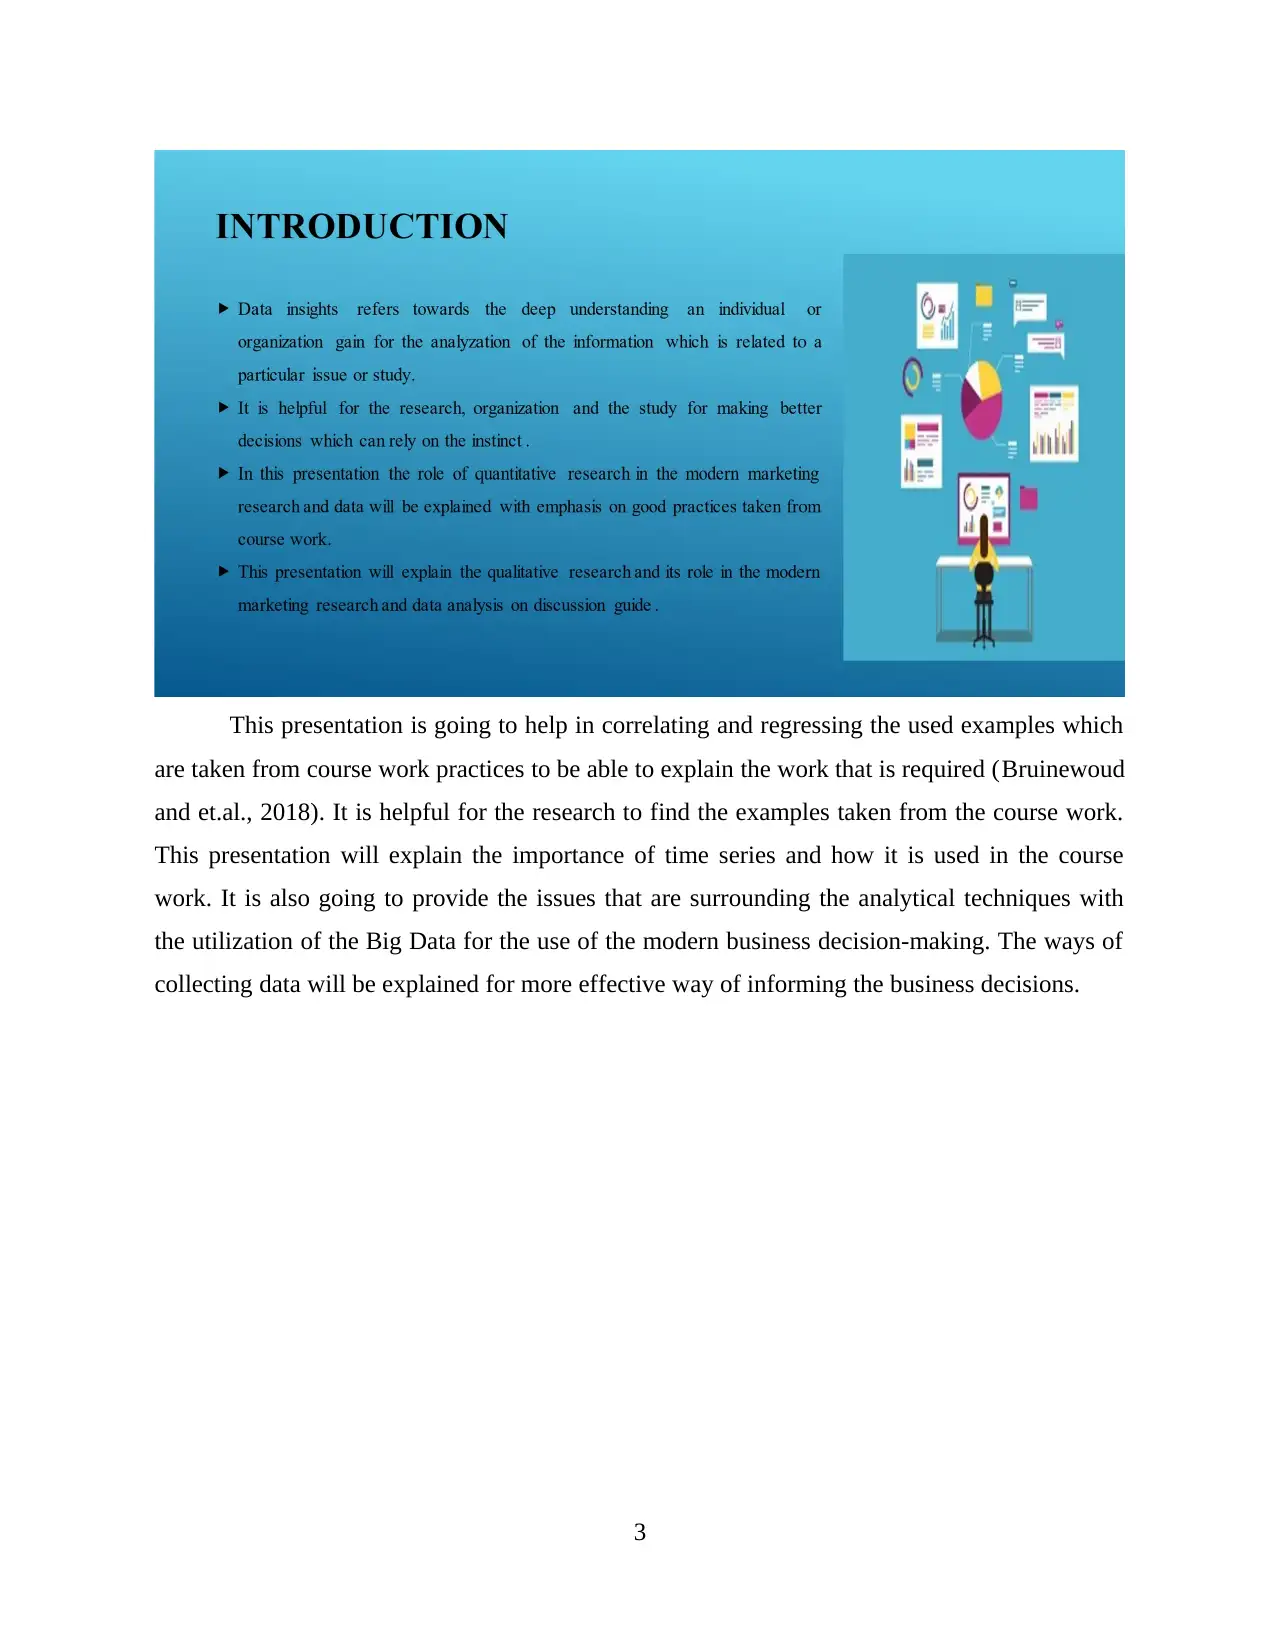
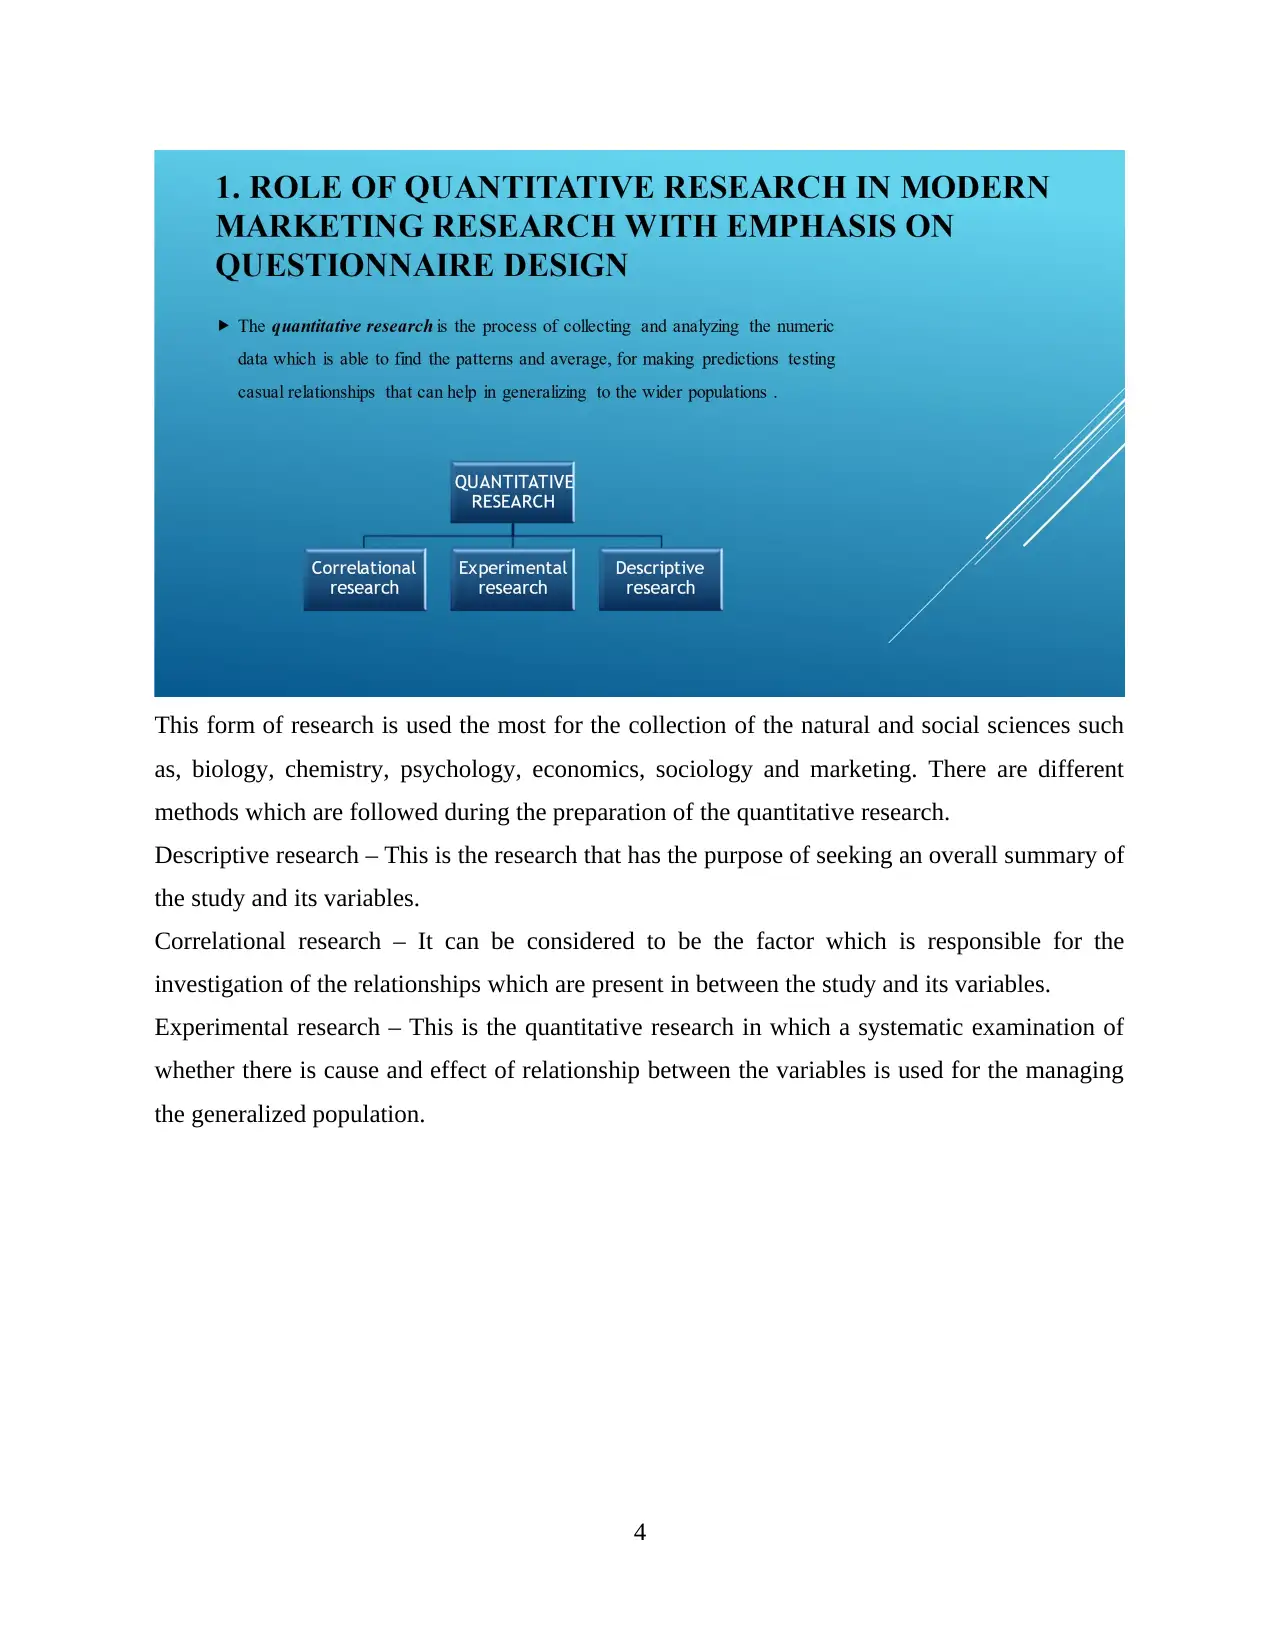
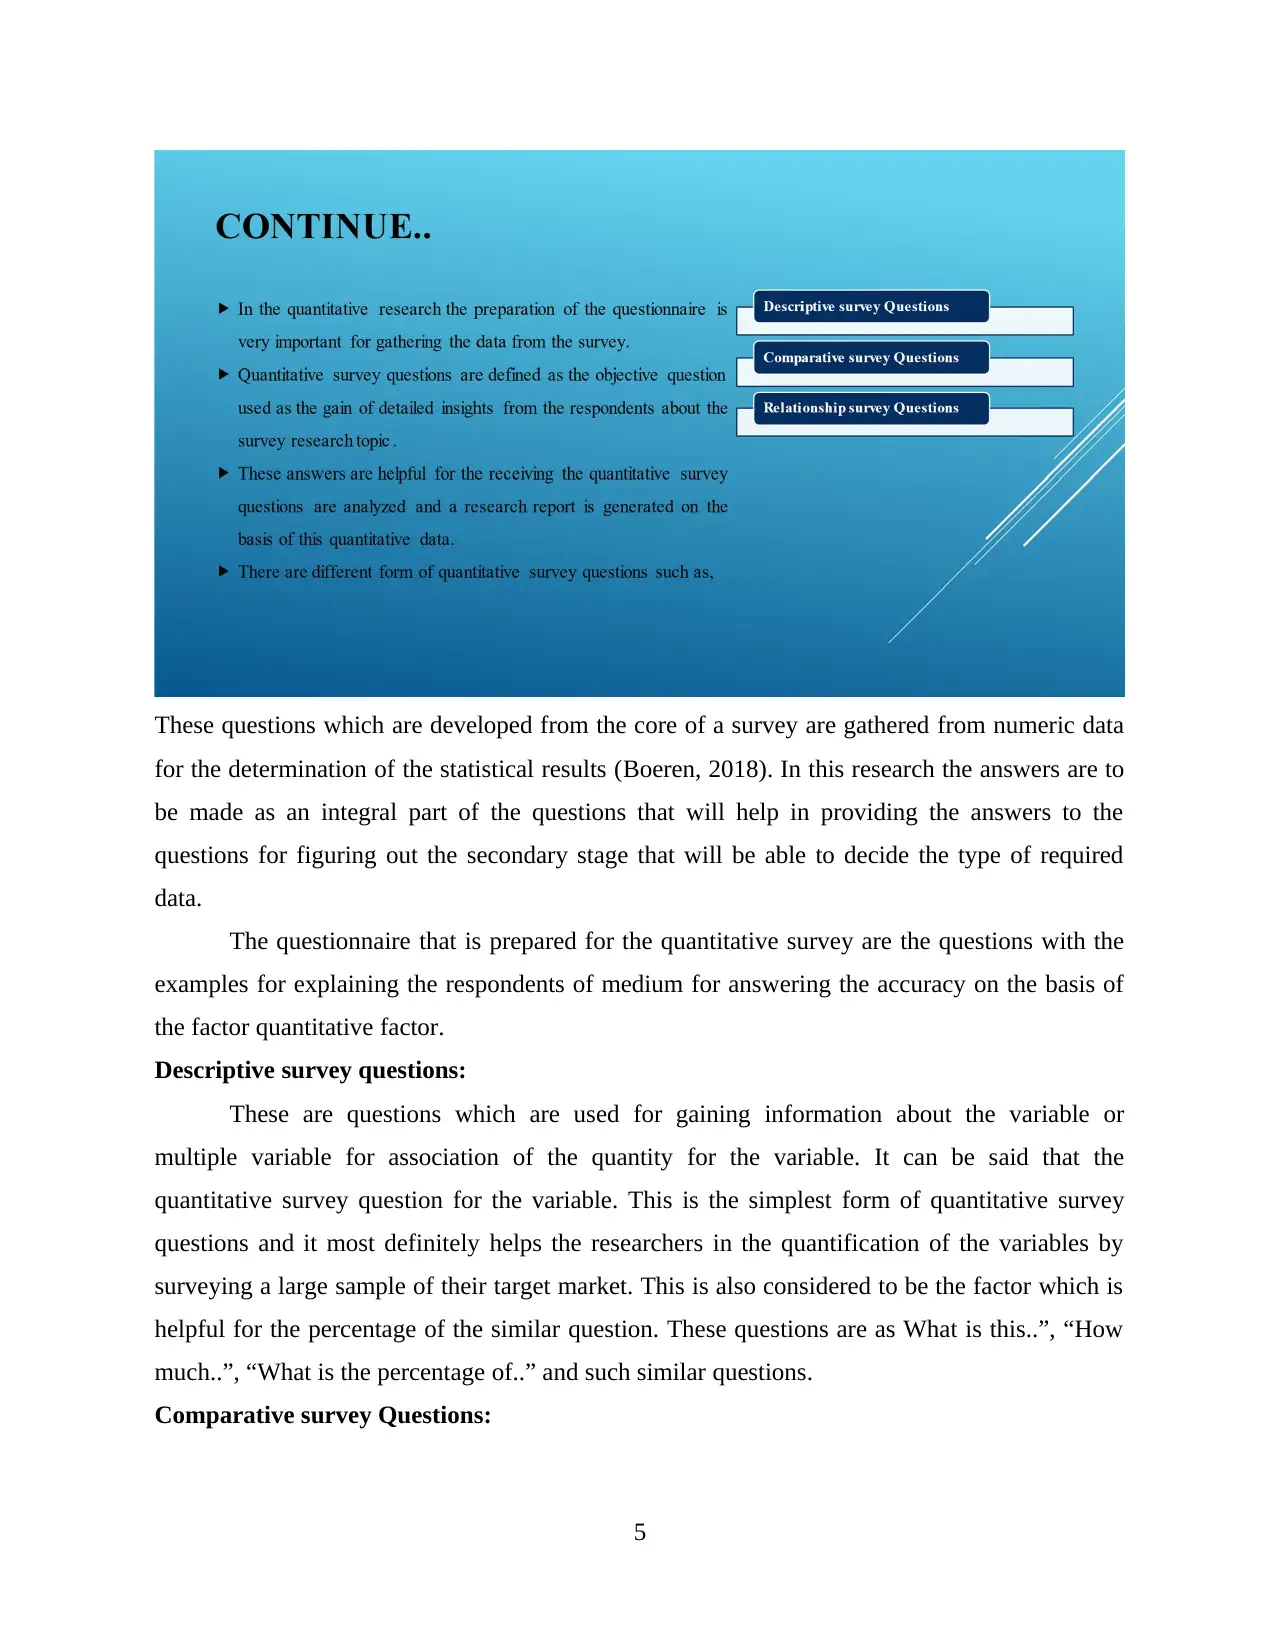
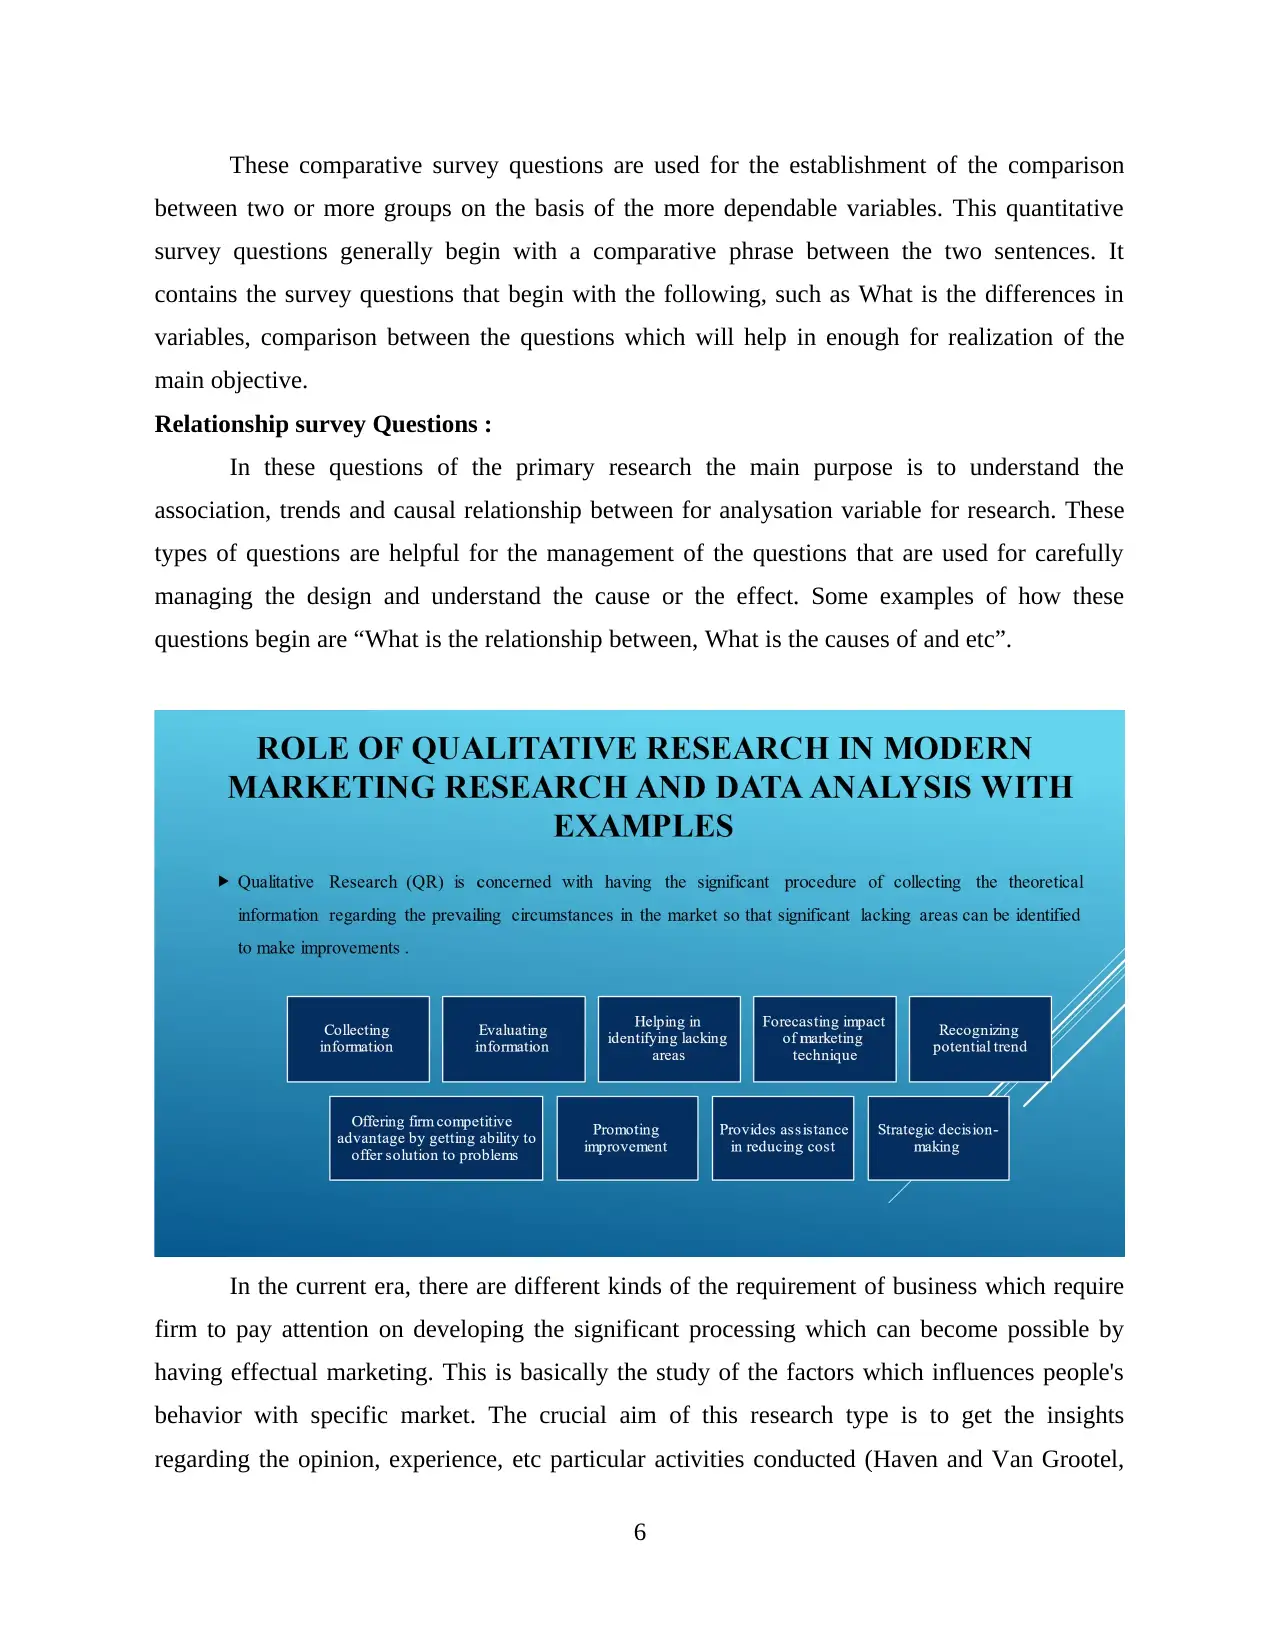
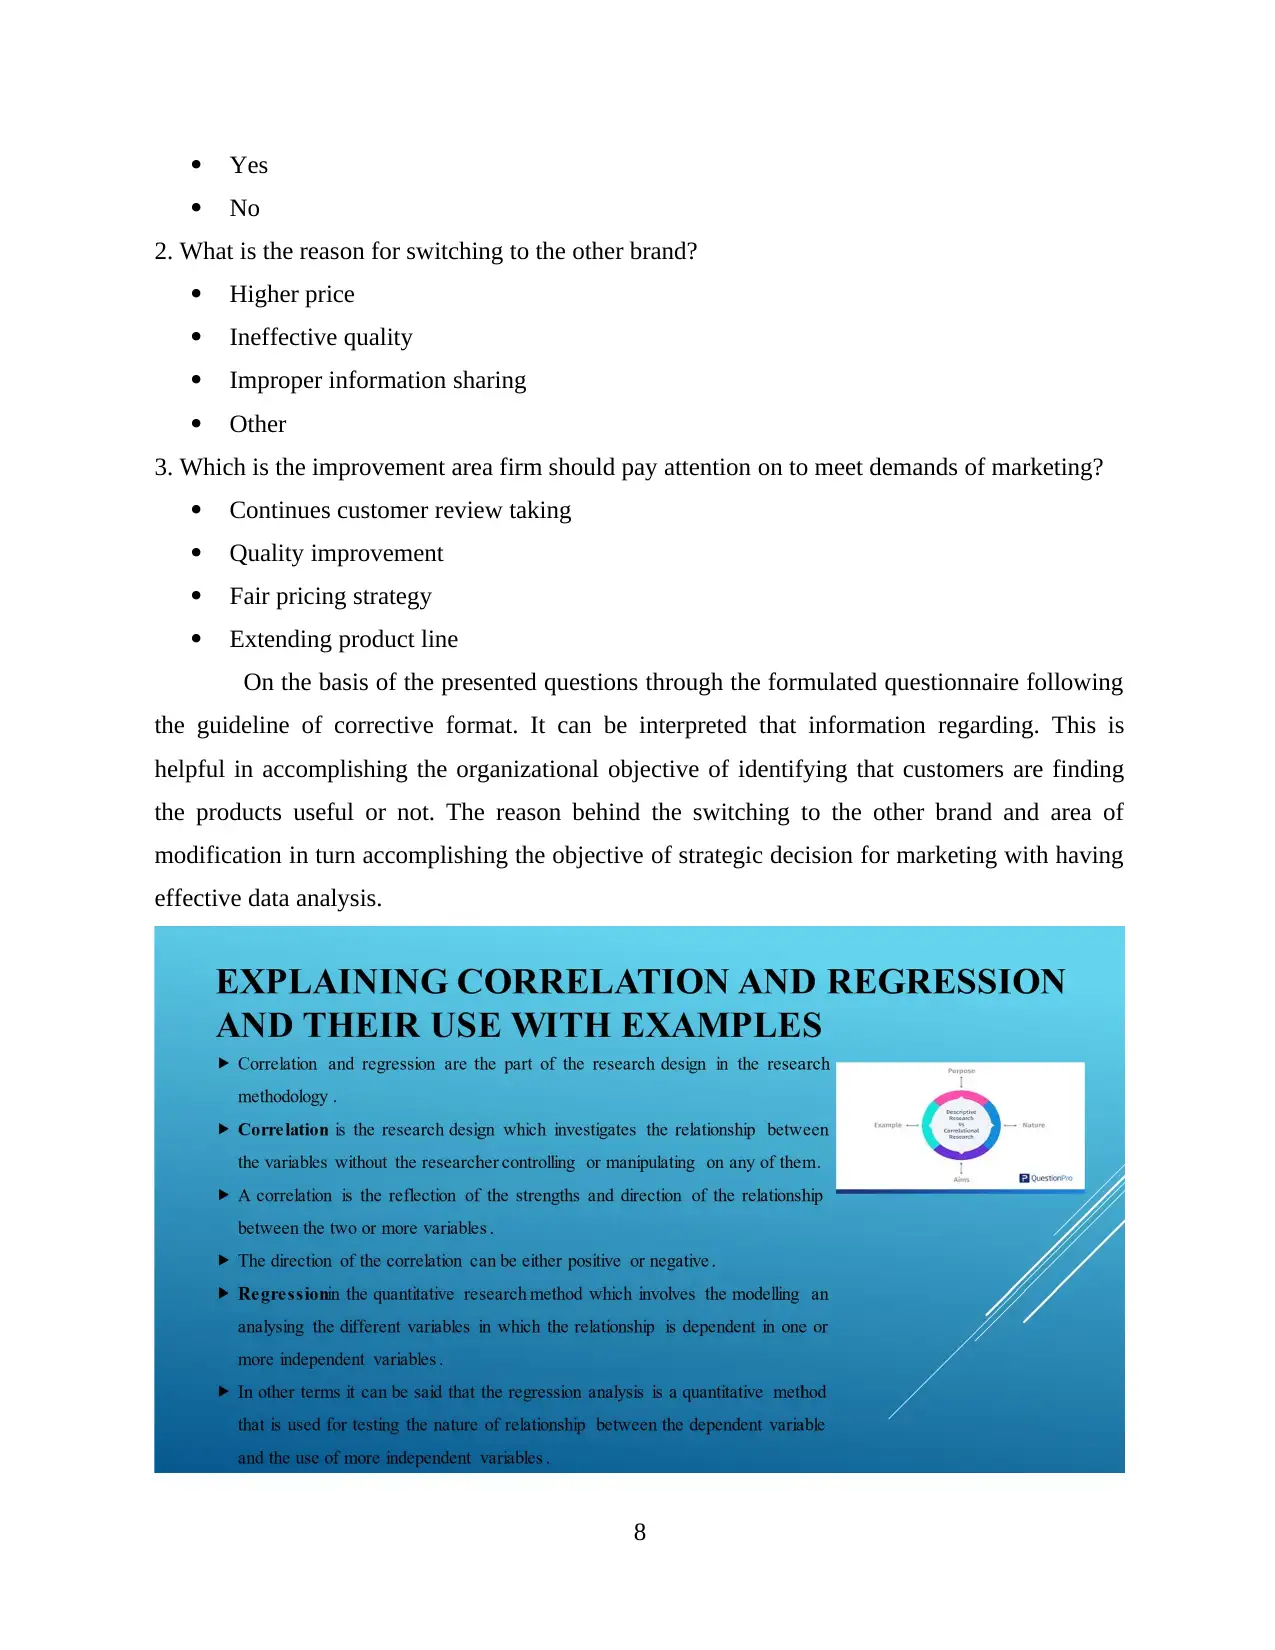
This presentation explores correlation, regression, and time series analysis techniques within the context of big data and their applications in modern business decision-making. It discusses quantitative research methods, including descriptive, correlational, and experimental research, and emphasizes the importance of survey questions in gathering numeric data. The presentation covers positive, negative, and zero correlations, highlighting the use of correlation research in market analysis. It also details time series analysis, including data point indexing and methods for visualizing and predicting future trends. Furthermore, the presentation addresses issues surrounding analytical techniques and the utilization of big data, emphasizing the importance of data analysis in modern marketing practices. The use of qualitative research is explored as well with examples. The presentation concludes by underscoring the pitfalls that can influence processing, offering irrelevant outcomes, and hampering the decision-making process in marketing.

1
Paraphrase This Document
Need a fresh take? Get an instant paraphrase of this document with our AI Paraphraser

2

This presentation is going to help in correlating and regressing the used examples which
are taken from course work practices to be able to explain the work that is required (Bruinewoud
and et.al., 2018). It is helpful for the research to find the examples taken from the course work.
This presentation will explain the importance of time series and how it is used in the course
work. It is also going to provide the issues that are surrounding the analytical techniques with
the utilization of the Big Data for the use of the modern business decision-making. The ways of
collecting data will be explained for more effective way of informing the business decisions.
3
⊘ This is a preview!⊘
Do you want full access?
Subscribe today to unlock all pages.

Trusted by 1+ million students worldwide

This form of research is used the most for the collection of the natural and social sciences such
as, biology, chemistry, psychology, economics, sociology and marketing. There are different
methods which are followed during the preparation of the quantitative research.
Descriptive research – This is the research that has the purpose of seeking an overall summary of
the study and its variables.
Correlational research – It can be considered to be the factor which is responsible for the
investigation of the relationships which are present in between the study and its variables.
Experimental research – This is the quantitative research in which a systematic examination of
whether there is cause and effect of relationship between the variables is used for the managing
the generalized population.
4
Paraphrase This Document
Need a fresh take? Get an instant paraphrase of this document with our AI Paraphraser

These questions which are developed from the core of a survey are gathered from numeric data
for the determination of the statistical results (Boeren, 2018). In this research the answers are to
be made as an integral part of the questions that will help in providing the answers to the
questions for figuring out the secondary stage that will be able to decide the type of required
data.
The questionnaire that is prepared for the quantitative survey are the questions with the
examples for explaining the respondents of medium for answering the accuracy on the basis of
the factor quantitative factor.
Descriptive survey questions:
These are questions which are used for gaining information about the variable or
multiple variable for association of the quantity for the variable. It can be said that the
quantitative survey question for the variable. This is the simplest form of quantitative survey
questions and it most definitely helps the researchers in the quantification of the variables by
surveying a large sample of their target market. This is also considered to be the factor which is
helpful for the percentage of the similar question. These questions are as What is this..”, “How
much..”, “What is the percentage of..” and such similar questions.
Comparative survey Questions:
5

These comparative survey questions are used for the establishment of the comparison
between two or more groups on the basis of the more dependable variables. This quantitative
survey questions generally begin with a comparative phrase between the two sentences. It
contains the survey questions that begin with the following, such as What is the differences in
variables, comparison between the questions which will help in enough for realization of the
main objective.
Relationship survey Questions :
In these questions of the primary research the main purpose is to understand the
association, trends and causal relationship between for analysation variable for research. These
types of questions are helpful for the management of the questions that are used for carefully
managing the design and understand the cause or the effect. Some examples of how these
questions begin are “What is the relationship between, What is the causes of and etc”.
In the current era, there are different kinds of the requirement of business which require
firm to pay attention on developing the significant processing which can become possible by
having effectual marketing. This is basically the study of the factors which influences people's
behavior with specific market. The crucial aim of this research type is to get the insights
regarding the opinion, experience, etc particular activities conducted (Haven and Van Grootel,
6
⊘ This is a preview!⊘
Do you want full access?
Subscribe today to unlock all pages.

Trusted by 1+ million students worldwide

2019). Qualitative research allows the firm to get the opportunity to ask targeted audience in
organized format via survey so that data related with prevailing challenges can be identified.
This offers the ability to make improvement in its strategy of marketing so that greater level of
capability to attract customers can become possible. In the modern marketing practices, QR is
taken into the procedure by the organization which involves clarifying message of promotion,
recognizing needs of customers, etc. that provides assistance in gaining competitiveness to
accomplish organizational objectives.
Data analysis is related with having the ability to evaluate, transforming and modelling
data with goal of discovering useful information in turn significant decision-making can become
possible. Data analysis with help of the qualitative research become sable o get the appropriate
information regarding the existing situation in turn accomplishing the organizational objective of
identifying the taste & preferences of customer (Johnson, Adkins and Chauvin, 2020). Data
analysis can be done by using distinct type of the technique which is useful for both internal &
external aspects in turn meeting the crucial insights that can show direction of growth &
development.
QR play distinct type of the role in marketing 7 data analysis that includes having
significant evaluation in the depth manner so that important aspects for decision-making can be
identified to get the competitiveness. This leads the firm to achieve higher ability to promote
ability to coordinate with changes. Data analysis with help of the qualitative research gaining the
reliable capability to reduce cost in turn attaining greater performance to build good brand image
in market can become possible. On the basis of this, it can be stated that there are different types
of the role which are played by the qualitative research in modern marketing & data analysis.
For designing the guide which can be followed respect to collect the information in
qualitative manner which involves defining the goals & objective ensuring the suitable
sampling, deciding length of questions, having appropriate spreading among targeted audience
(Aspers and Corte, 2019). QR can be done via questionnaire, interview, focus group discussion.
In the current research questionnaire will be spread among the customers to understand the
effectiveness of the conducted marketing practices. The questions presented can help in
achieving the reliable qualitative information through studying the opinion & experience of
customer of particular company.
1. Is the offered products is helpful in accomplishing your needs?
7
Paraphrase This Document
Need a fresh take? Get an instant paraphrase of this document with our AI Paraphraser

Yes
No
2. What is the reason for switching to the other brand?
Higher price
Ineffective quality
Improper information sharing
Other
3. Which is the improvement area firm should pay attention on to meet demands of marketing?
Continues customer review taking
Quality improvement
Fair pricing strategy
Extending product line
On the basis of the presented questions through the formulated questionnaire following
the guideline of corrective format. It can be interpreted that information regarding. This is
helpful in accomplishing the organizational objective of identifying that customers are finding
the products useful or not. The reason behind the switching to the other brand and area of
modification in turn accomplishing the objective of strategic decision for marketing with having
effective data analysis.
8

Positive Correlation
In this types of correlation both the variables are able to change in the same direction.
Negative Correlation
This is the correlation in which the relationship between the information derived in the
Opposite direction
Zero Correlation
There is no relationship between the variables which are considered to be very effective
in the management of the studies.
The use of correlation research is idea when the gathering of data is quickly from natural
settings in order to generalize the findings related to the real life situations. This is also the factor
which is helpful for the generalization of the findings for the real life situations in an externally
valid way (Aithal, and Aithal,2020). In these situations the correlation of the research can be
used with an appropriate choice,
To investigate non causal relationship- It is considered to be the association between the two
variables which is expected to be able to find a new casual relationship between the two or more
variables.
To explore casual relationship between variables- In order to explore the casual relationship
between the two variables such form of research is undertaken.
To explore the relationships between variables- This is considered to be the factor which is
responsible for impractical unethical for too costly for conducting experimental research that is
able to manipulate the variables.
The common application of this research for the market research is for understanding the
likelihood for the recommendation of the impacts that can be changed in the waiting time, price,
quantity purchased and other factor which would influence the independence of the variables.
9
⊘ This is a preview!⊘
Do you want full access?
Subscribe today to unlock all pages.

Trusted by 1+ million students worldwide

The particular time series is concerned with having series of data points indexed in order
of time. It can be exerted in to the two manner such as having the measurements gathered at the
regular time interval that are referred as metrics. In addition to this, the other type is related with
having measurements collected at irregular time intervals that is concerned with events. This
10
of time. It can be exerted in to the two manner such as having the measurements gathered at the
regular time interval that are referred as metrics. In addition to this, the other type is related with
having measurements collected at irregular time intervals that is concerned with events. This
10
Paraphrase This Document
Need a fresh take? Get an instant paraphrase of this document with our AI Paraphraser

provides assistance in gaining the ability to extract meaning of the collected and presented data
in turn predicting the future values based on the previous pattern can become possible.
The method for the time series domain can be divided into the two forms such as
frequency & time domain (Liu, Lin and Wen, 2018). The utilization of the time series can be
done by visualizing, stationarize, finding optimal parameters, building ARIMA model and
making prediction. For example- the measuring the value of retail sales each moth of the year
can be done by the company through using the time series. There are different other types of the
requirement which can use the time series that includes the effective evaluation so that
predicting the future trend can become possible.
The presented chart is showing the information regarding the previous trend of the sales
made by the particular organization in turn predicting the future outcomes can become possible.
This can permit the firm to get the effective information which can provide assistance in gaining
the reliable and relevant strategy to coordinate with market forces in effective pattern. Time
series is one of the significant statistical analysis technique which are highly taken into the
consideration as permits to receive the various competitive edge (Torres and e.al., 2021). The
roles which are played by the particular technique of statistical analysis comprises predicting
potential trend, strategic decision formulation, opportunity to identify the fluctuation in
economics and business, comparing the performance of different durations so that effectual
planning to meet objectives, etc. On the basis of this, it can be identified that there are different
types of the ways in which time series is found to be useful.
11

These are the crucial issues that are identified while utilizing the regression technique in
the big data and marketing which hamper the objective of accomplishing the objective. It is
important for the user to give emphasis on these lacking areas in turn accomplishing the good
ability to get effectiveness to have higher reliable & relevant outcomes.
12
the big data and marketing which hamper the objective of accomplishing the objective. It is
important for the user to give emphasis on these lacking areas in turn accomplishing the good
ability to get effectiveness to have higher reliable & relevant outcomes.
12
⊘ This is a preview!⊘
Do you want full access?
Subscribe today to unlock all pages.

Trusted by 1+ million students worldwide
1 out of 18
Related Documents

Your All-in-One AI-Powered Toolkit for Academic Success.
+13062052269
info@desklib.com
Available 24*7 on WhatsApp / Email
Unlock your academic potential
Copyright © 2020–2025 A2Z Services. All Rights Reserved. Developed and managed by ZUCOL.