SPSS Analysis Project - Part 3: Correlation/Regression Analysis Report
VerifiedAdded on 2021/02/20
|15
|1937
|23
Project
AI Summary
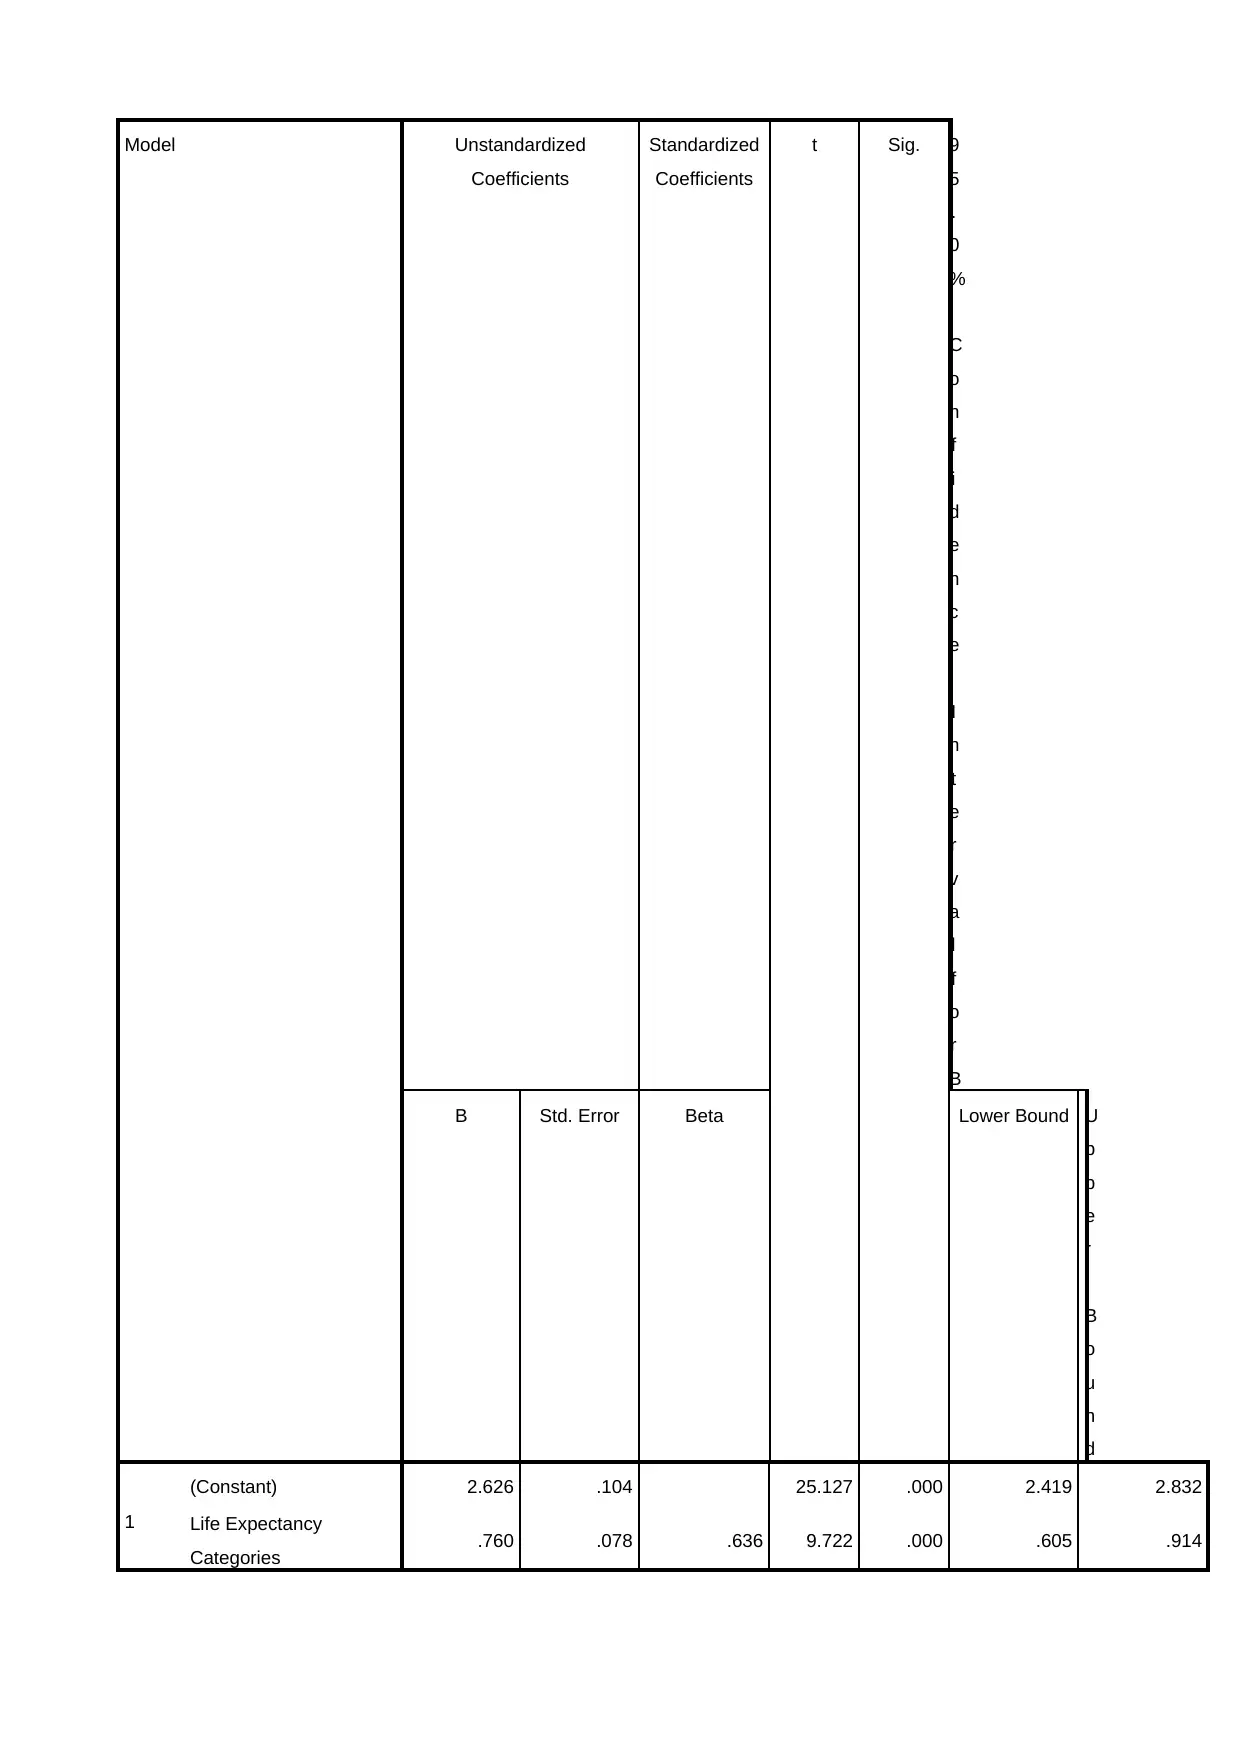
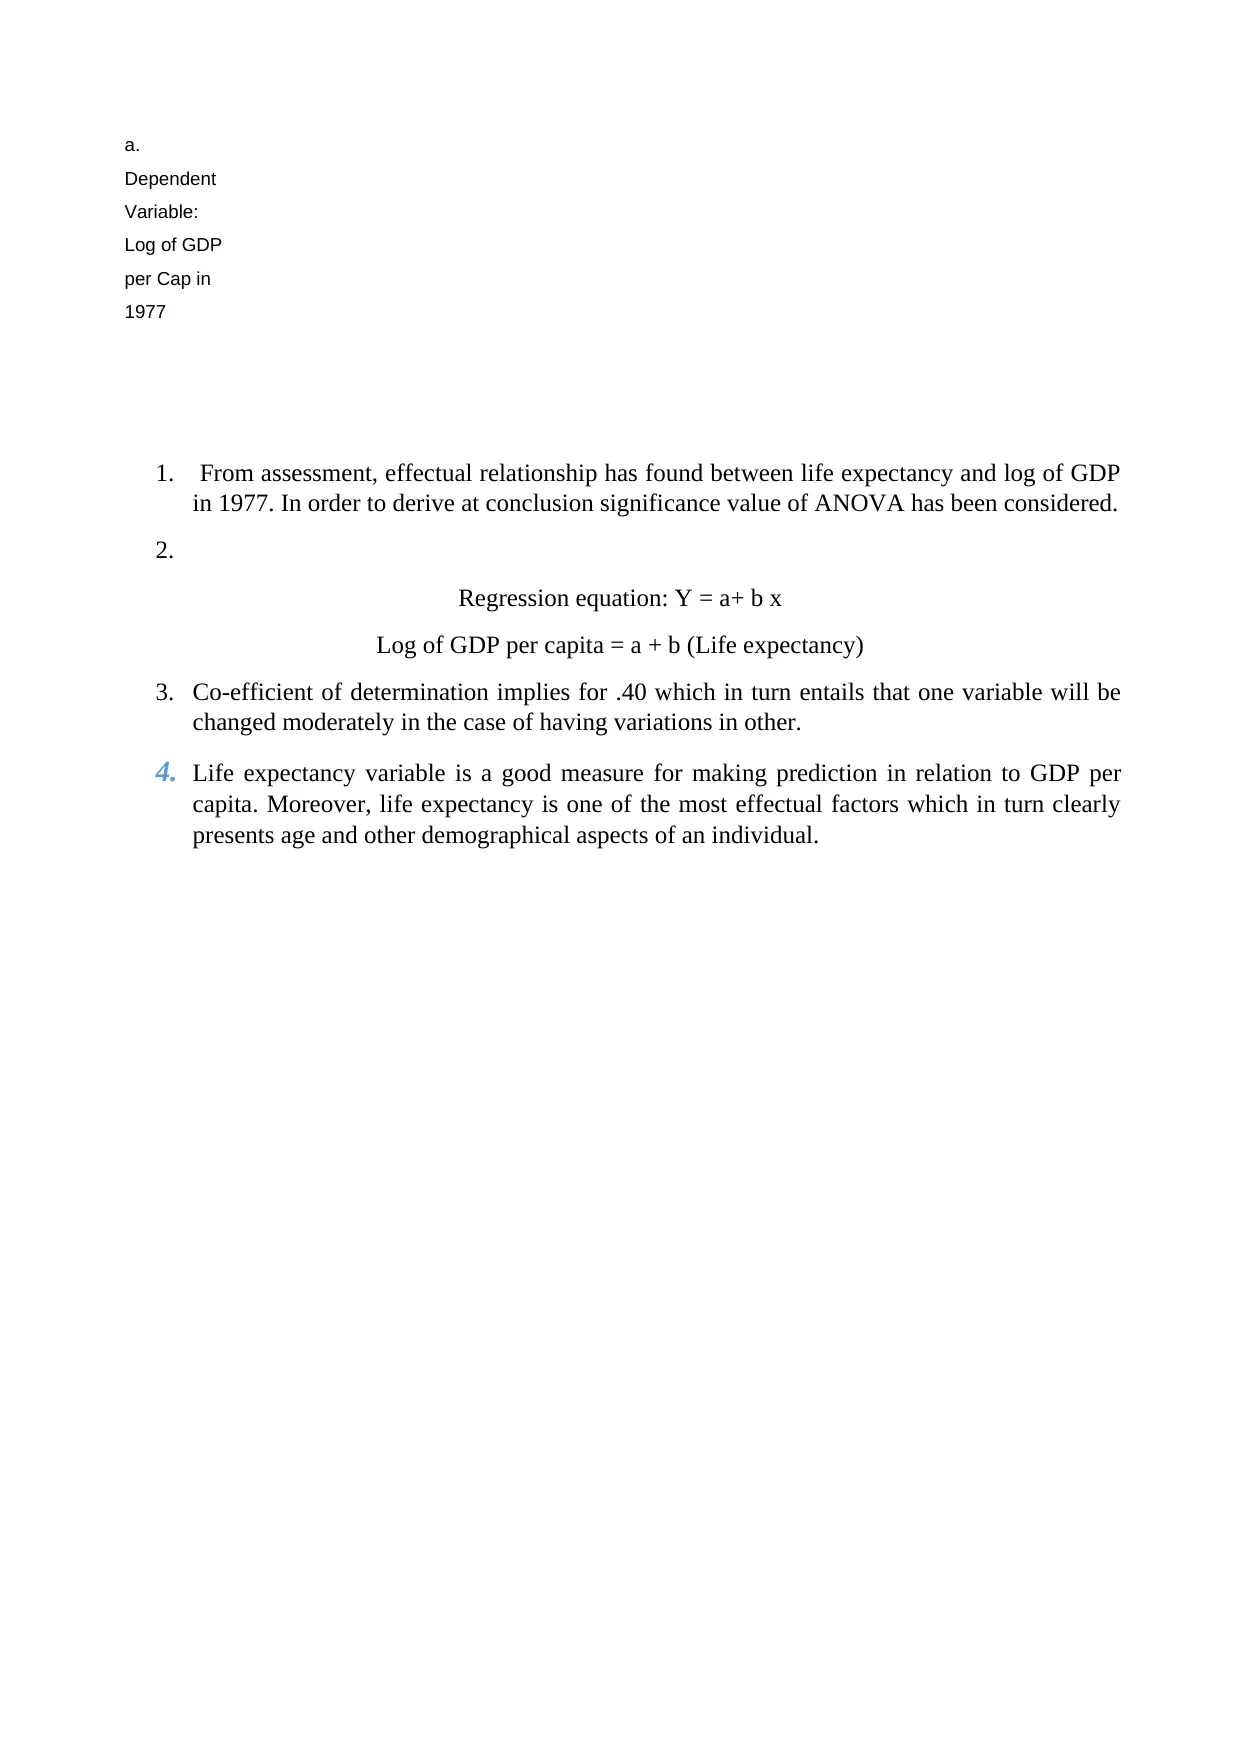
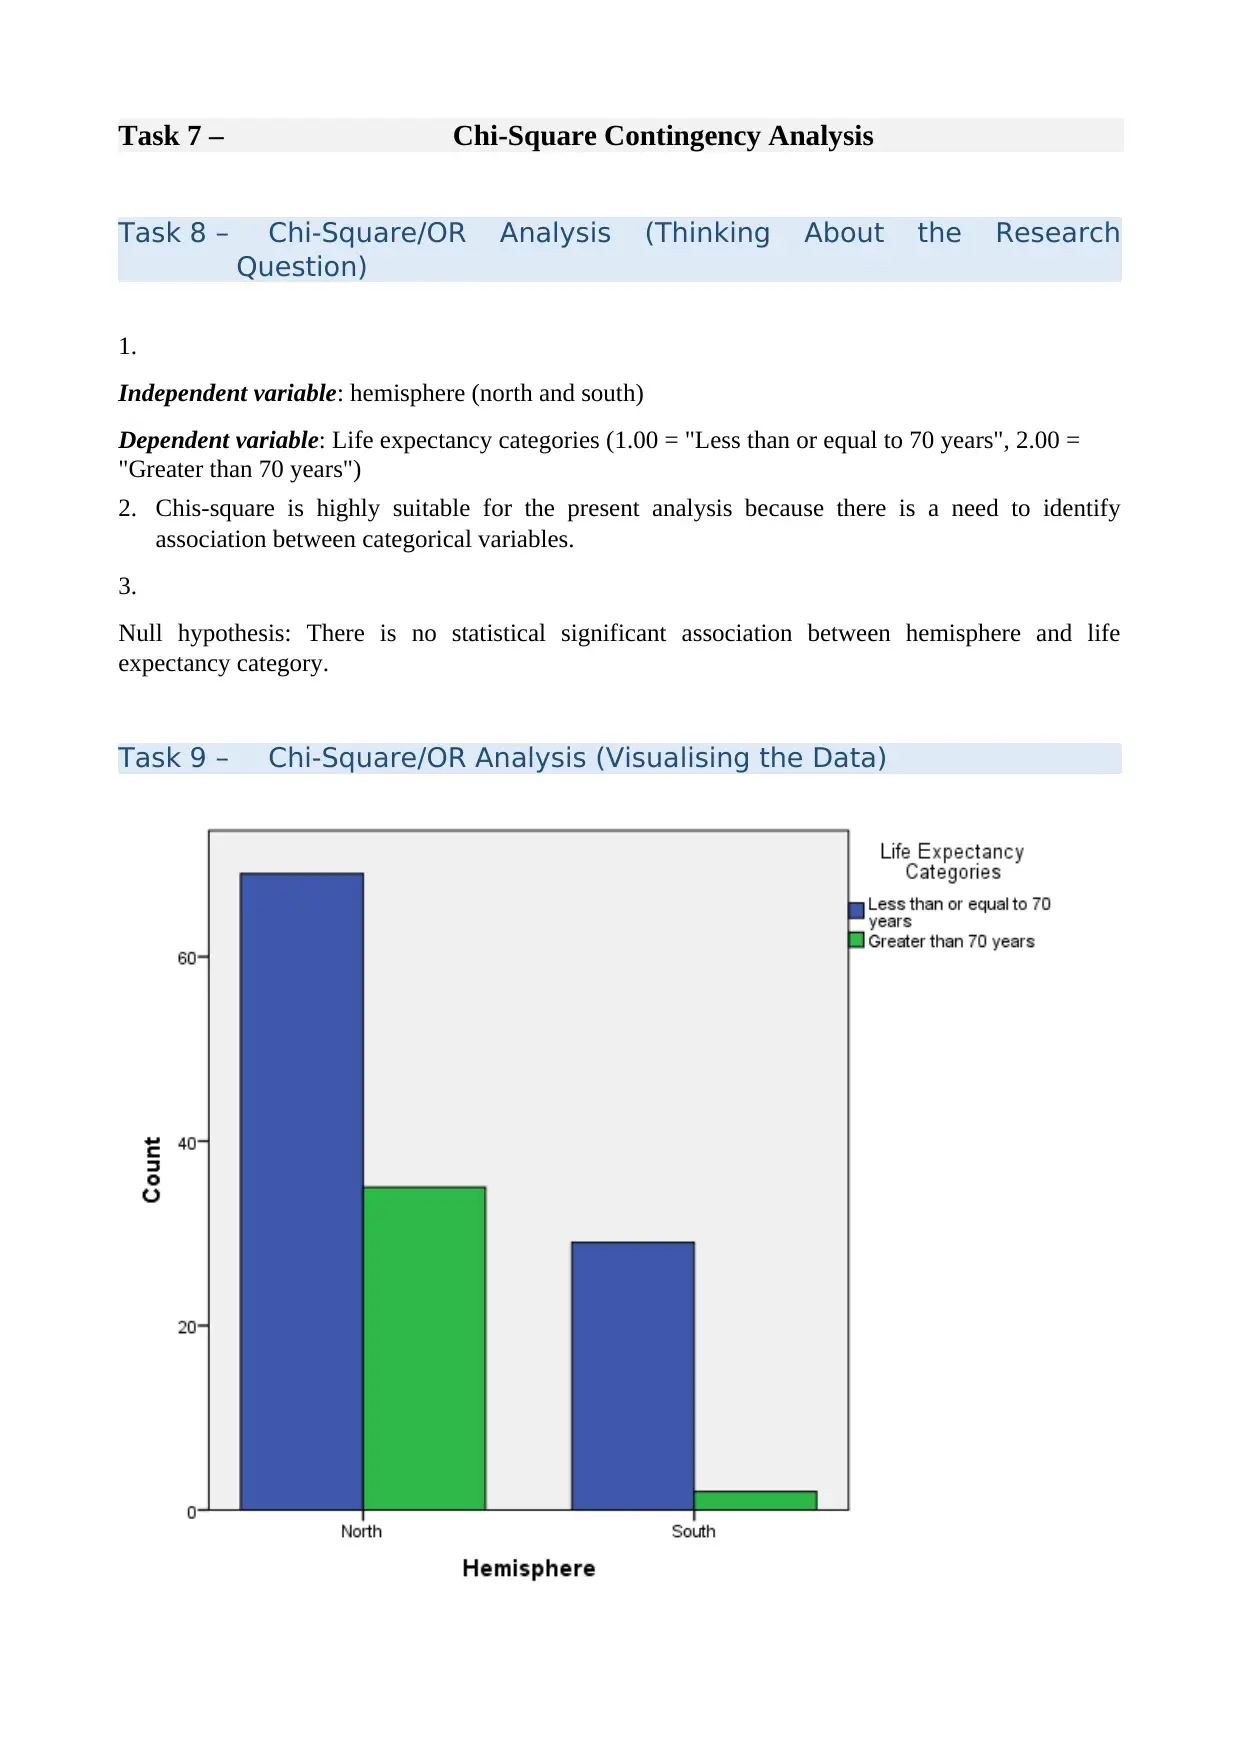
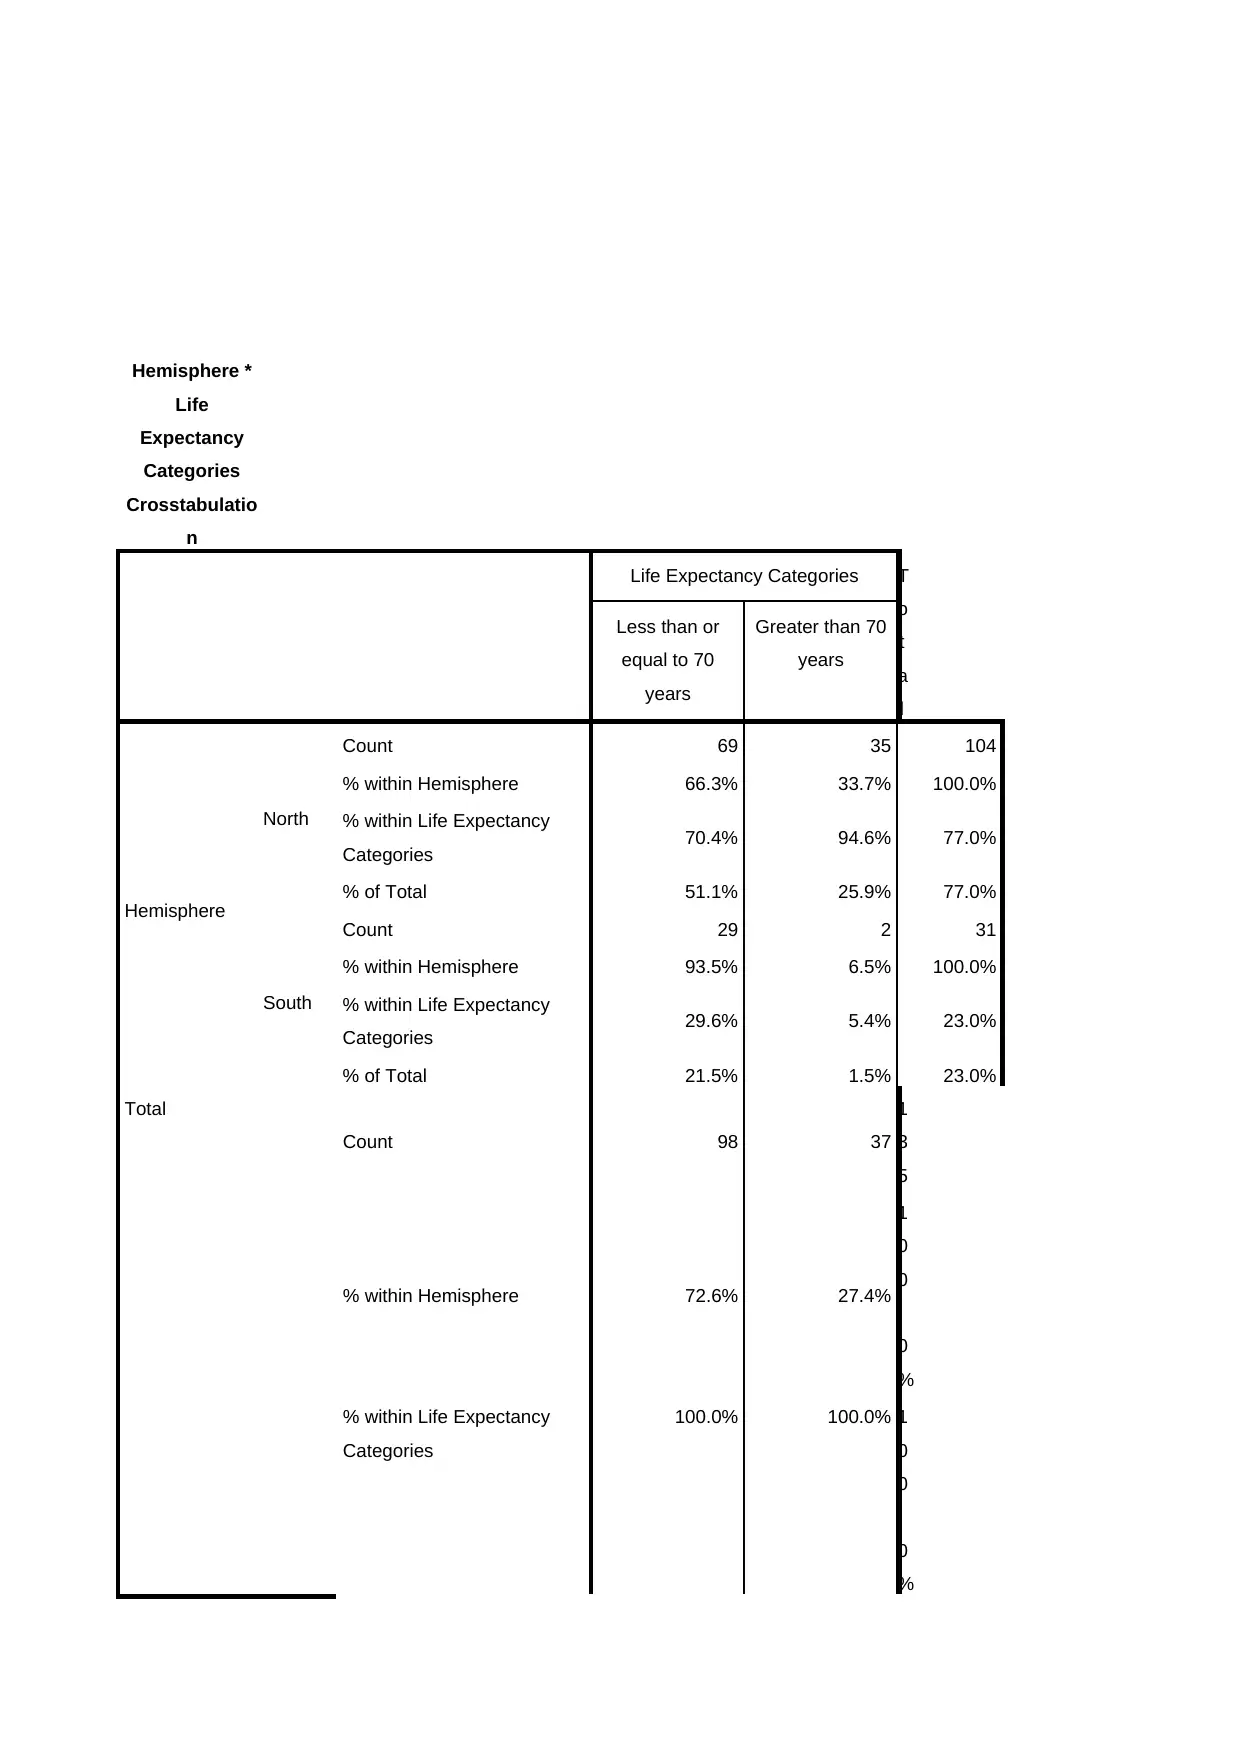
This SPSS analysis project investigates the correlation and regression between GDP per capita and life expectancy. The analysis includes data visualization through scatter plots, bivariate correlation, and regression analysis to assess the relationship between the variables. The project tests the null and alternative hypotheses, using statistical tools like ANOVA and coefficient of determination to determine the significance of the relationship. Additionally, the project employs Chi-square contingency analysis to examine the association between hemisphere and life expectancy categories, including crosstabulation and hypothesis testing to determine statistical significance. The findings suggest a significant correlation between GDP per capita and life expectancy and a notable association between hemisphere and life expectancy categories, supported by statistical values and tests.

SPSS Analysis Project – Part
3
Task 1 –
Correlation/Regression Analysis
Task 2 – Correlation/Regression (Thinking About the Research
Question)
1. Independent variable: GDP per capita in 1977 or log of country’s GDP
2. Dependent variable: Life expectancy
3. Correlation
Null hypothesis (H0): There is no significant correlation between life expectancy and GDP per
capita.
Alternative hypothesis (H1): There is a significant correlation between life expectancy and GDP
per capita.
4. Regression
Null hypothesis (H0): There is no statistical significant difference in the mean value of life
expectancy and GDP per capita.
Alternative hypothesis (H1): There is a statistical significant difference in the mean value of life
expectancy and GDP per capita.
Overall Null hypothesis for the research question is enumerated below:
There is no significant difference in the average value of life expectancy and GDP per capita.
Task 3 – Correlation/Regression (Visualising the Data)
Scatter graph
Paraphrase This Document
Need a fresh take? Get an instant paraphrase of this document with our AI Paraphraser

The above depicted scatter graph shows that significant statically association takes place
between GDP per capita and life expectancy.
Task 4 – Correlation/Regression (Bivariate Correlation)
Regression
Descriptive
Statistics
Mean Std. Deviation N
Log of GDP per Cap in 1977 3.5848 .52733 141
Life Expectancy Categories 1.2624 .44151 141
between GDP per capita and life expectancy.
Task 4 – Correlation/Regression (Bivariate Correlation)
Regression
Descriptive
Statistics
Mean Std. Deviation N
Log of GDP per Cap in 1977 3.5848 .52733 141
Life Expectancy Categories 1.2624 .44151 141

Correlations
Log of GDP per
Cap in 1977
L
i
f
e
E
x
p
e
c
t
a
n
c
y
C
a
t
e
g
o
r
i
e
s
Pearson Correlation Log of GDP per Cap in 1977 1.000 .636
Life Expectancy Categories .636 1.000
Sig. (1-tailed) Log of GDP per Cap in 1977 . .000
Life Expectancy Categories .000 .
N Log of GDP per Cap in 1977 141 141
Life Expectancy Categories 141 141
Variables
Entered/Rem
oveda
Model Variables Entered Variables
Removed
Method
1 Life Expectancy
Categoriesb . Enter
⊘ This is a preview!⊘
Do you want full access?
Subscribe today to unlock all pages.

Trusted by 1+ million students worldwide

a. Dependent
Variable: Log
of GDP per
Cap in 1977
b. All
requested
variables
entered.
Model
Summaryb
Model R R Square Adjusted R
Square
Std. Error of
the Estimate
Change
Statistics
R Square
Change
F Change df1 df2 Sig. F Change
1 .636a .405 .400 .40831 .405 94.512 1 139 .000
a.
Predictors:
(Constant),
Life
Expectanc
y
Categories
b.
Dependent
Variable:
Log of
GDP per
Cap in
1977
ANOVAa
Model Sum of Squares df Mean Square F S
i
g
.
1
Regression 15.757 1 15.757 94.512 .000b
Residual 23.174 139 .167
Total 38.930 140
Paraphrase This Document
Need a fresh take? Get an instant paraphrase of this document with our AI Paraphraser

a.
Dependent
Variable: Log
of GDP per
Cap in 1977
b. Predictors:
(Constant),
Life
Expectancy
Categories
By doing regression analysis, it has assessed that p value is 0.00 which in turn exhibits that
alternative hypothesis is true. In other words, p<0.05 so it can be said that significant relationship
takes place between log of GDP per capita and life expectancy.
Task 5 – Correlation/Regression (Assumption Testing)
Charts

⊘ This is a preview!⊘
Do you want full access?
Subscribe today to unlock all pages.

Trusted by 1+ million students worldwide

Task 6 – Correlation/Regression (Hypothesis Test)
Descriptive
Statistics
Mean Std. Deviation N
Log of GDP per Cap in 1977 3.5848 .52733 141
Life Expectancy Categories 1.2624 .44151 141
Model
Summaryb
Model R R Square Adjusted R
Square
Std. Error of
the Estimate
Change
Statistics
Descriptive
Statistics
Mean Std. Deviation N
Log of GDP per Cap in 1977 3.5848 .52733 141
Life Expectancy Categories 1.2624 .44151 141
Model
Summaryb
Model R R Square Adjusted R
Square
Std. Error of
the Estimate
Change
Statistics
Paraphrase This Document
Need a fresh take? Get an instant paraphrase of this document with our AI Paraphraser

R Square
Change
F Change df1 df2 Sig. F Change
1 .636a .405 .400 .40831 .405 94.512 1 139 .000
a.
Predictors:
(Constant),
Life
Expectanc
y
Categories
b.
Dependent
Variable:
Log of
GDP per
Cap in
1977
Coefficients
a
Change
F Change df1 df2 Sig. F Change
1 .636a .405 .400 .40831 .405 94.512 1 139 .000
a.
Predictors:
(Constant),
Life
Expectanc
y
Categories
b.
Dependent
Variable:
Log of
GDP per
Cap in
1977
Coefficients
a

Model Unstandardized
Coefficients
Standardized
Coefficients
t Sig. 9
5
.
0
%
C
o
n
f
i
d
e
n
c
e
I
n
t
e
r
v
a
l
f
o
r
B
B Std. Error Beta Lower Bound U
p
p
e
r
B
o
u
n
d
1
(Constant) 2.626 .104 25.127 .000 2.419 2.832
Life Expectancy
Categories .760 .078 .636 9.722 .000 .605 .914
Coefficients
Standardized
Coefficients
t Sig. 9
5
.
0
%
C
o
n
f
i
d
e
n
c
e
I
n
t
e
r
v
a
l
f
o
r
B
B Std. Error Beta Lower Bound U
p
p
e
r
B
o
u
n
d
1
(Constant) 2.626 .104 25.127 .000 2.419 2.832
Life Expectancy
Categories .760 .078 .636 9.722 .000 .605 .914
⊘ This is a preview!⊘
Do you want full access?
Subscribe today to unlock all pages.

Trusted by 1+ million students worldwide

a.
Dependent
Variable:
Log of GDP
per Cap in
1977
1. From assessment, effectual relationship has found between life expectancy and log of GDP
in 1977. In order to derive at conclusion significance value of ANOVA has been considered.
2.
Regression equation: Y = a+ b x
Log of GDP per capita = a + b (Life expectancy)
3. Co-efficient of determination implies for .40 which in turn entails that one variable will be
changed moderately in the case of having variations in other.
4. Life expectancy variable is a good measure for making prediction in relation to GDP per
capita. Moreover, life expectancy is one of the most effectual factors which in turn clearly
presents age and other demographical aspects of an individual.
Paraphrase This Document
Need a fresh take? Get an instant paraphrase of this document with our AI Paraphraser

Task 7 – Chi-Square Contingency Analysis
Task 8 – Chi-Square/OR Analysis (Thinking About the Research
Question)
1.
Independent variable: hemisphere (north and south)
Dependent variable: Life expectancy categories (1.00 = "Less than or equal to 70 years", 2.00 =
"Greater than 70 years")
2. Chis-square is highly suitable for the present analysis because there is a need to identify
association between categorical variables.
3.
Null hypothesis: There is no statistical significant association between hemisphere and life
expectancy category.
Task 9 – Chi-Square/OR Analysis (Visualising the Data)

Hemisphere *
Life
Expectancy
Categories
Crosstabulatio
n
Life Expectancy Categories T
o
t
a
l
Less than or
equal to 70
years
Greater than 70
years
Hemisphere
North
Count 69 35 104
% within Hemisphere 66.3% 33.7% 100.0%
% within Life Expectancy
Categories 70.4% 94.6% 77.0%
% of Total 51.1% 25.9% 77.0%
South
Count 29 2 31
% within Hemisphere 93.5% 6.5% 100.0%
% within Life Expectancy
Categories 29.6% 5.4% 23.0%
% of Total 21.5% 1.5% 23.0%
Total
Count 98 37
1
3
5
% within Hemisphere 72.6% 27.4%
1
0
0
0
%
% within Life Expectancy
Categories
100.0% 100.0% 1
0
0
0
%
⊘ This is a preview!⊘
Do you want full access?
Subscribe today to unlock all pages.

Trusted by 1+ million students worldwide
1 out of 15
Related Documents
Your All-in-One AI-Powered Toolkit for Academic Success.
+13062052269
info@desklib.com
Available 24*7 on WhatsApp / Email
Unlock your academic potential
Copyright © 2020–2025 A2Z Services. All Rights Reserved. Developed and managed by ZUCOL.


