Applying Quantitative Methods: Correlation, Regression, Time Series

Verified

Added on  2023/06/09

|9
|804
|359
Presentation
AI Summary
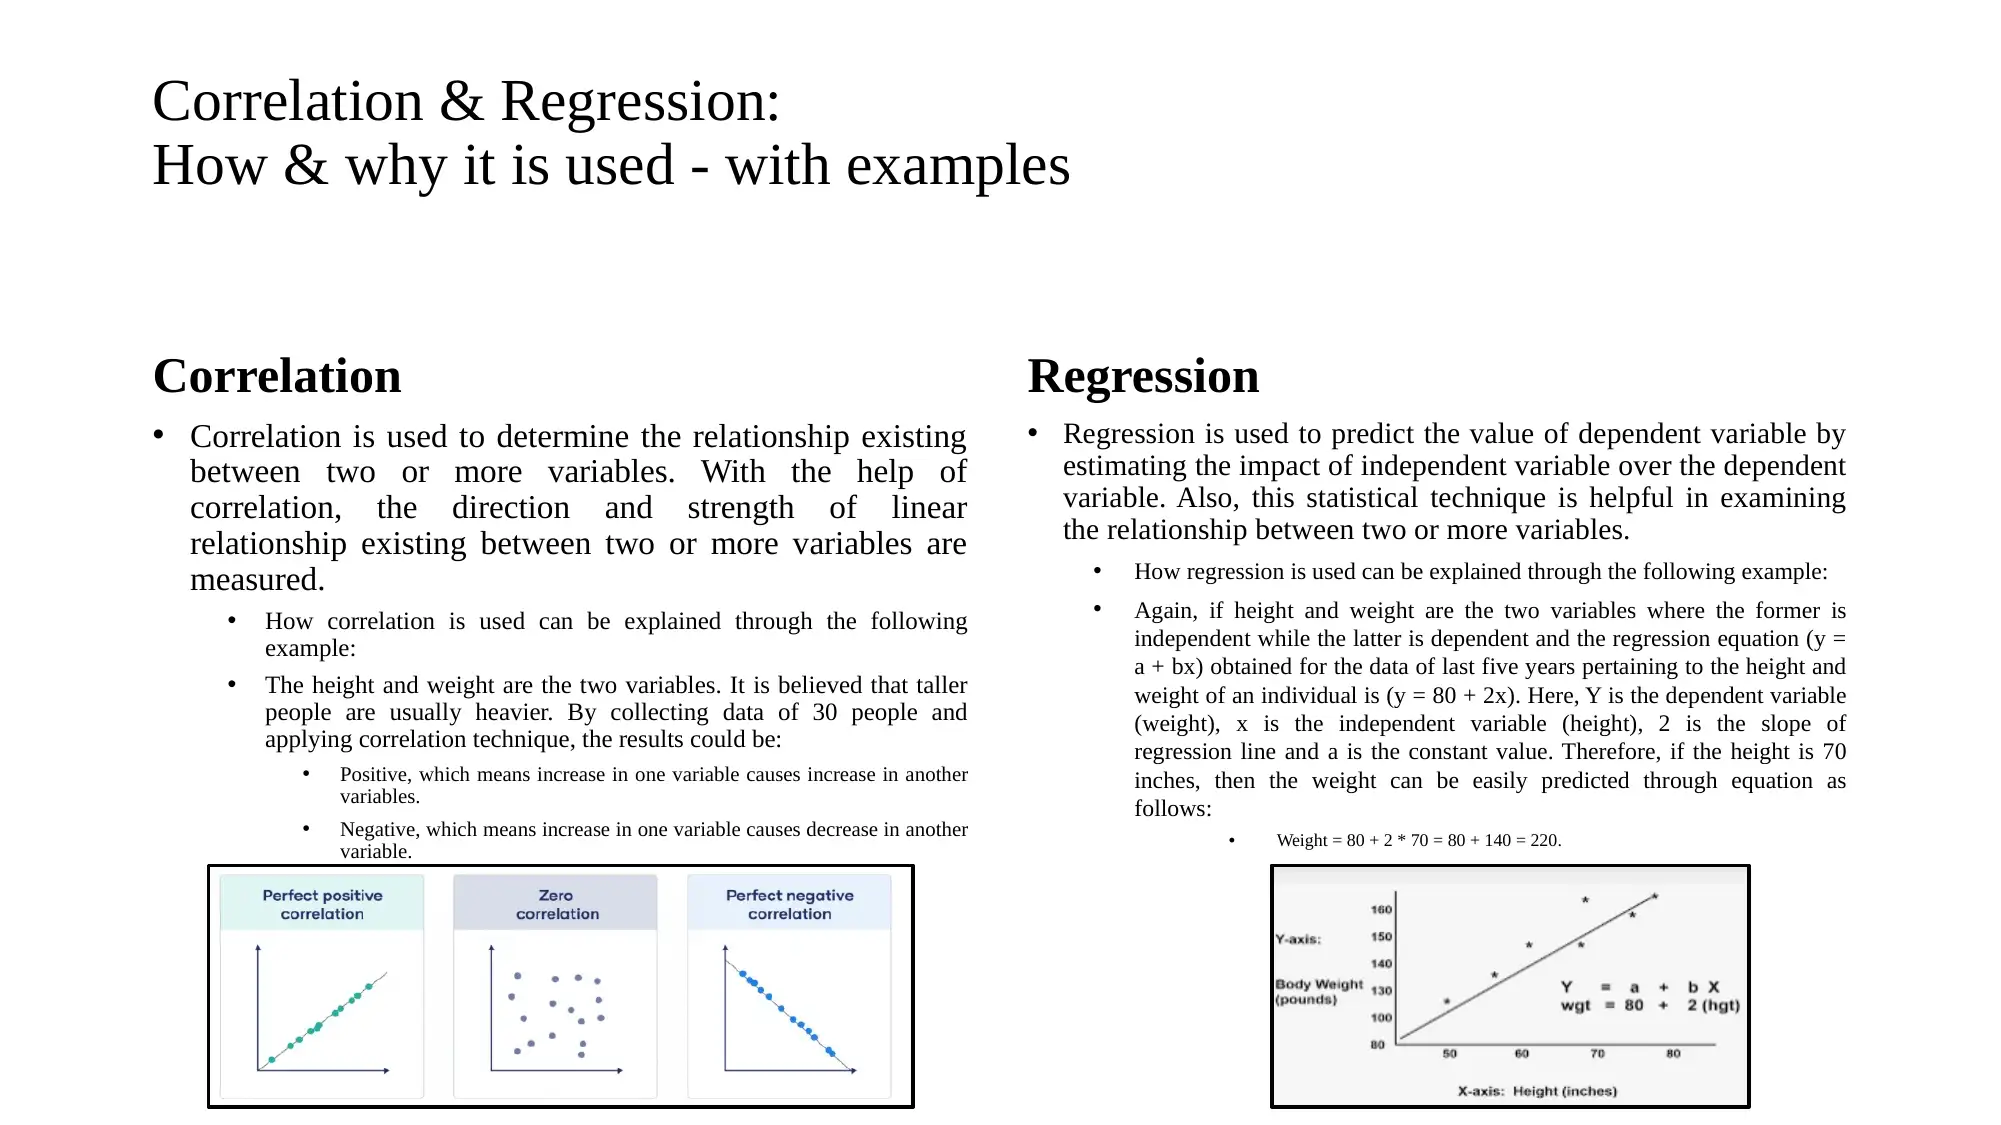
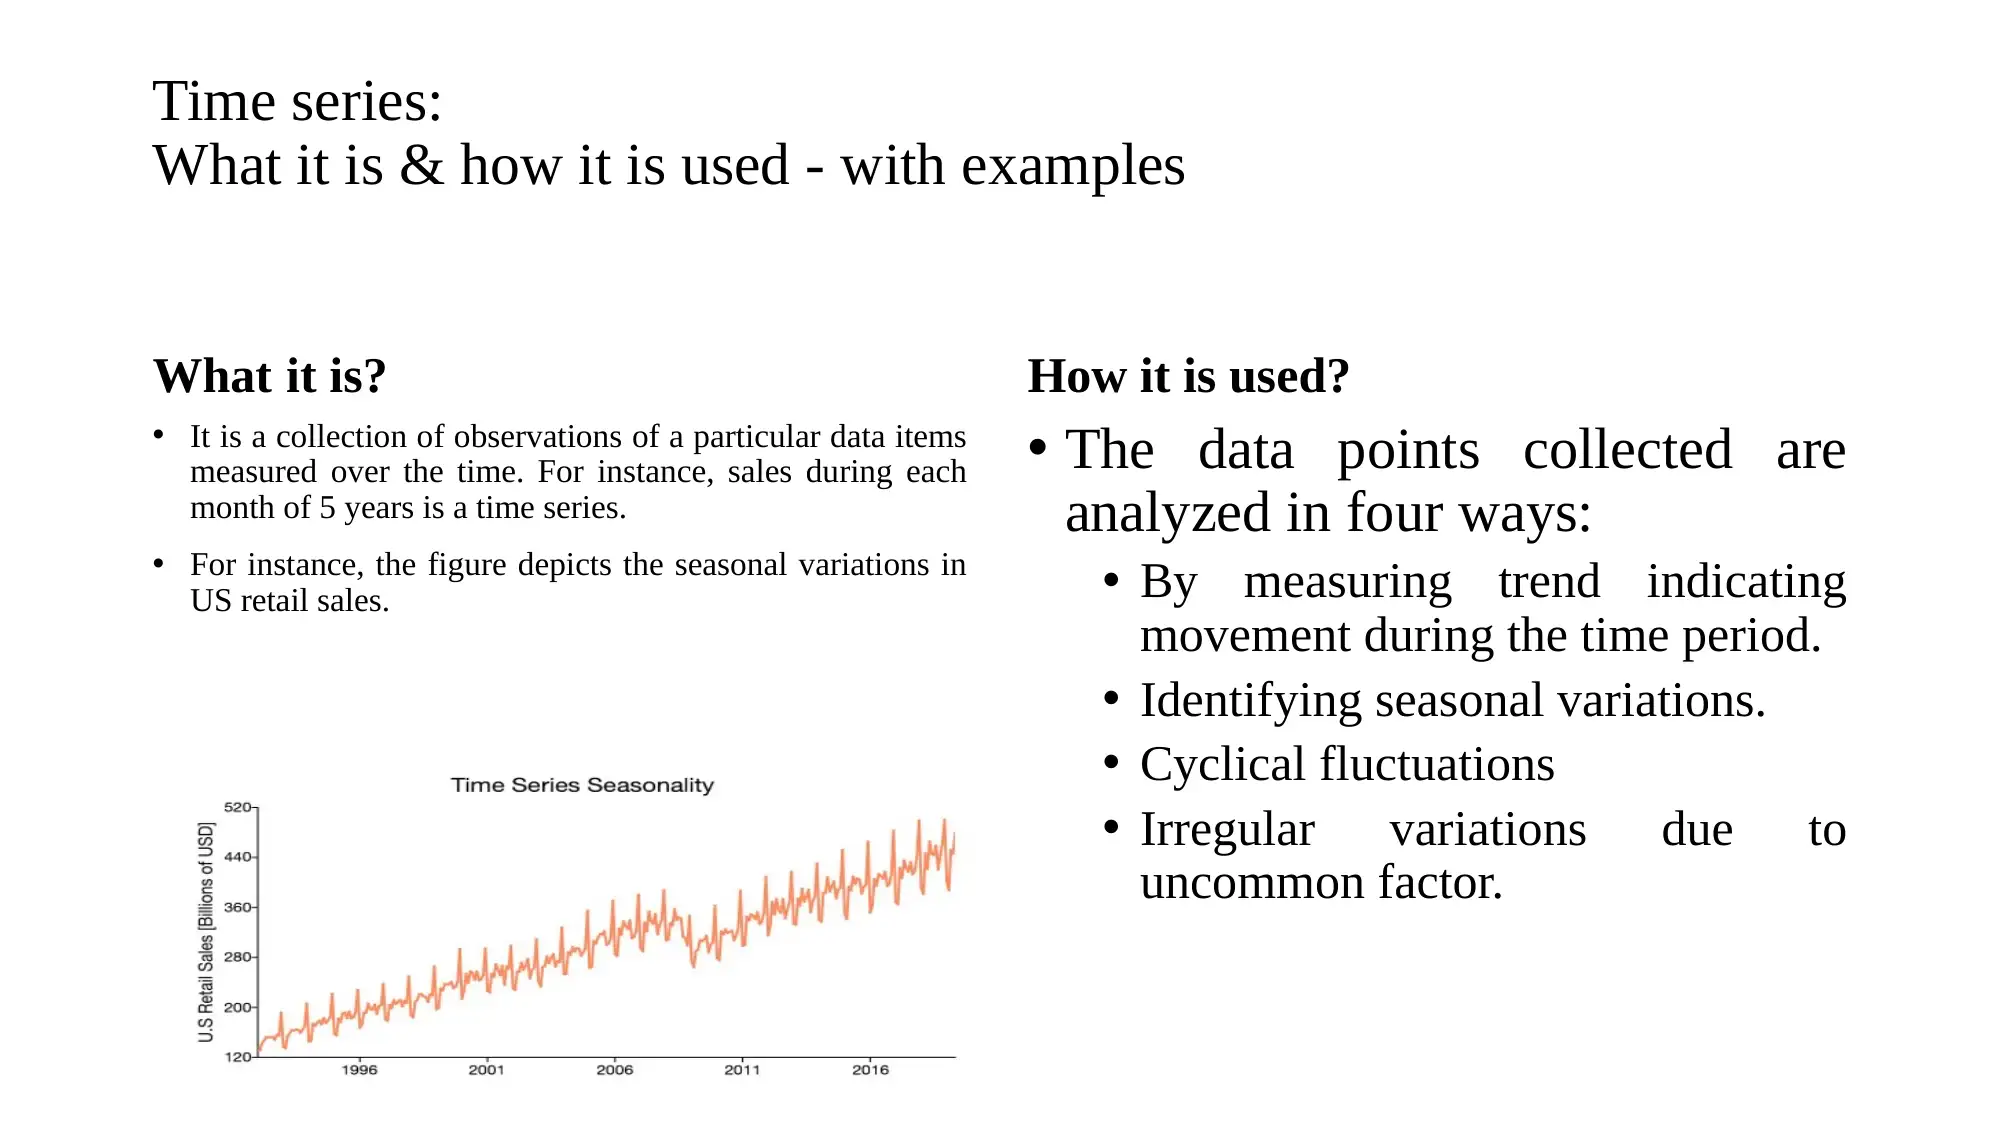
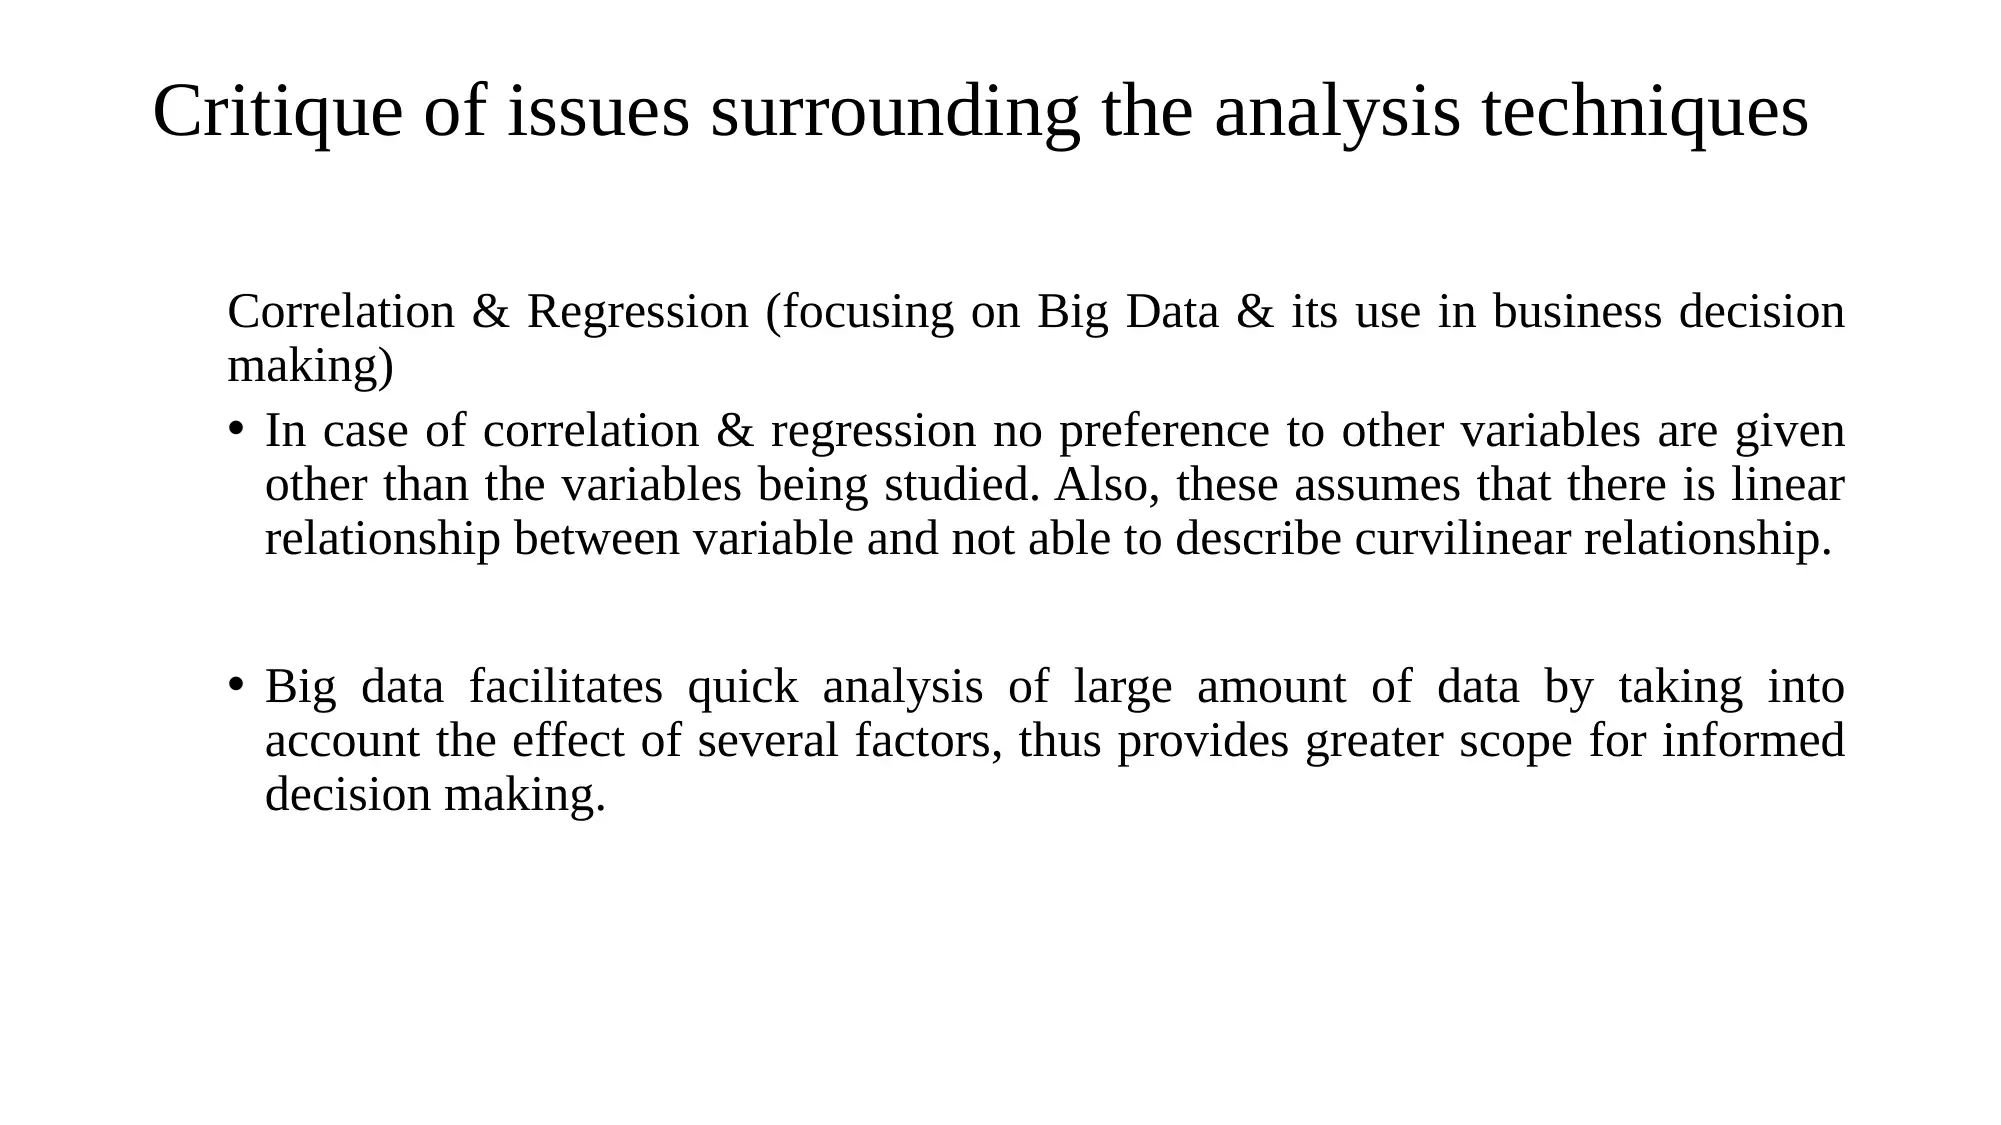
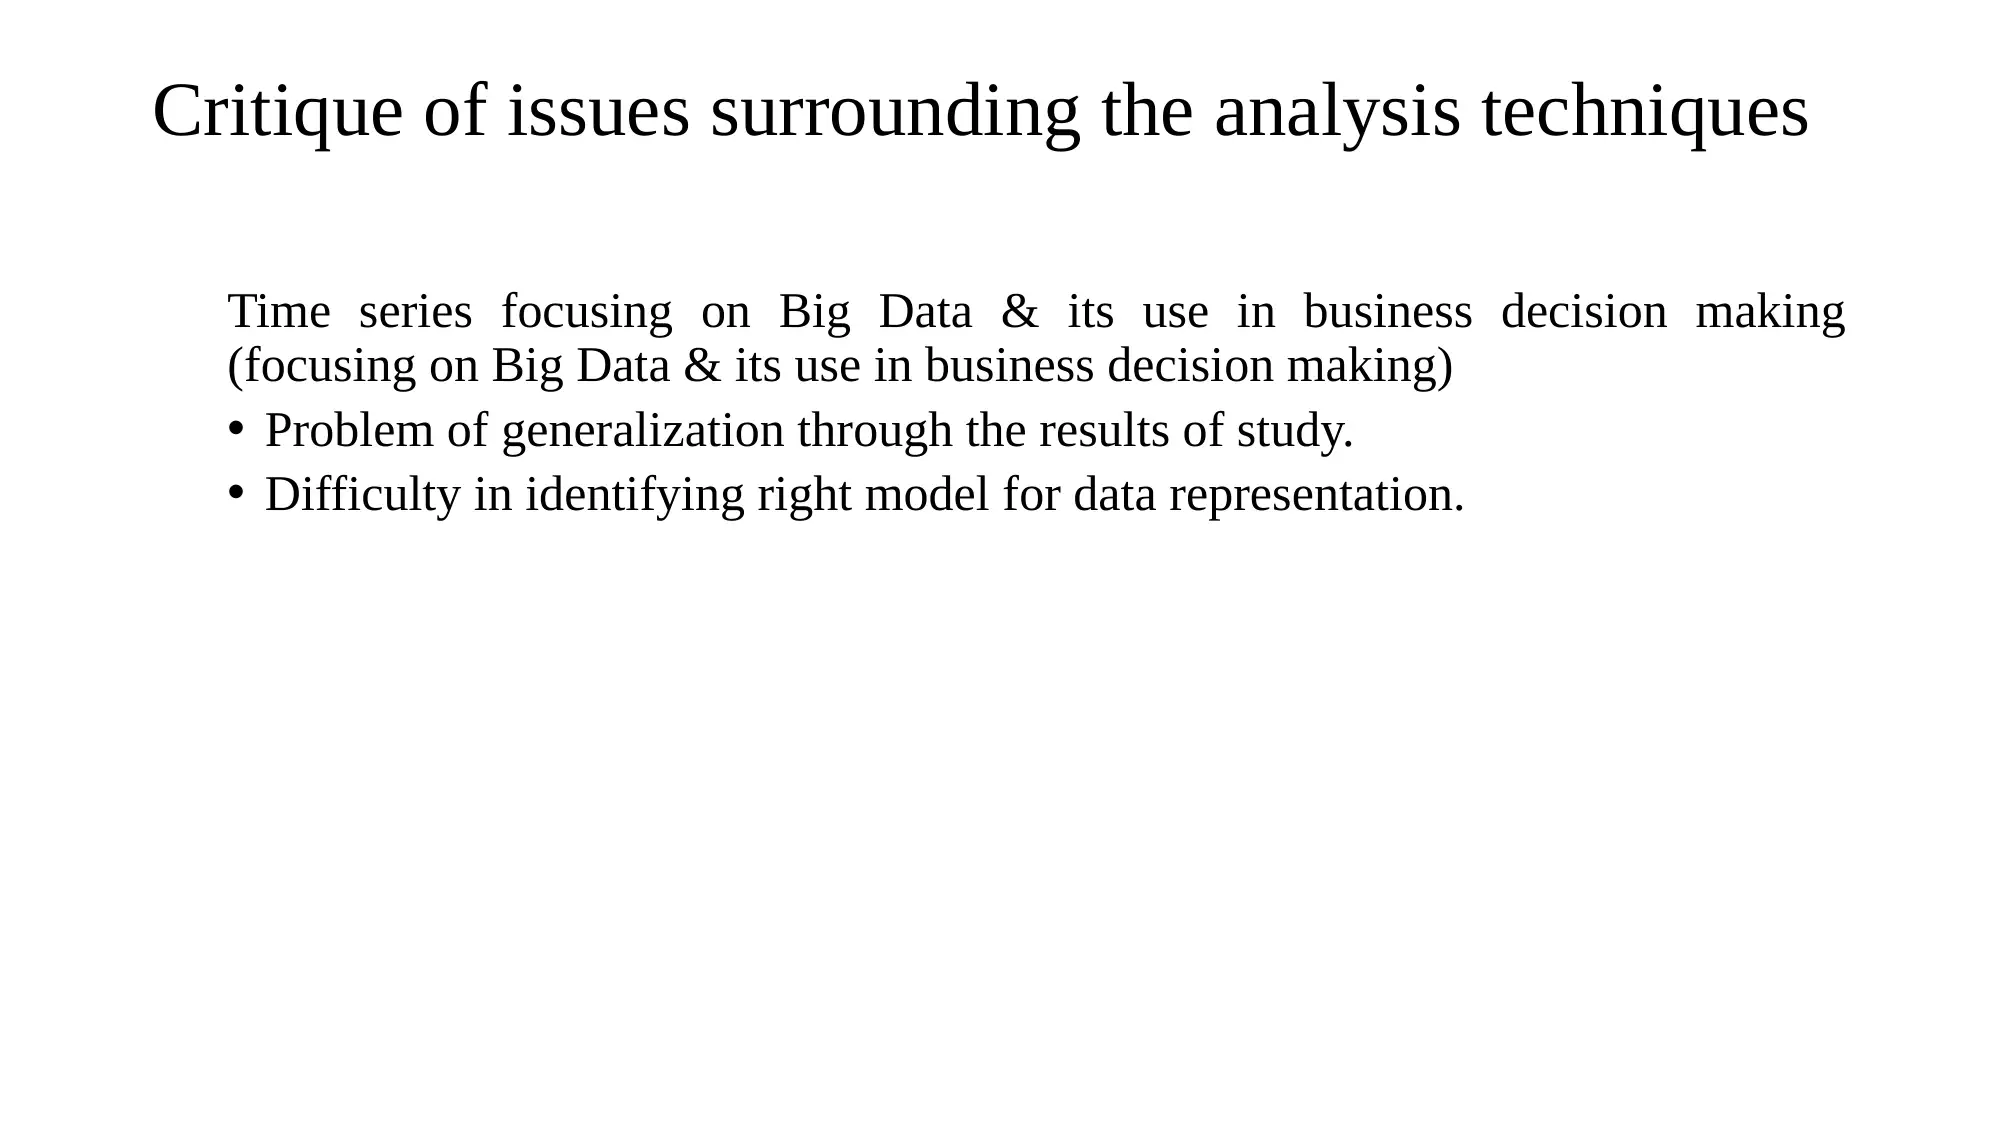
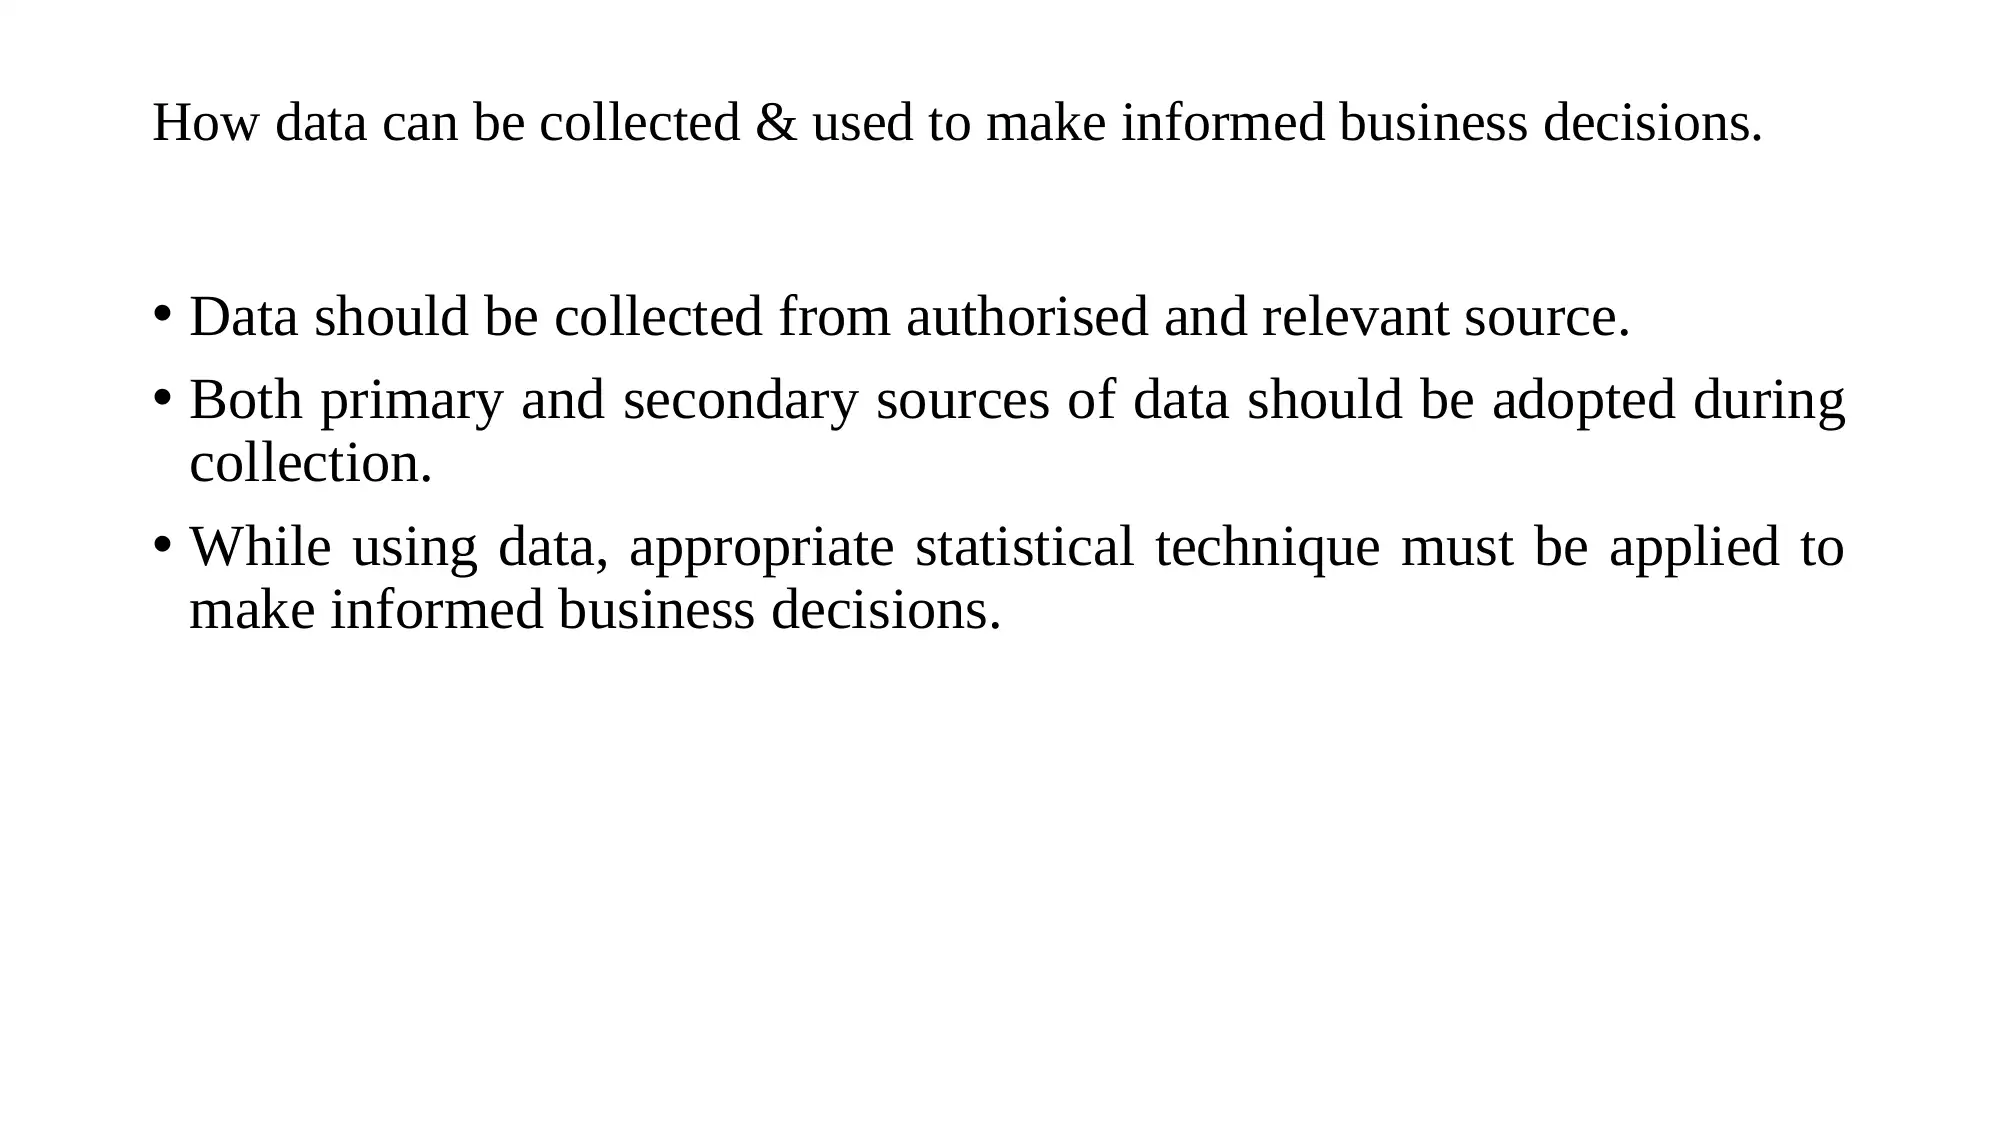
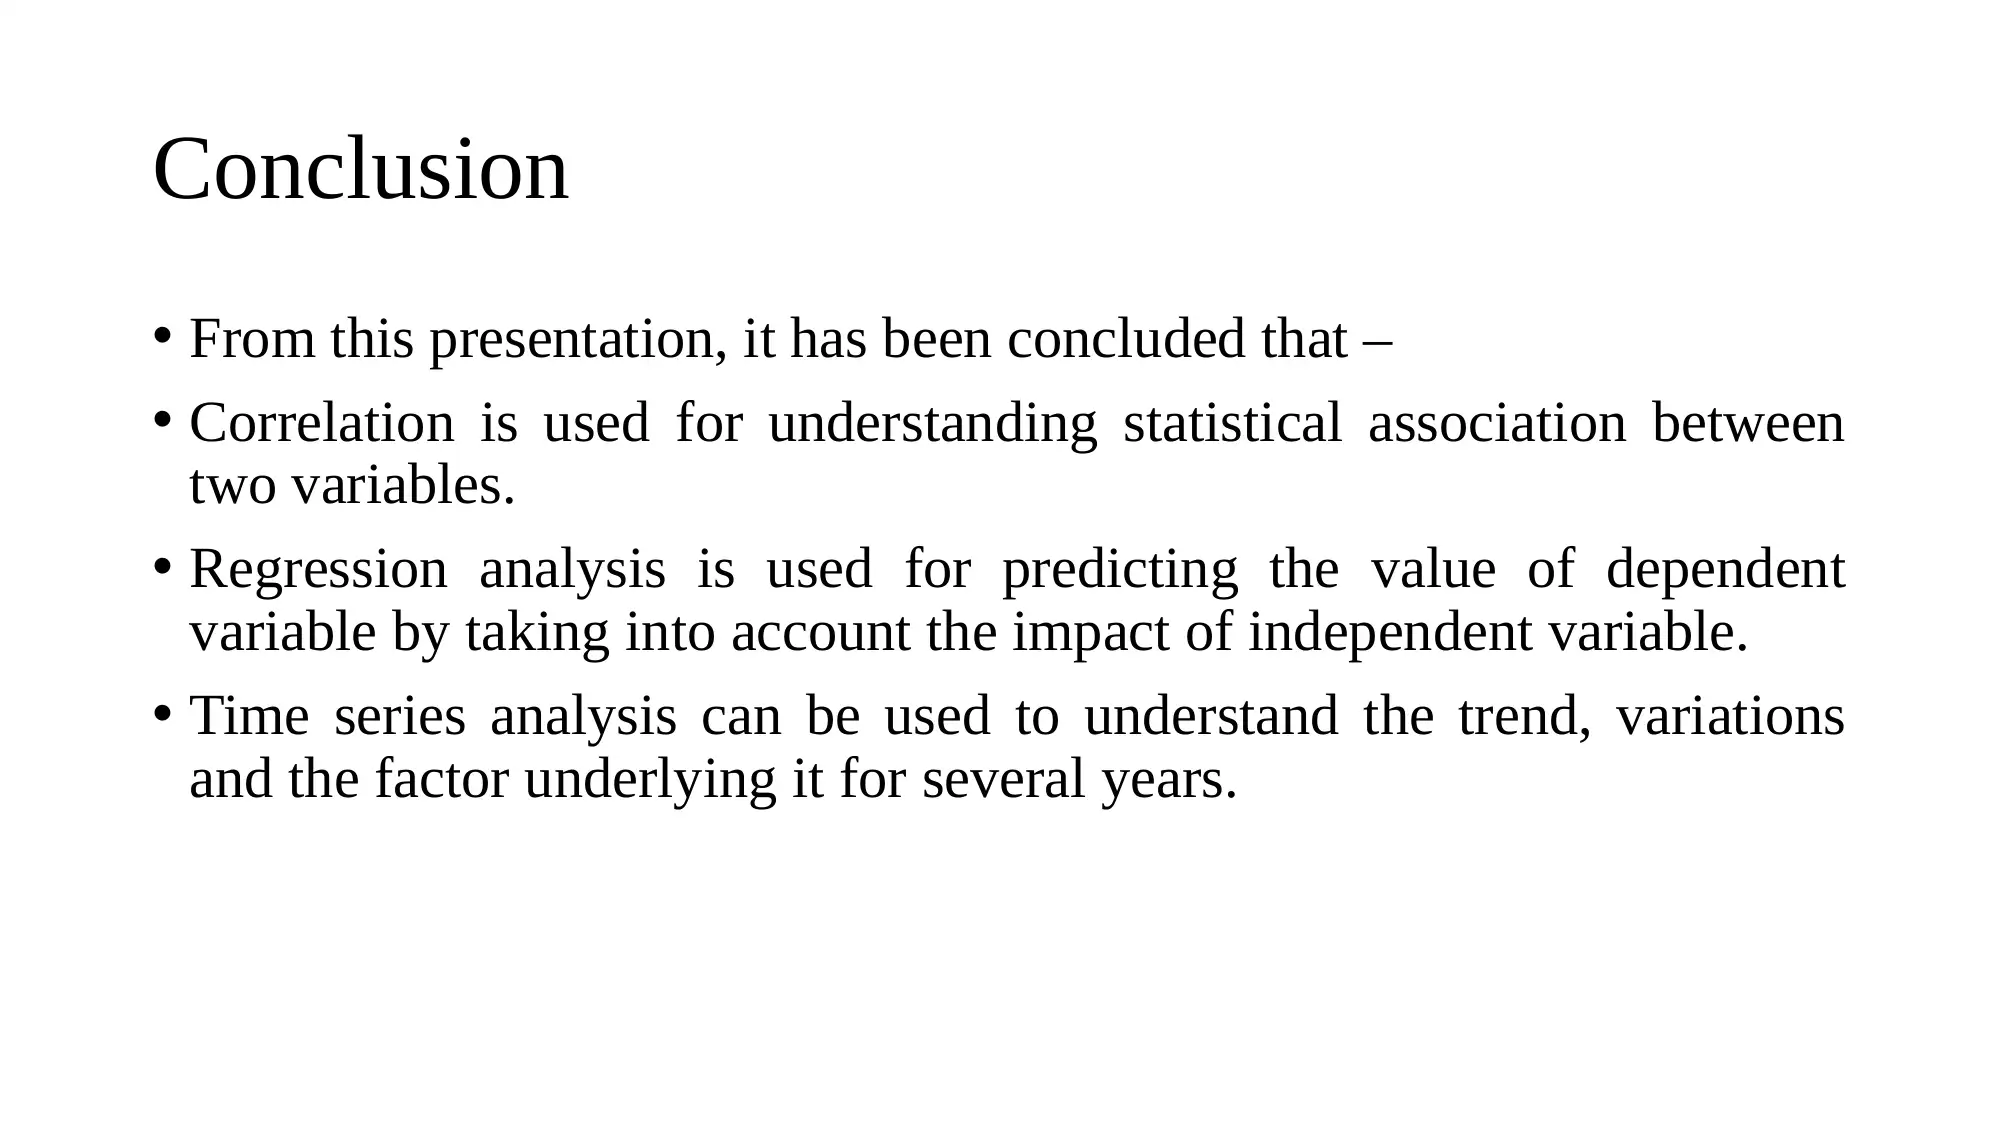
This presentation provides an overview of quantitative market research methods, focusing on correlation, regression, and time series analysis. It explains how correlation is used to determine the relationship between variables, while regression predicts the value of a dependent variable based on independent variables. Time series analysis, involving the collection of data points over time, is used to identify trends, seasonal variations, cyclical fluctuations, and irregular variations. The presentation also critiques the issues surrounding these analysis techniques, particularly in the context of big data and business decision-making, highlighting limitations such as the assumption of linear relationships and difficulties in generalization. It emphasizes the importance of collecting data from authorized sources and applying appropriate statistical techniques for informed business decisions. The presentation concludes that correlation helps understand statistical associations, regression aids in predicting dependent variables, and time series analysis helps understand trends and underlying factors over time.
Document Page
DIBD
tabler-icon-diamond-filled.svg

Paraphrase This Document

Need a fresh take? Get an instant paraphrase of this document with our AI Paraphraser
Document Page
Introduction
Roles of quantitative market research in business
Importance of relevant questionnaire design
Role of Qualitative research in Business
Importance of discussion guide and use
Correlation. Regression. And Time Series Analysis
Limitations of Correlation, regression
How to improve collecting Data (when the data is required to make
business decisions)
Document Page
Correlation & Regression:
How & why it is used - with examples
Correlation
Correlation is used to determine the relationship existing
between two or more variables. With the help of
correlation, the direction and strength of linear
relationship existing between two or more variables are
measured.
How correlation is used can be explained through the following
example:
The height and weight are the two variables. It is believed that taller
people are usually heavier. By collecting data of 30 people and
applying correlation technique, the results could be:
Positive, which means increase in one variable causes increase in another
variables.
Negative, which means increase in one variable causes decrease in another
variable.
Regression
Regression is used to predict the value of dependent variable by
estimating the impact of independent variable over the dependent
variable. Also, this statistical technique is helpful in examining
the relationship between two or more variables.
How regression is used can be explained through the following example:
Again, if height and weight are the two variables where the former is
independent while the latter is dependent and the regression equation (y =
a + bx) obtained for the data of last five years pertaining to the height and
weight of an individual is (y = 80 + 2x). Here, Y is the dependent variable
(weight), x is the independent variable (height), 2 is the slope of
regression line and a is the constant value. Therefore, if the height is 70
inches, then the weight can be easily predicted through equation as
follows:
Weight = 80 + 2 * 70 = 80 + 140 = 220.
Document Page
Time series:
What it is & how it is used - with examples
What it is?
It is a collection of observations of a particular data items
measured over the time. For instance, sales during each
month of 5 years is a time series.
For instance, the figure depicts the seasonal variations in
US retail sales.
How it is used?
The data points collected are
analyzed in four ways:
By measuring trend indicating
movement during the time period.
Identifying seasonal variations.
Cyclical fluctuations
Irregular variations due to
uncommon factor.
tabler-icon-diamond-filled.svg

Paraphrase This Document

Need a fresh take? Get an instant paraphrase of this document with our AI Paraphraser
Document Page
Critique of issues surrounding the analysis techniques
Correlation & Regression (focusing on Big Data & its use in business decision
making)
In case of correlation & regression no preference to other variables are given
other than the variables being studied. Also, these assumes that there is linear
relationship between variable and not able to describe curvilinear relationship.
Big data facilitates quick analysis of large amount of data by taking into
account the effect of several factors, thus provides greater scope for informed
decision making.
Document Page
Critique of issues surrounding the analysis techniques
Time series focusing on Big Data & its use in business decision making
(focusing on Big Data & its use in business decision making)
Problem of generalization through the results of study.
Difficulty in identifying right model for data representation.
Document Page
How data can be collected & used to make informed business decisions.
Data should be collected from authorised and relevant source.
Both primary and secondary sources of data should be adopted during
collection.
While using data, appropriate statistical technique must be applied to
make informed business decisions.
tabler-icon-diamond-filled.svg

Paraphrase This Document

Need a fresh take? Get an instant paraphrase of this document with our AI Paraphraser
Document Page
Conclusion
From this presentation, it has been concluded that –
Correlation is used for understanding statistical association between
two variables.
Regression analysis is used for predicting the value of dependent
variable by taking into account the impact of independent variable.
Time series analysis can be used to understand the trend, variations
and the factor underlying it for several years.
Document Page
List of References
Little, R.J. and Rubin, D.B., 2019. Statistical analysis with missing
data (Vol. 793). John Wiley & Sons.
Han, Y. and Lahiri, P., 2019. Statistical analysis with linked
data. International Statistical Review, 87, pp.S139-S157.
chevron_up_icon
1 out of 9
circle_padding
hide_on_mobile
zoom_out_icon
[object Object]