Detailed Statistical Analysis of Three Psychological Studies

Verified

Added on  2023/06/03

|5
|628
|378
Homework Assignment
AI Summary
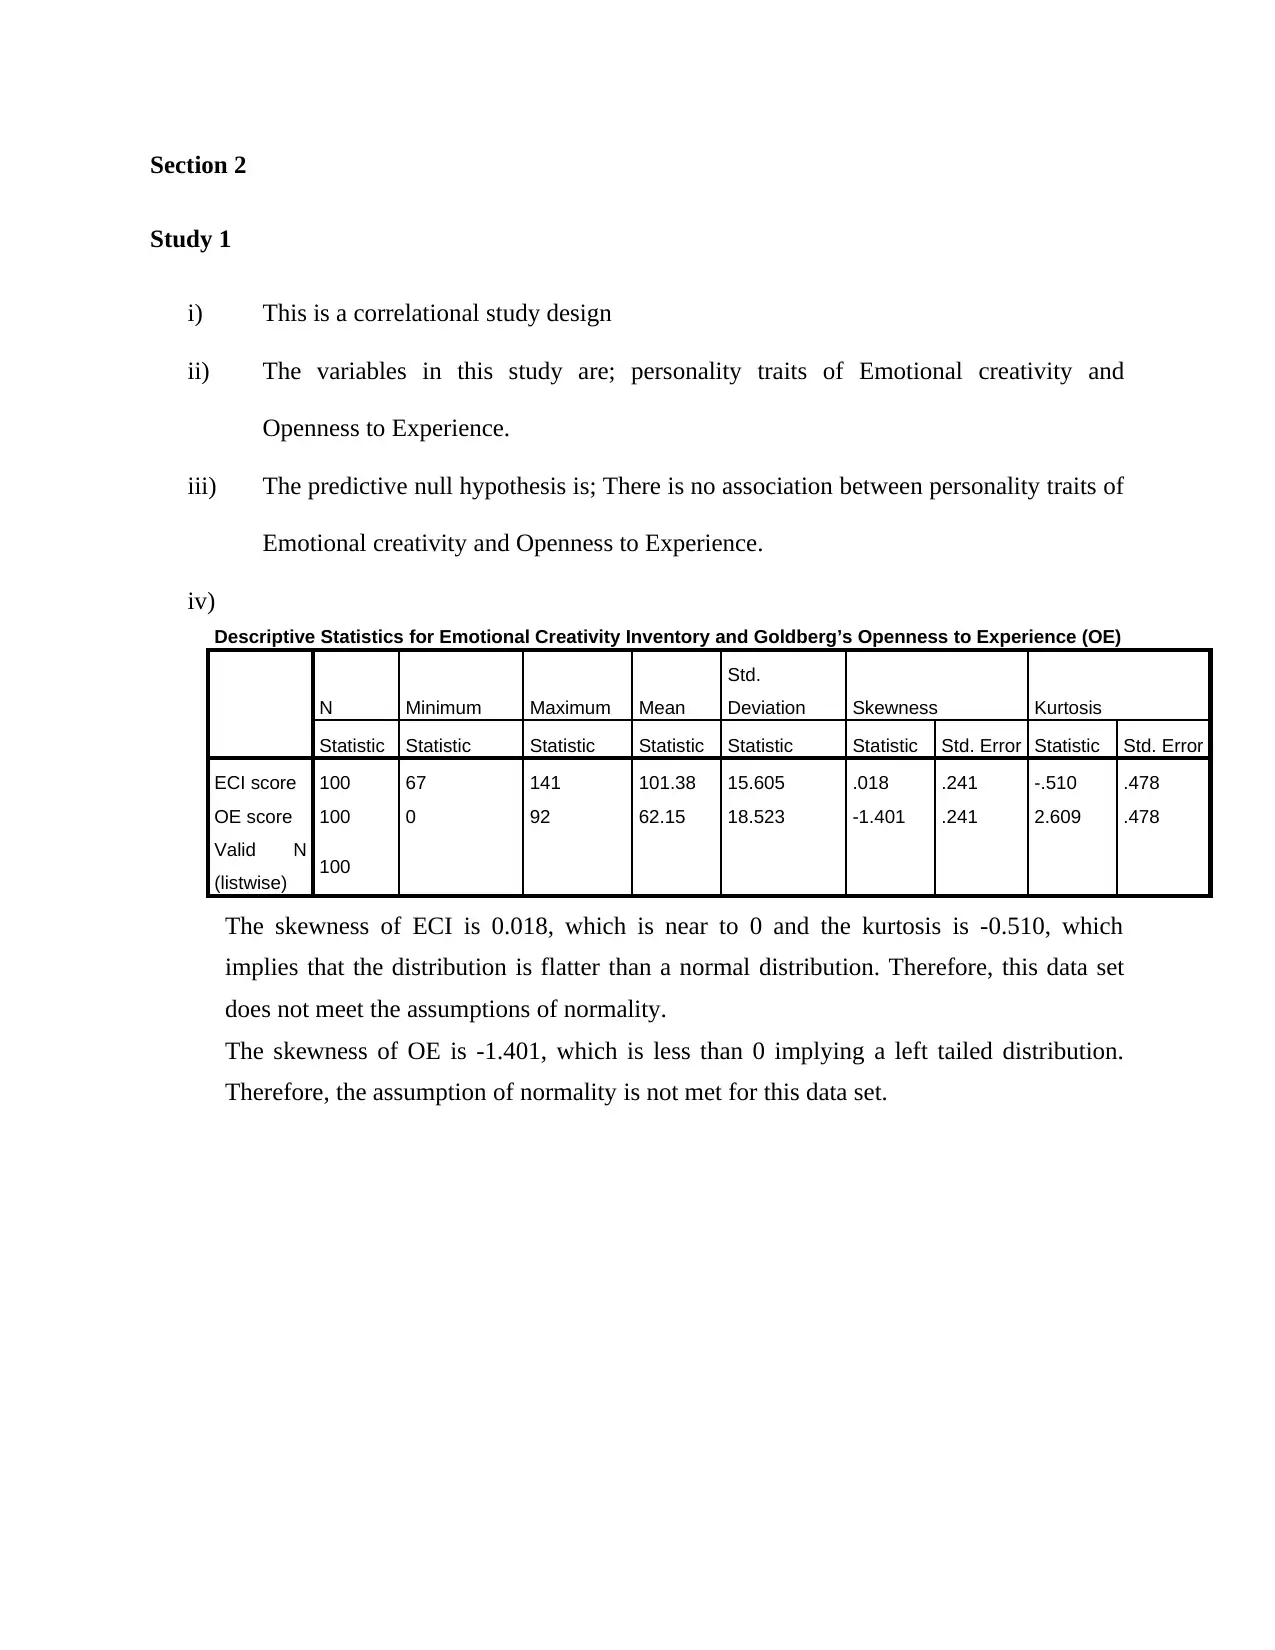
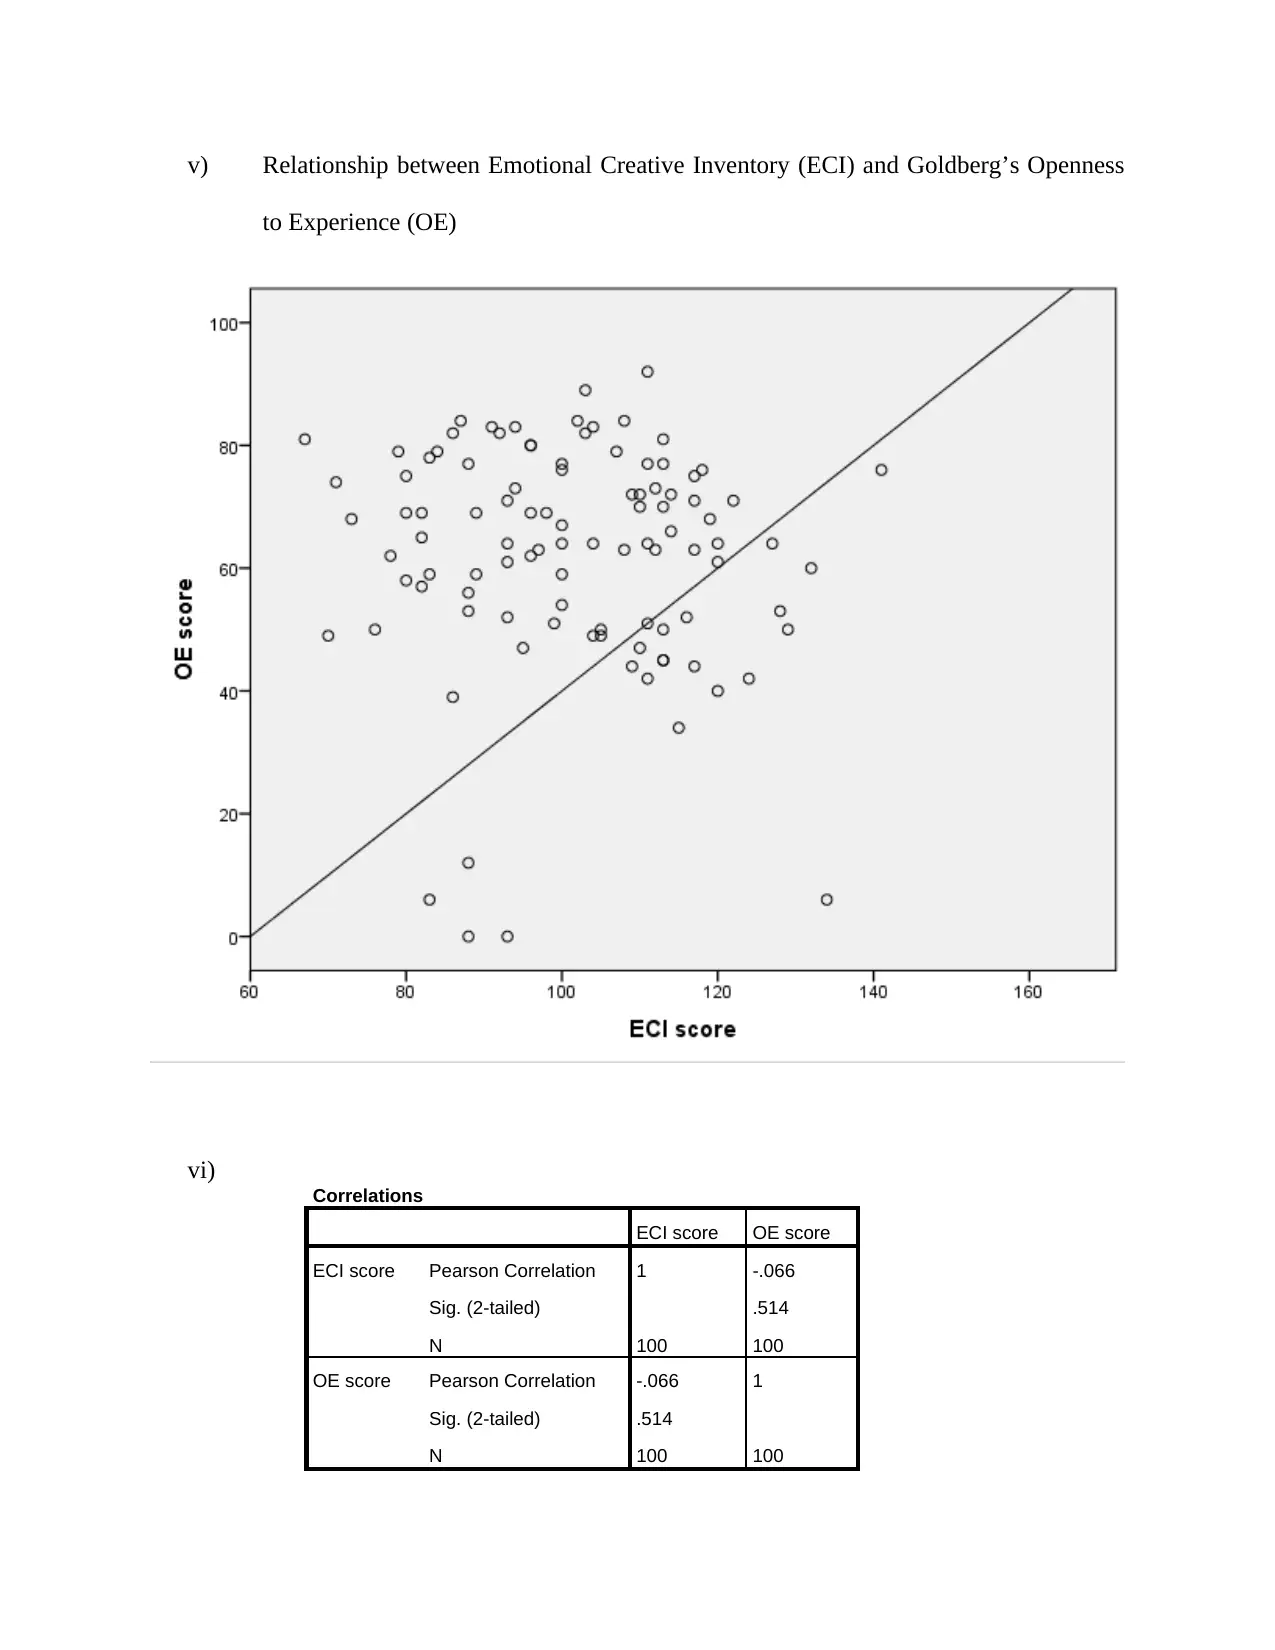
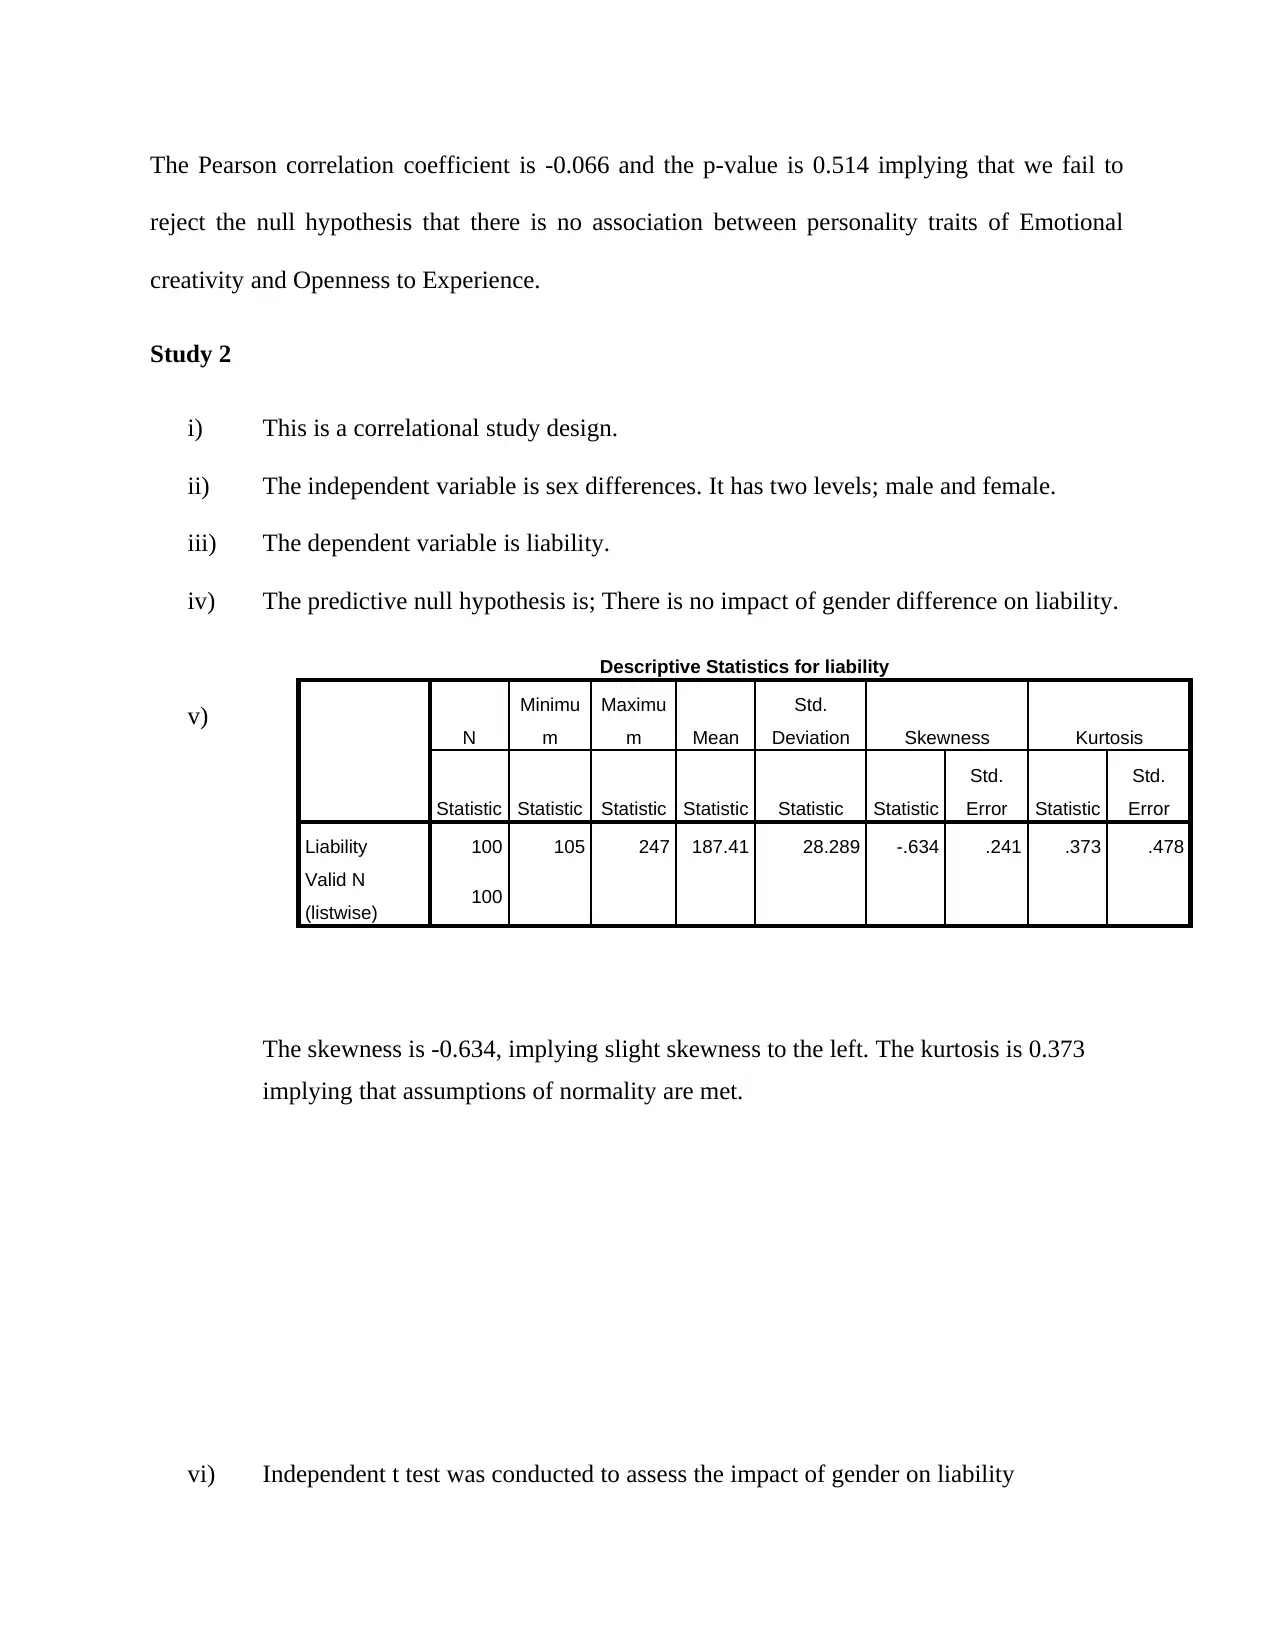
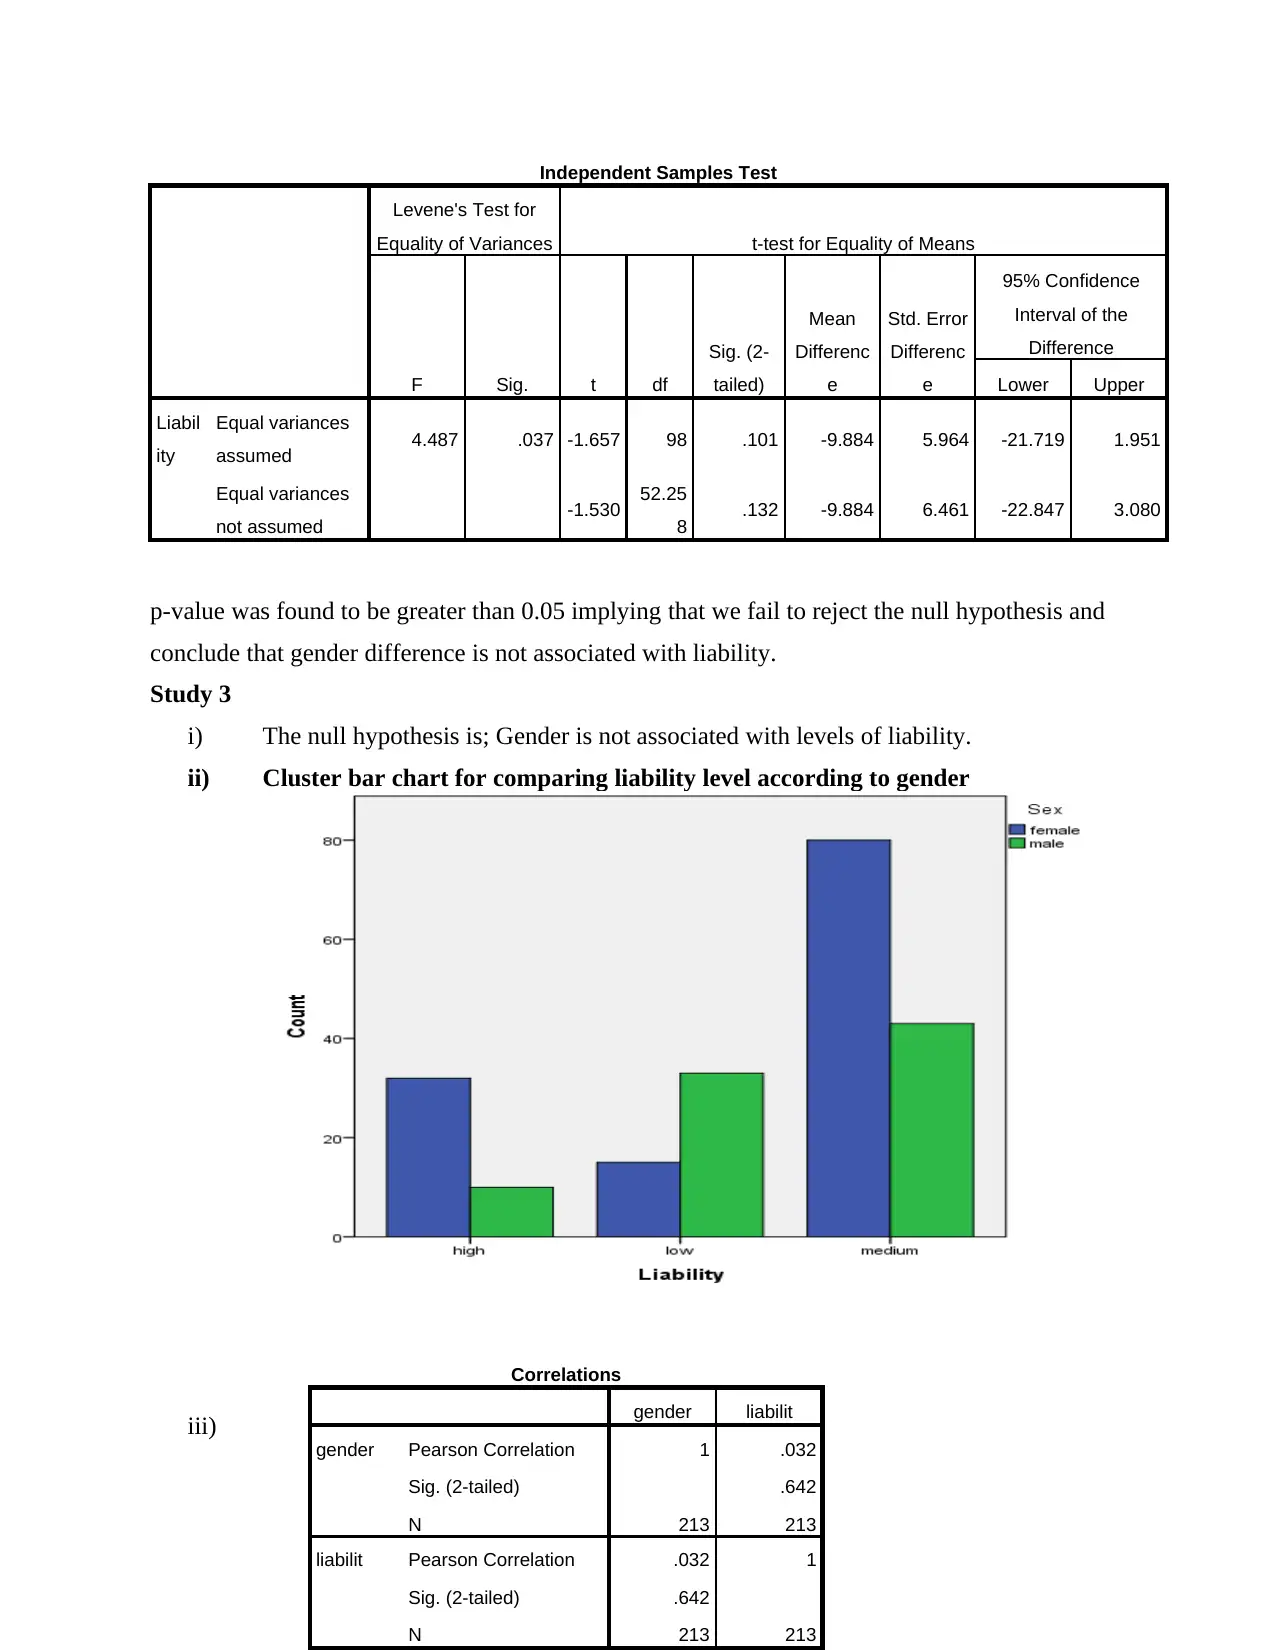
This assignment involves the statistical analysis of three psychological studies. The first study examines the correlation between emotional creativity and openness to experience, finding no significant association. The second study uses an independent t-test to assess the impact of gender on liability, also failing to reject the null hypothesis. The third study investigates the association between gender and levels of liability, rejecting the null hypothesis and finding a positive correlation. Each analysis includes descriptive statistics, hypothesis testing, and interpretations of results, providing a comprehensive overview of statistical methods in psychological research. Desklib offers similar solved assignments and past papers for students.
Document Page
Section 2
Study 1
i) This is a correlational study design
ii) The variables in this study are; personality traits of Emotional creativity and
Openness to Experience.
iii) The predictive null hypothesis is; There is no association between personality traits of
Emotional creativity and Openness to Experience.
iv)
Descriptive Statistics for Emotional Creativity Inventory and Goldberg’s Openness to Experience (OE)
N Minimum Maximum Mean
Std.
Deviation Skewness Kurtosis
Statistic Statistic Statistic Statistic Statistic Statistic Std. Error Statistic Std. Error
ECI score 100 67 141 101.38 15.605 .018 .241 -.510 .478
OE score 100 0 92 62.15 18.523 -1.401 .241 2.609 .478
Valid N
(listwise) 100
The skewness of ECI is 0.018, which is near to 0 and the kurtosis is -0.510, which
implies that the distribution is flatter than a normal distribution. Therefore, this data set
does not meet the assumptions of normality.
The skewness of OE is -1.401, which is less than 0 implying a left tailed distribution.
Therefore, the assumption of normality is not met for this data set.
tabler-icon-diamond-filled.svg

Paraphrase This Document

Need a fresh take? Get an instant paraphrase of this document with our AI Paraphraser
Document Page
v) Relationship between Emotional Creative Inventory (ECI) and Goldberg’s Openness
to Experience (OE)
vi) Correlations
ECI score OE score
ECI score Pearson Correlation 1 -.066
Sig. (2-tailed) .514
N 100 100
OE score Pearson Correlation -.066 1
Sig. (2-tailed) .514
N 100 100
Document Page
The Pearson correlation coefficient is -0.066 and the p-value is 0.514 implying that we fail to
reject the null hypothesis that there is no association between personality traits of Emotional
creativity and Openness to Experience.
Study 2
i) This is a correlational study design.
ii) The independent variable is sex differences. It has two levels; male and female.
iii) The dependent variable is liability.
iv) The predictive null hypothesis is; There is no impact of gender difference on liability.
v)
The skewness is -0.634, implying slight skewness to the left. The kurtosis is 0.373
implying that assumptions of normality are met.
vi) Independent t test was conducted to assess the impact of gender on liability
Descriptive Statistics for liability
N
Minimu
m
Maximu
m Mean
Std.
Deviation Skewness Kurtosis
Statistic Statistic Statistic Statistic Statistic Statistic
Std.
Error Statistic
Std.
Error
Liability 100 105 247 187.41 28.289 -.634 .241 .373 .478
Valid N
(listwise) 100
Document Page
Independent Samples Test
Levene's Test for
Equality of Variances t-test for Equality of Means
F Sig. t df
Sig. (2-
tailed)
Mean
Differenc
e
Std. Error
Differenc
e
95% Confidence
Interval of the
Difference
Lower Upper
Liabil
ity
Equal variances
assumed 4.487 .037 -1.657 98 .101 -9.884 5.964 -21.719 1.951
Equal variances
not assumed -1.530 52.25
8 .132 -9.884 6.461 -22.847 3.080
p-value was found to be greater than 0.05 implying that we fail to reject the null hypothesis and
conclude that gender difference is not associated with liability.
Study 3
i) The null hypothesis is; Gender is not associated with levels of liability.
ii) Cluster bar chart for comparing liability level according to gender
iii)
Correlations
gender liabilit
gender Pearson Correlation 1 .032
Sig. (2-tailed) .642
N 213 213
liabilit Pearson Correlation .032 1
Sig. (2-tailed) .642
N 213 213
tabler-icon-diamond-filled.svg

Paraphrase This Document

Need a fresh take? Get an instant paraphrase of this document with our AI Paraphraser
Document Page
The p-value is less than 0.05 implying that we reject the null hypothesis that gender is
not associated with liability levels.
The Pearson correlation coefficient is positive implying that gender is positively
associated with liability levels.
chevron_up_icon
1 out of 5
circle_padding
hide_on_mobile
zoom_out_icon
[object Object]