Comprehensive Cost Accounting Project: Coca-Cola Product Analysis
VerifiedAdded on 2023/06/09
|19
|3115
|284
Project
AI Summary
This project provides a comprehensive analysis of Coca-Cola's cost accounting, focusing on product costing, gross profit margins, and competitor comparisons with Pepsi. The project details the manufacturing locations, calculates the cost price of Coke, and compares its gross profit margin to Pepsi's. It also explores the value chain concept within Coca-Cola, examining inbound logistics, operations, and marketing. The research section investigates the impact of sugar price fluctuations on the product's cost. Furthermore, the project highlights opportunities and potential challenges in the market. Tables and figures are used to illustrate financial data, and the report concludes with a summary of the key findings, offering insights into the financial health and competitive positioning of Coca-Cola.
Running head: COST ACCOUNTING
Cost Accounting of Coke produced by Coca-Cola Company
Name of the student
Name of the university
Author Note:
Cost Accounting of Coke produced by Coca-Cola Company
Name of the student
Name of the university
Author Note:
Paraphrase This Document
Need a fresh take? Get an instant paraphrase of this document with our AI Paraphraser
2
COST ACCOUNTING
Table of Contents
Introduction......................................................................................................................................4
Place of Manufacturing....................................................................................................................4
Gross Margin and Cost of the Product............................................................................................5
Table No 1: Table of Gross Profit Margin of Coke.....................................................................6
Figure 1: Gross profit margin of Coke........................................................................................6
Table 2: Calculation of the Cost Price of Coke...........................................................................7
Competitors Product........................................................................................................................7
Table 3: Pepsi Gross profit Margin.............................................................................................8
Comparison between Two different Competitors............................................................................8
Table 4: Comparison of Earnings of Coke and Pepsi..................................................................9
Table 5: Comparison of Sales of Coke and Pepsi......................................................................10
Table 6: Comparison of Dividend Increase of Coca-Cola and Pepsi........................................11
Table 7: Comparison of Dividend Growth over the year of Coke and Pepsi............................12
Value Chain Concept.....................................................................................................................12
Figure 2: Coca Cola or Coke the Product..................................................................................13
Research.........................................................................................................................................14
Table No 8: Sugar Price Estimates............................................................................................14
Opportunities.................................................................................................................................15
3
COST ACCOUNTING
Figure 3: Price Maintenance of Coke........................................................................................16
Conclusion.....................................................................................................................................16
References......................................................................................................................................17
⊘ This is a preview!⊘
Do you want full access?
Subscribe today to unlock all pages.
Trusted by 1+ million students worldwide
4
COST ACCOUNTING
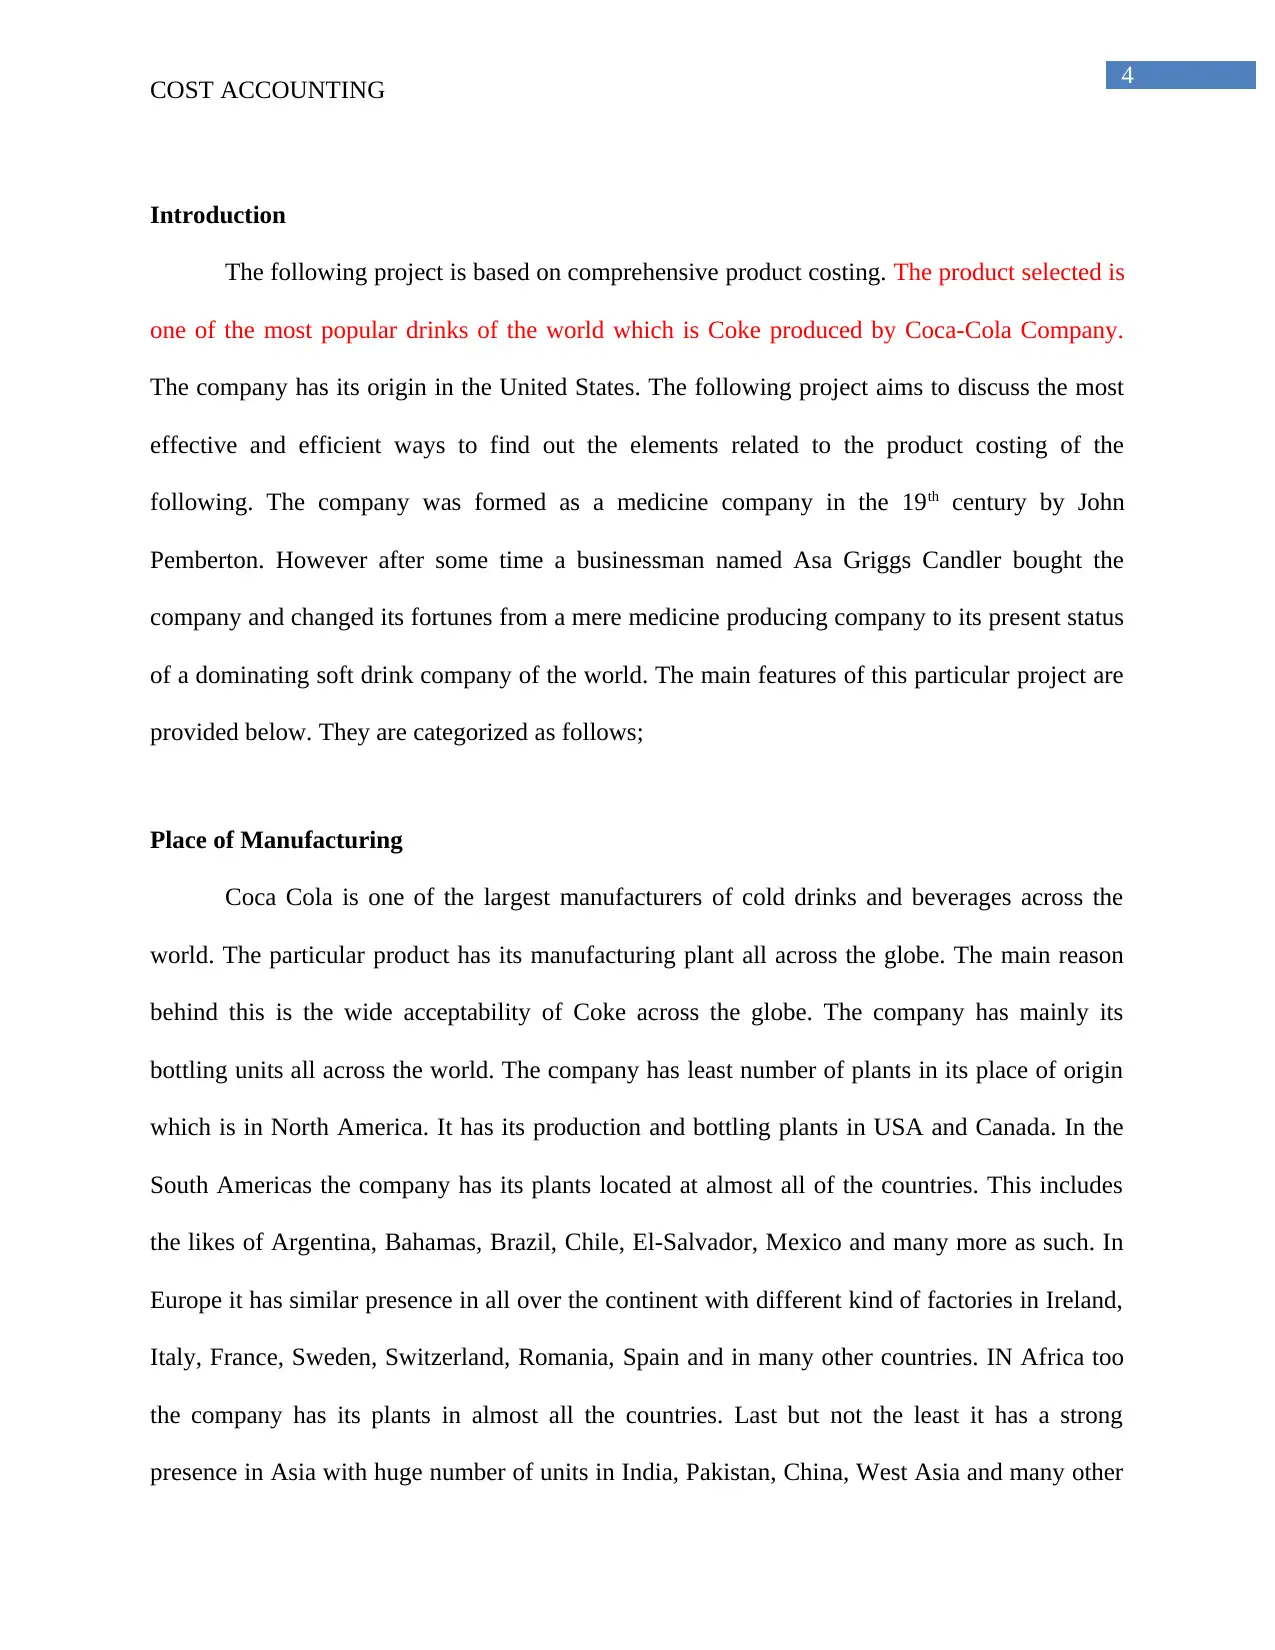
Introduction
The following project is based on comprehensive product costing. The product selected is
one of the most popular drinks of the world which is Coke produced by Coca-Cola Company.
The company has its origin in the United States. The following project aims to discuss the most
effective and efficient ways to find out the elements related to the product costing of the
following. The company was formed as a medicine company in the 19th century by John
Pemberton. However after some time a businessman named Asa Griggs Candler bought the
company and changed its fortunes from a mere medicine producing company to its present status
of a dominating soft drink company of the world. The main features of this particular project are
provided below. They are categorized as follows;
Place of Manufacturing
Coca Cola is one of the largest manufacturers of cold drinks and beverages across the
world. The particular product has its manufacturing plant all across the globe. The main reason
behind this is the wide acceptability of Coke across the globe. The company has mainly its
bottling units all across the world. The company has least number of plants in its place of origin
which is in North America. It has its production and bottling plants in USA and Canada. In the
South Americas the company has its plants located at almost all of the countries. This includes
the likes of Argentina, Bahamas, Brazil, Chile, El-Salvador, Mexico and many more as such. In
Europe it has similar presence in all over the continent with different kind of factories in Ireland,
Italy, France, Sweden, Switzerland, Romania, Spain and in many other countries. IN Africa too
the company has its plants in almost all the countries. Last but not the least it has a strong
presence in Asia with huge number of units in India, Pakistan, China, West Asia and many other
COST ACCOUNTING
Introduction
The following project is based on comprehensive product costing. The product selected is
one of the most popular drinks of the world which is Coke produced by Coca-Cola Company.
The company has its origin in the United States. The following project aims to discuss the most
effective and efficient ways to find out the elements related to the product costing of the
following. The company was formed as a medicine company in the 19th century by John
Pemberton. However after some time a businessman named Asa Griggs Candler bought the
company and changed its fortunes from a mere medicine producing company to its present status
of a dominating soft drink company of the world. The main features of this particular project are
provided below. They are categorized as follows;
Place of Manufacturing
Coca Cola is one of the largest manufacturers of cold drinks and beverages across the
world. The particular product has its manufacturing plant all across the globe. The main reason
behind this is the wide acceptability of Coke across the globe. The company has mainly its
bottling units all across the world. The company has least number of plants in its place of origin
which is in North America. It has its production and bottling plants in USA and Canada. In the
South Americas the company has its plants located at almost all of the countries. This includes
the likes of Argentina, Bahamas, Brazil, Chile, El-Salvador, Mexico and many more as such. In
Europe it has similar presence in all over the continent with different kind of factories in Ireland,
Italy, France, Sweden, Switzerland, Romania, Spain and in many other countries. IN Africa too
the company has its plants in almost all the countries. Last but not the least it has a strong
presence in Asia with huge number of units in India, Pakistan, China, West Asia and many other
Paraphrase This Document
Need a fresh take? Get an instant paraphrase of this document with our AI Paraphraser
5
COST ACCOUNTING
countries. Thus in a short and brief statement its business can be easily identified with the
number of companies it has under its fold and the number of workers working under the
management of the company (Sekaran & Bougie, 2016).
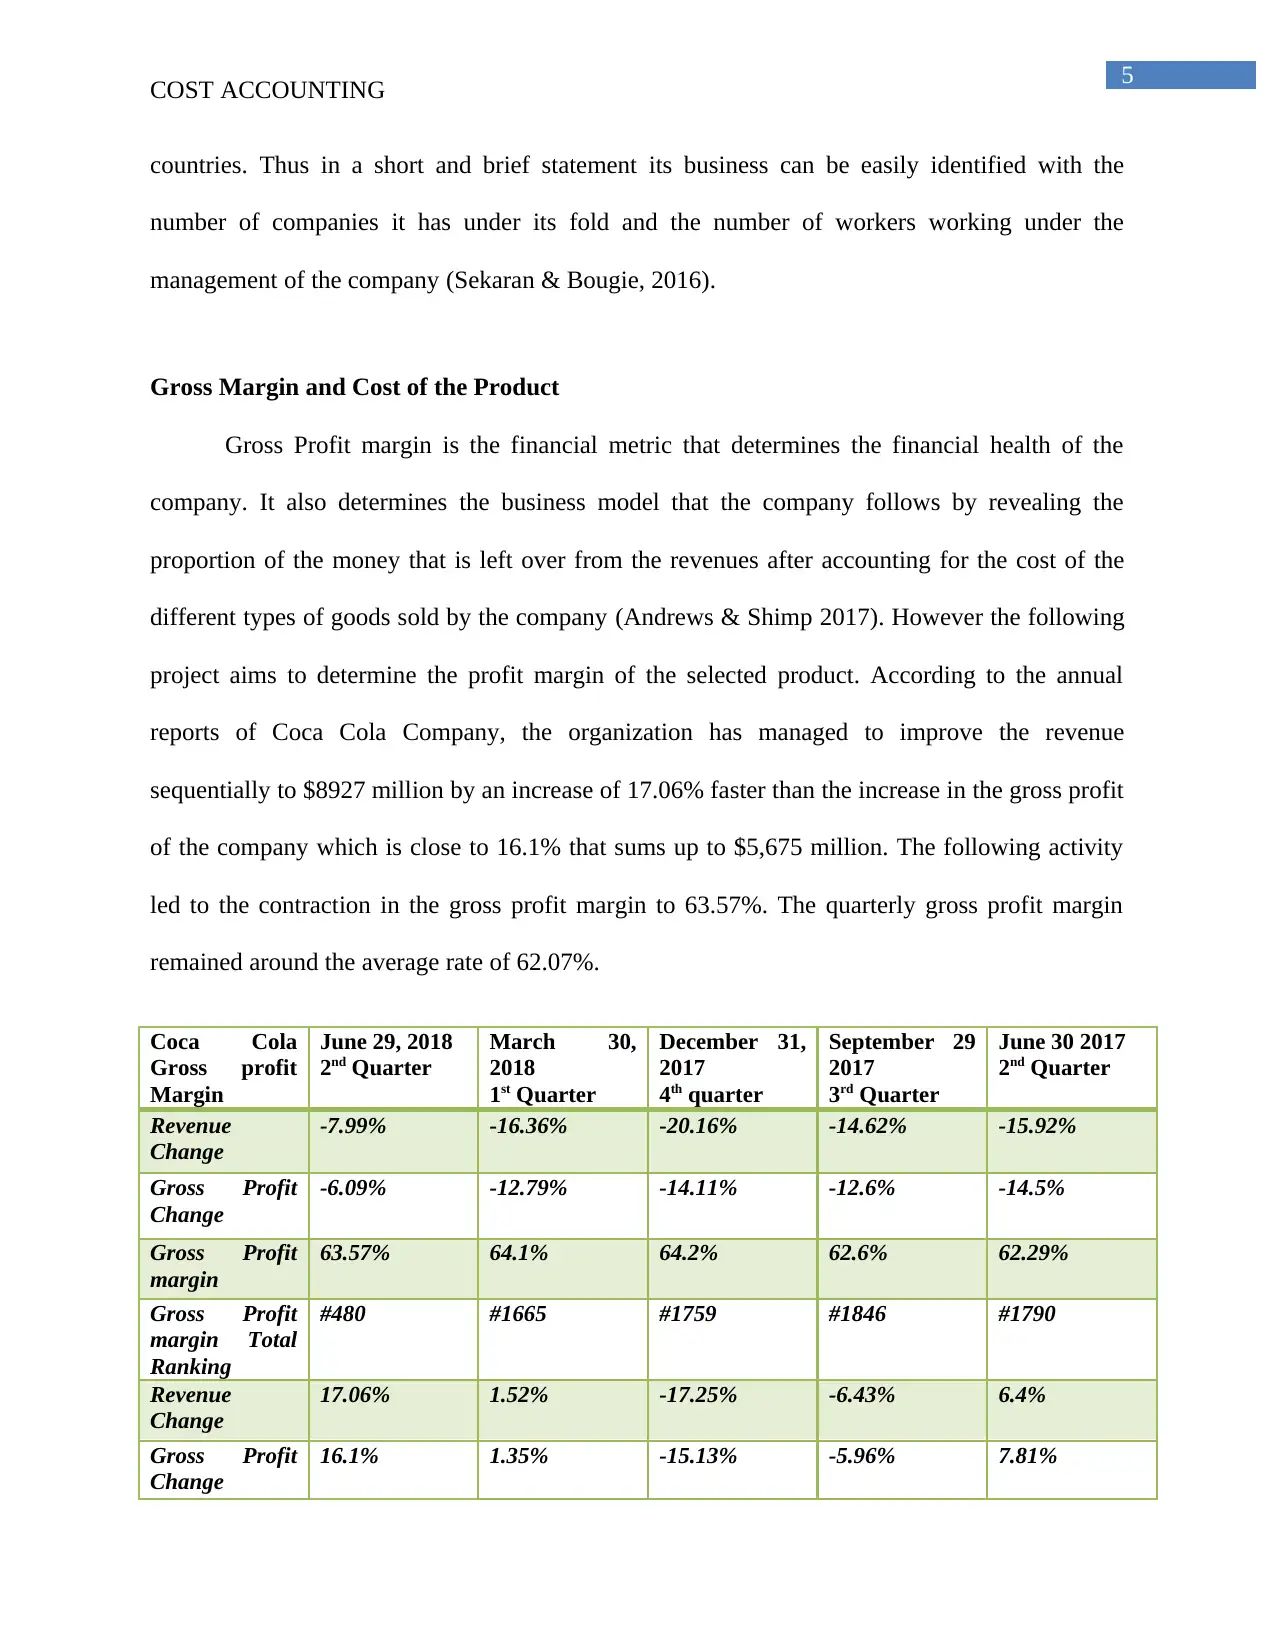
Gross Margin and Cost of the Product
Gross Profit margin is the financial metric that determines the financial health of the
company. It also determines the business model that the company follows by revealing the
proportion of the money that is left over from the revenues after accounting for the cost of the
different types of goods sold by the company (Andrews & Shimp 2017). However the following
project aims to determine the profit margin of the selected product. According to the annual
reports of Coca Cola Company, the organization has managed to improve the revenue
sequentially to $8927 million by an increase of 17.06% faster than the increase in the gross profit
of the company which is close to 16.1% that sums up to $5,675 million. The following activity
led to the contraction in the gross profit margin to 63.57%. The quarterly gross profit margin
remained around the average rate of 62.07%.
Coca Cola
Gross profit
Margin
June 29, 2018
2nd Quarter
March 30,
2018
1st Quarter
December 31,
2017
4th quarter
September 29
2017
3rd Quarter
June 30 2017
2nd Quarter
Revenue
Change
-7.99% -16.36% -20.16% -14.62% -15.92%
Gross Profit
Change
-6.09% -12.79% -14.11% -12.6% -14.5%
Gross Profit
margin
63.57% 64.1% 64.2% 62.6% 62.29%
Gross Profit
margin Total
Ranking
#480 #1665 #1759 #1846 #1790
Revenue
Change
17.06% 1.52% -17.25% -6.43% 6.4%
Gross Profit
Change
16.1% 1.35% -15.13% -5.96% 7.81%
COST ACCOUNTING
countries. Thus in a short and brief statement its business can be easily identified with the
number of companies it has under its fold and the number of workers working under the
management of the company (Sekaran & Bougie, 2016).
Gross Margin and Cost of the Product
Gross Profit margin is the financial metric that determines the financial health of the
company. It also determines the business model that the company follows by revealing the
proportion of the money that is left over from the revenues after accounting for the cost of the
different types of goods sold by the company (Andrews & Shimp 2017). However the following
project aims to determine the profit margin of the selected product. According to the annual
reports of Coca Cola Company, the organization has managed to improve the revenue
sequentially to $8927 million by an increase of 17.06% faster than the increase in the gross profit
of the company which is close to 16.1% that sums up to $5,675 million. The following activity
led to the contraction in the gross profit margin to 63.57%. The quarterly gross profit margin
remained around the average rate of 62.07%.
Coca Cola
Gross profit
Margin
June 29, 2018
2nd Quarter
March 30,
2018
1st Quarter
December 31,
2017
4th quarter
September 29
2017
3rd Quarter
June 30 2017
2nd Quarter
Revenue
Change
-7.99% -16.36% -20.16% -14.62% -15.92%
Gross Profit
Change
-6.09% -12.79% -14.11% -12.6% -14.5%
Gross Profit
margin
63.57% 64.1% 64.2% 62.6% 62.29%
Gross Profit
margin Total
Ranking
#480 #1665 #1759 #1846 #1790
Revenue
Change
17.06% 1.52% -17.25% -6.43% 6.4%
Gross Profit
Change
16.1% 1.35% -15.13% -5.96% 7.81%
6
COST ACCOUNTING
Table No 1: Table of Gross Profit Margin of Coke
Source: (Hansen, 2016)
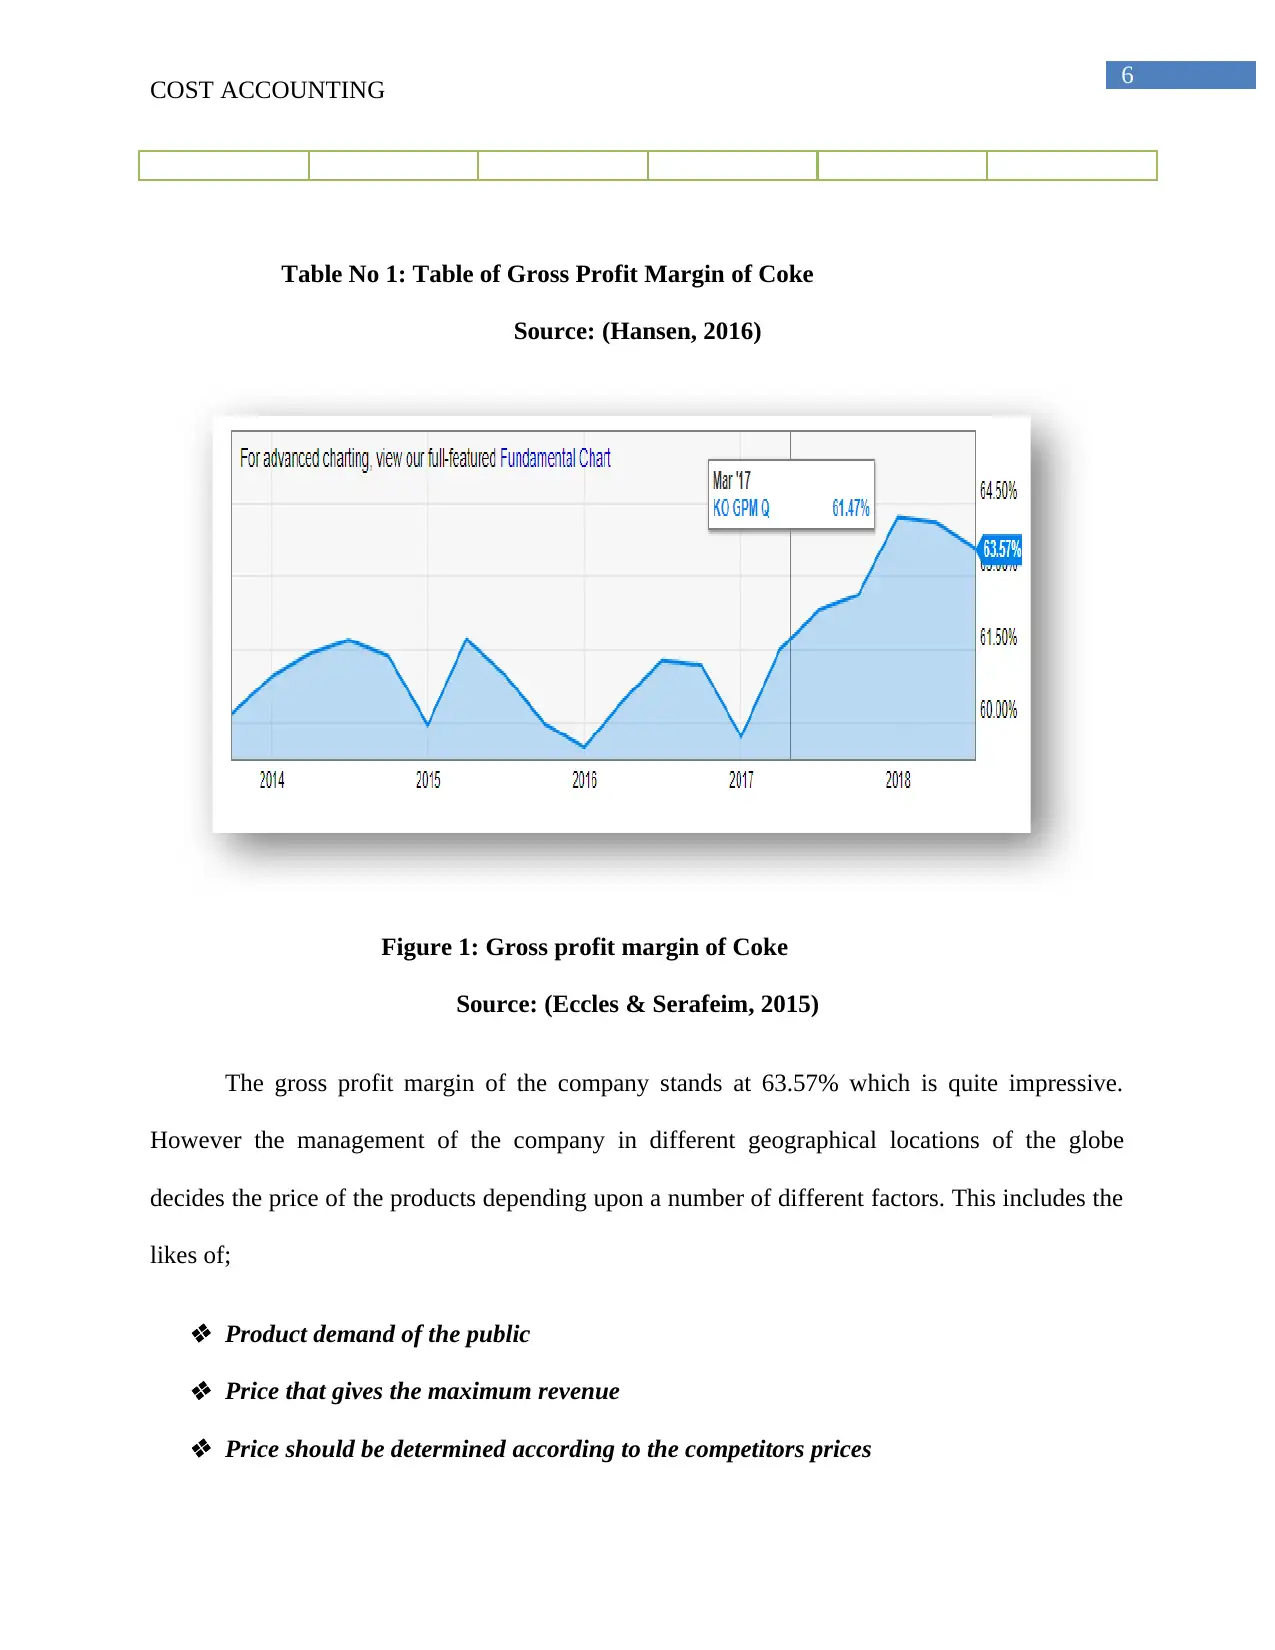
Figure 1: Gross profit margin of Coke
Source: (Eccles & Serafeim, 2015)
The gross profit margin of the company stands at 63.57% which is quite impressive.
However the management of the company in different geographical locations of the globe
decides the price of the products depending upon a number of different factors. This includes the
likes of;
Product demand of the public Price that gives the maximum revenue Price should be determined according to the competitors prices
COST ACCOUNTING
Table No 1: Table of Gross Profit Margin of Coke
Source: (Hansen, 2016)
Figure 1: Gross profit margin of Coke
Source: (Eccles & Serafeim, 2015)
The gross profit margin of the company stands at 63.57% which is quite impressive.
However the management of the company in different geographical locations of the globe
decides the price of the products depending upon a number of different factors. This includes the
likes of;
Product demand of the public Price that gives the maximum revenue Price should be determined according to the competitors prices
⊘ This is a preview!⊘
Do you want full access?
Subscribe today to unlock all pages.
Trusted by 1+ million students worldwide
7
COST ACCOUNTING
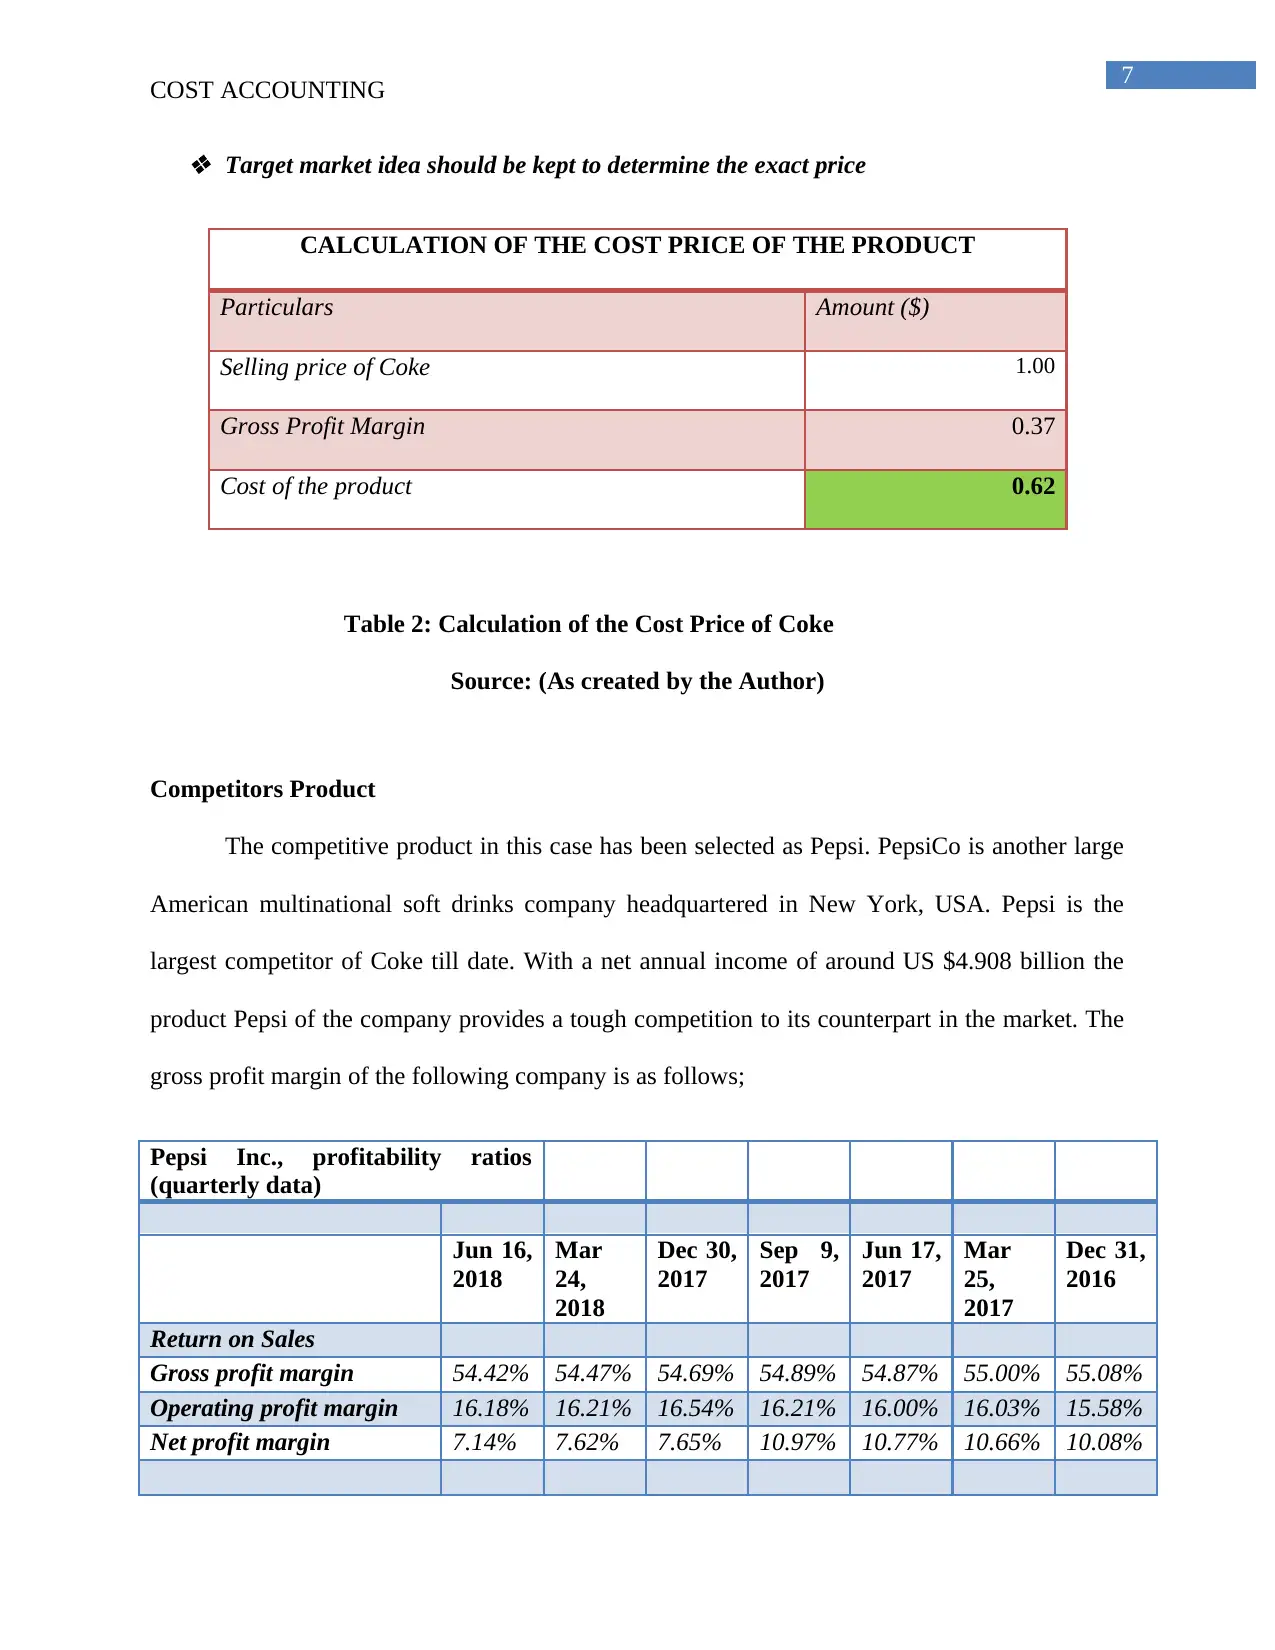
Target market idea should be kept to determine the exact price
CALCULATION OF THE COST PRICE OF THE PRODUCT
Particulars Amount ($)
Selling price of Coke 1.00
Gross Profit Margin 0.37
Cost of the product 0.62
Table 2: Calculation of the Cost Price of Coke
Source: (As created by the Author)
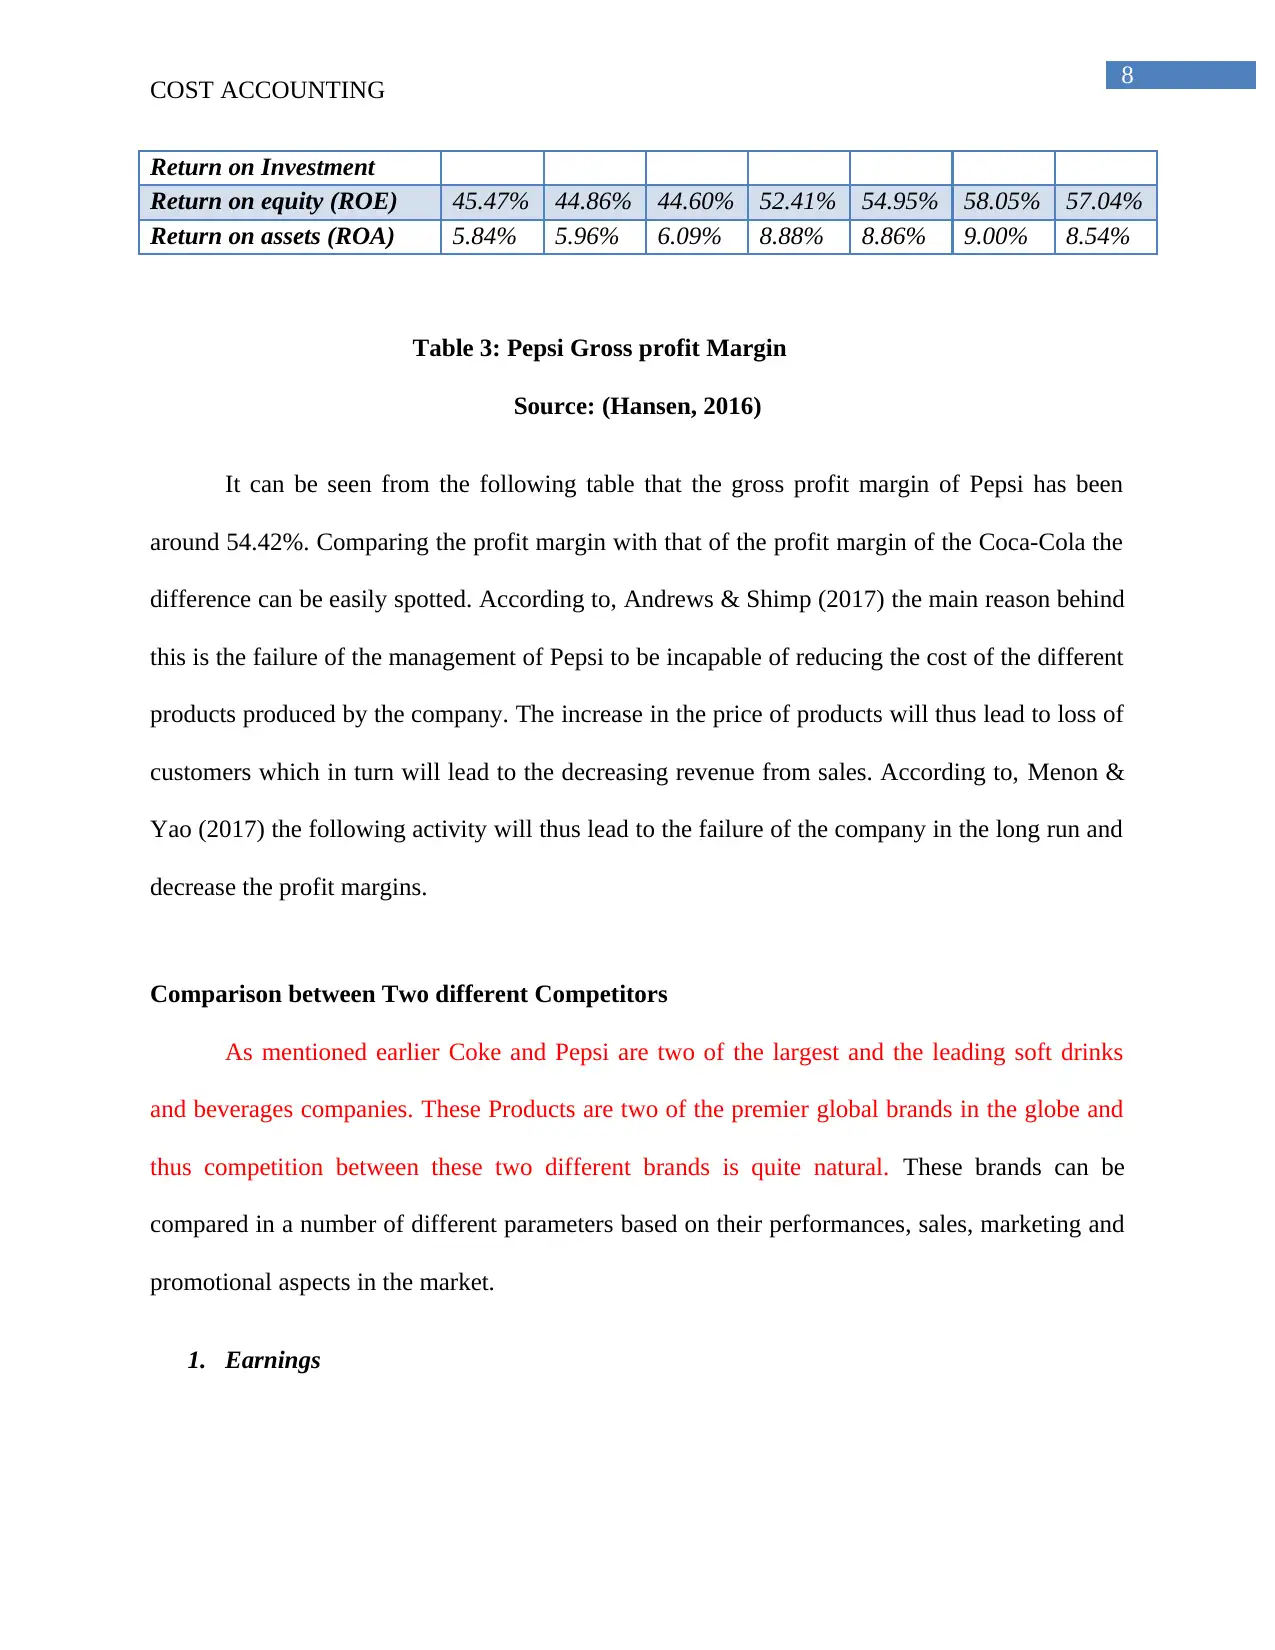
Competitors Product
The competitive product in this case has been selected as Pepsi. PepsiCo is another large
American multinational soft drinks company headquartered in New York, USA. Pepsi is the
largest competitor of Coke till date. With a net annual income of around US $4.908 billion the
product Pepsi of the company provides a tough competition to its counterpart in the market. The
gross profit margin of the following company is as follows;
Pepsi Inc., profitability ratios
(quarterly data)
Jun 16,
2018
Mar
24,
2018
Dec 30,
2017
Sep 9,
2017
Jun 17,
2017
Mar
25,
2017
Dec 31,
2016
Return on Sales
Gross profit margin 54.42% 54.47% 54.69% 54.89% 54.87% 55.00% 55.08%
Operating profit margin 16.18% 16.21% 16.54% 16.21% 16.00% 16.03% 15.58%
Net profit margin 7.14% 7.62% 7.65% 10.97% 10.77% 10.66% 10.08%
COST ACCOUNTING
Target market idea should be kept to determine the exact price
CALCULATION OF THE COST PRICE OF THE PRODUCT
Particulars Amount ($)
Selling price of Coke 1.00
Gross Profit Margin 0.37
Cost of the product 0.62
Table 2: Calculation of the Cost Price of Coke
Source: (As created by the Author)
Competitors Product
The competitive product in this case has been selected as Pepsi. PepsiCo is another large
American multinational soft drinks company headquartered in New York, USA. Pepsi is the
largest competitor of Coke till date. With a net annual income of around US $4.908 billion the
product Pepsi of the company provides a tough competition to its counterpart in the market. The
gross profit margin of the following company is as follows;
Pepsi Inc., profitability ratios
(quarterly data)
Jun 16,
2018
Mar
24,
2018
Dec 30,
2017
Sep 9,
2017
Jun 17,
2017
Mar
25,
2017
Dec 31,
2016
Return on Sales
Gross profit margin 54.42% 54.47% 54.69% 54.89% 54.87% 55.00% 55.08%
Operating profit margin 16.18% 16.21% 16.54% 16.21% 16.00% 16.03% 15.58%
Net profit margin 7.14% 7.62% 7.65% 10.97% 10.77% 10.66% 10.08%
Paraphrase This Document
Need a fresh take? Get an instant paraphrase of this document with our AI Paraphraser
8
COST ACCOUNTING
Return on Investment
Return on equity (ROE) 45.47% 44.86% 44.60% 52.41% 54.95% 58.05% 57.04%
Return on assets (ROA) 5.84% 5.96% 6.09% 8.88% 8.86% 9.00% 8.54%
Table 3: Pepsi Gross profit Margin
Source: (Hansen, 2016)
It can be seen from the following table that the gross profit margin of Pepsi has been
around 54.42%. Comparing the profit margin with that of the profit margin of the Coca-Cola the
difference can be easily spotted. According to, Andrews & Shimp (2017) the main reason behind
this is the failure of the management of Pepsi to be incapable of reducing the cost of the different
products produced by the company. The increase in the price of products will thus lead to loss of
customers which in turn will lead to the decreasing revenue from sales. According to, Menon &
Yao (2017) the following activity will thus lead to the failure of the company in the long run and
decrease the profit margins.
Comparison between Two different Competitors
As mentioned earlier Coke and Pepsi are two of the largest and the leading soft drinks
and beverages companies. These Products are two of the premier global brands in the globe and
thus competition between these two different brands is quite natural. These brands can be
compared in a number of different parameters based on their performances, sales, marketing and
promotional aspects in the market.
1. Earnings
9
COST ACCOUNTING
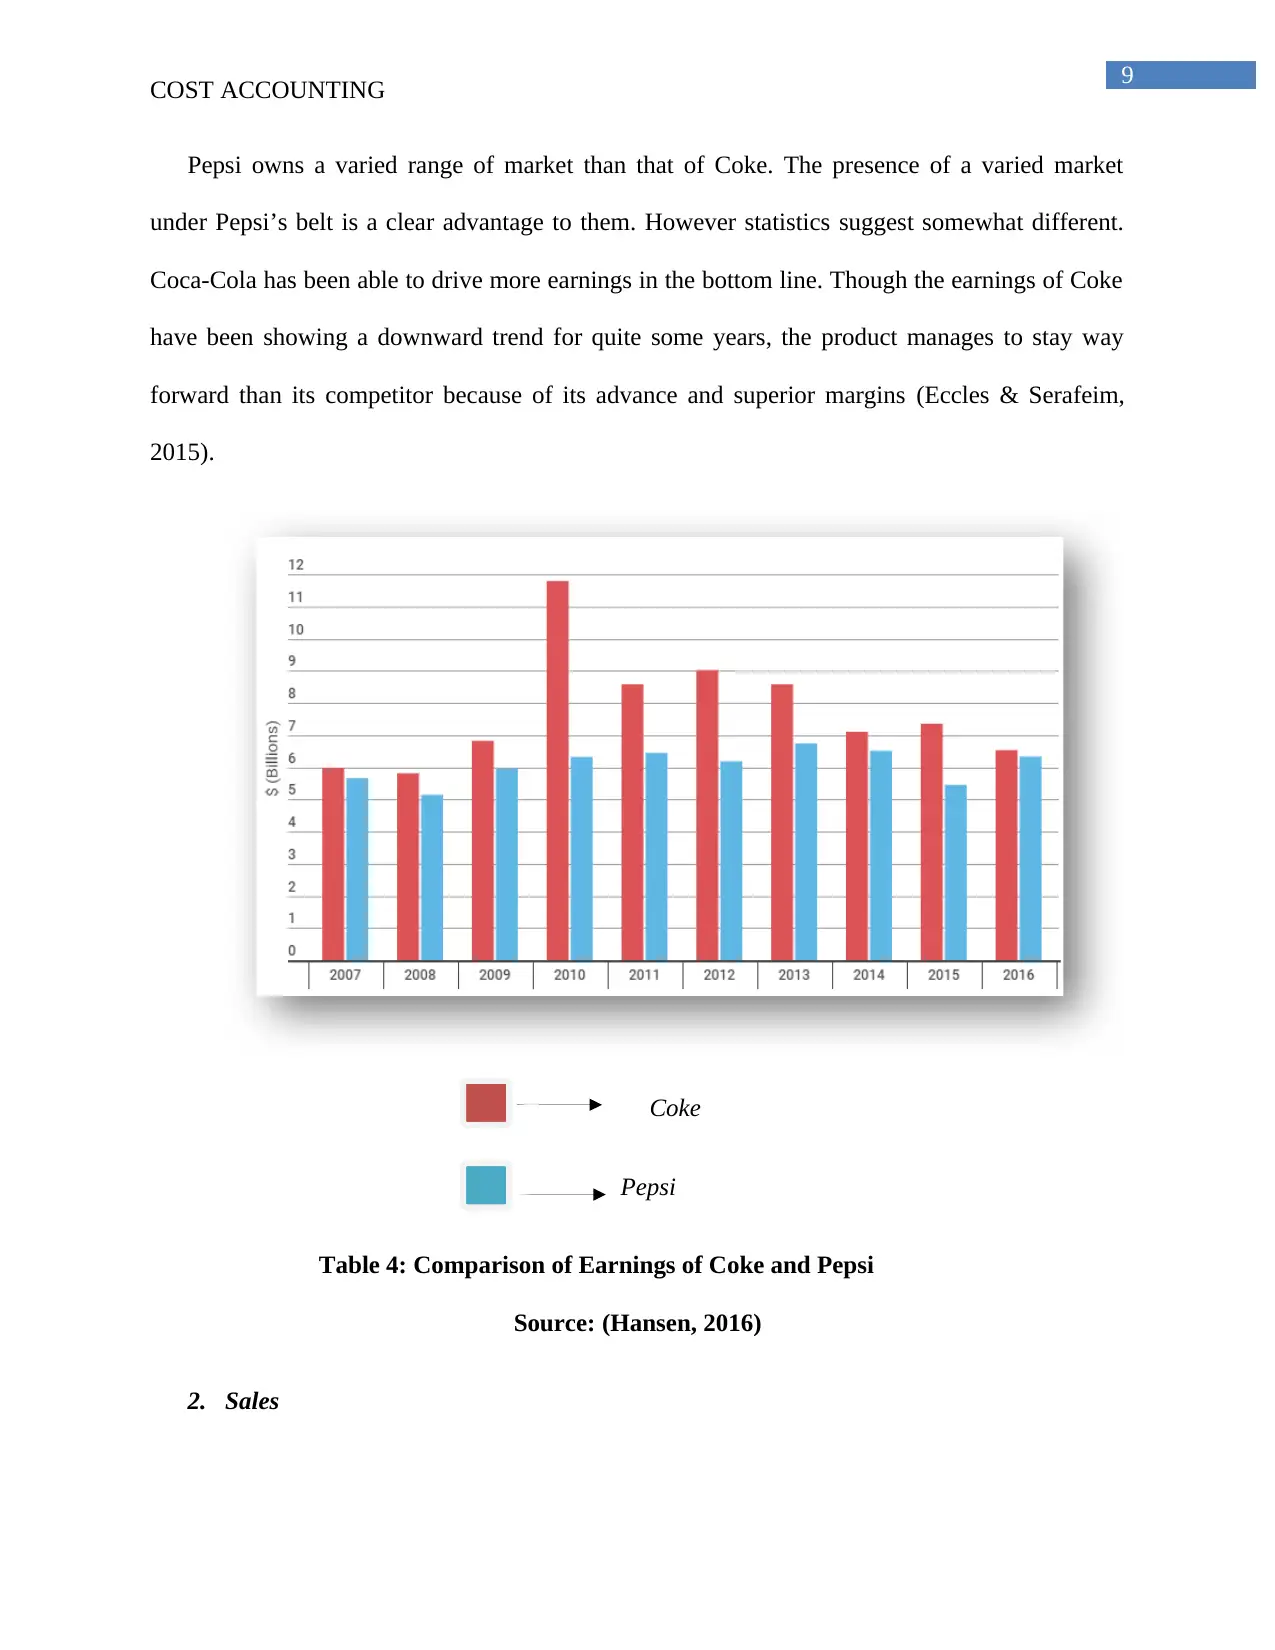
Pepsi owns a varied range of market than that of Coke. The presence of a varied market
under Pepsi’s belt is a clear advantage to them. However statistics suggest somewhat different.
Coca-Cola has been able to drive more earnings in the bottom line. Though the earnings of Coke
have been showing a downward trend for quite some years, the product manages to stay way
forward than its competitor because of its advance and superior margins (Eccles & Serafeim,
2015).
Coke
Pepsi
Table 4: Comparison of Earnings of Coke and Pepsi
Source: (Hansen, 2016)
2. Sales
COST ACCOUNTING
Pepsi owns a varied range of market than that of Coke. The presence of a varied market
under Pepsi’s belt is a clear advantage to them. However statistics suggest somewhat different.
Coca-Cola has been able to drive more earnings in the bottom line. Though the earnings of Coke
have been showing a downward trend for quite some years, the product manages to stay way
forward than its competitor because of its advance and superior margins (Eccles & Serafeim,
2015).
Coke
Pepsi
Table 4: Comparison of Earnings of Coke and Pepsi
Source: (Hansen, 2016)
2. Sales
⊘ This is a preview!⊘
Do you want full access?
Subscribe today to unlock all pages.
Trusted by 1+ million students worldwide
10
COST ACCOUNTING
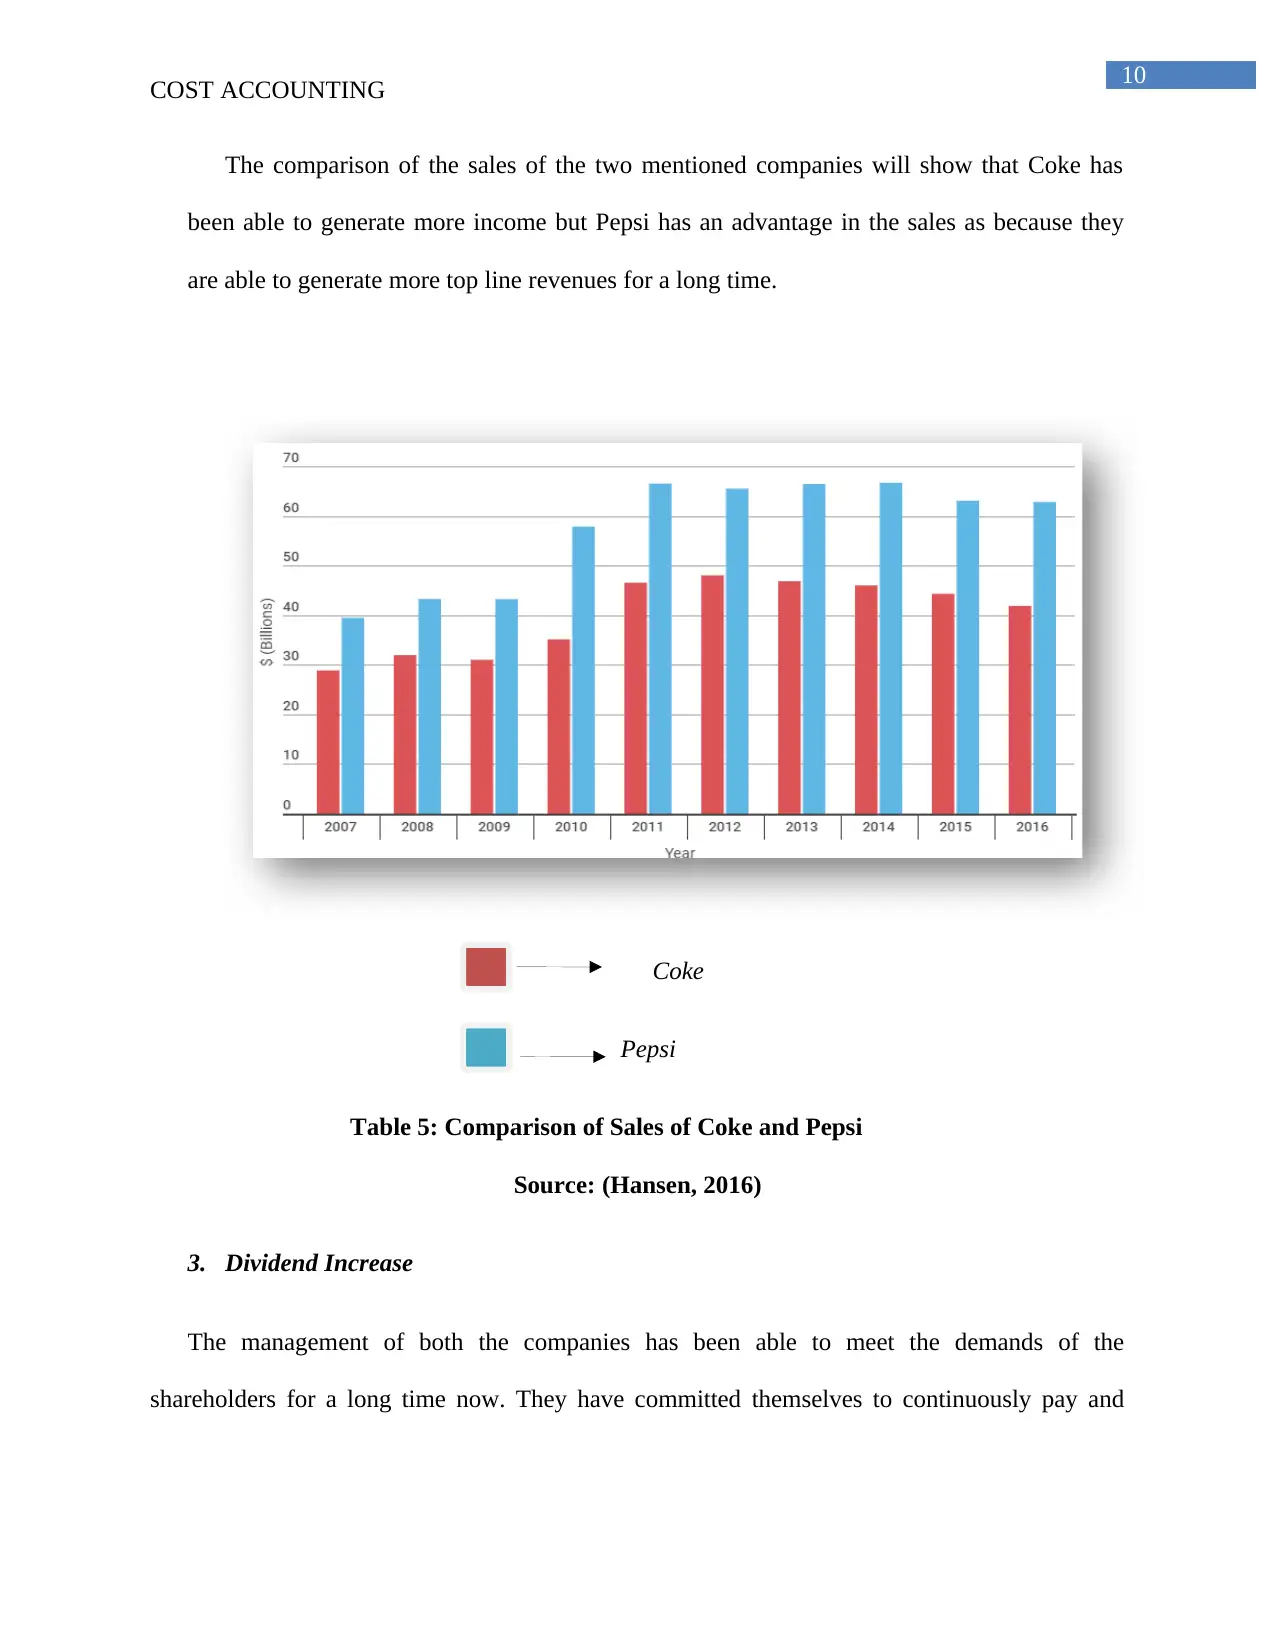
The comparison of the sales of the two mentioned companies will show that Coke has
been able to generate more income but Pepsi has an advantage in the sales as because they
are able to generate more top line revenues for a long time.
Coke
Pepsi
Table 5: Comparison of Sales of Coke and Pepsi
Source: (Hansen, 2016)
3. Dividend Increase
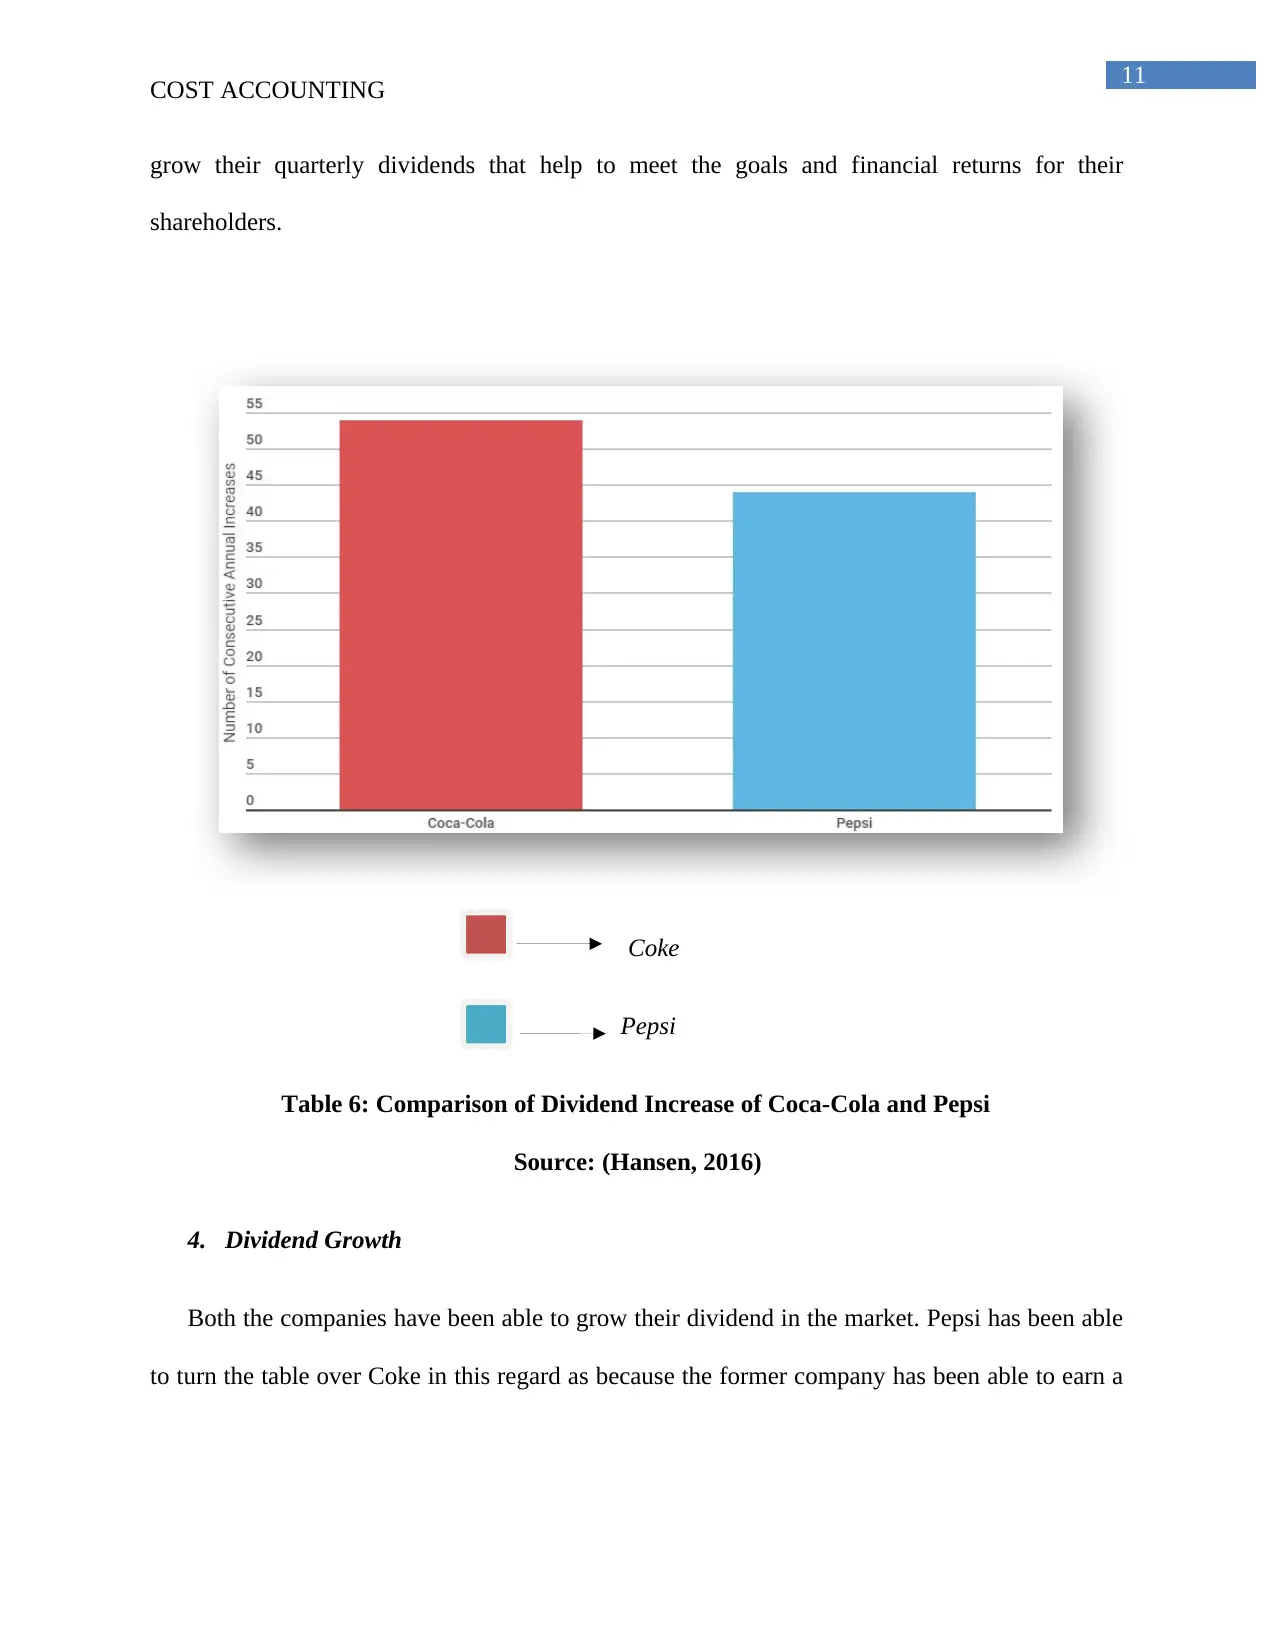
The management of both the companies has been able to meet the demands of the
shareholders for a long time now. They have committed themselves to continuously pay and
COST ACCOUNTING
The comparison of the sales of the two mentioned companies will show that Coke has
been able to generate more income but Pepsi has an advantage in the sales as because they
are able to generate more top line revenues for a long time.
Coke
Pepsi
Table 5: Comparison of Sales of Coke and Pepsi
Source: (Hansen, 2016)
3. Dividend Increase
The management of both the companies has been able to meet the demands of the
shareholders for a long time now. They have committed themselves to continuously pay and
Paraphrase This Document
Need a fresh take? Get an instant paraphrase of this document with our AI Paraphraser
11
COST ACCOUNTING
grow their quarterly dividends that help to meet the goals and financial returns for their
shareholders.
Coke
Pepsi
Table 6: Comparison of Dividend Increase of Coca-Cola and Pepsi
Source: (Hansen, 2016)
4. Dividend Growth
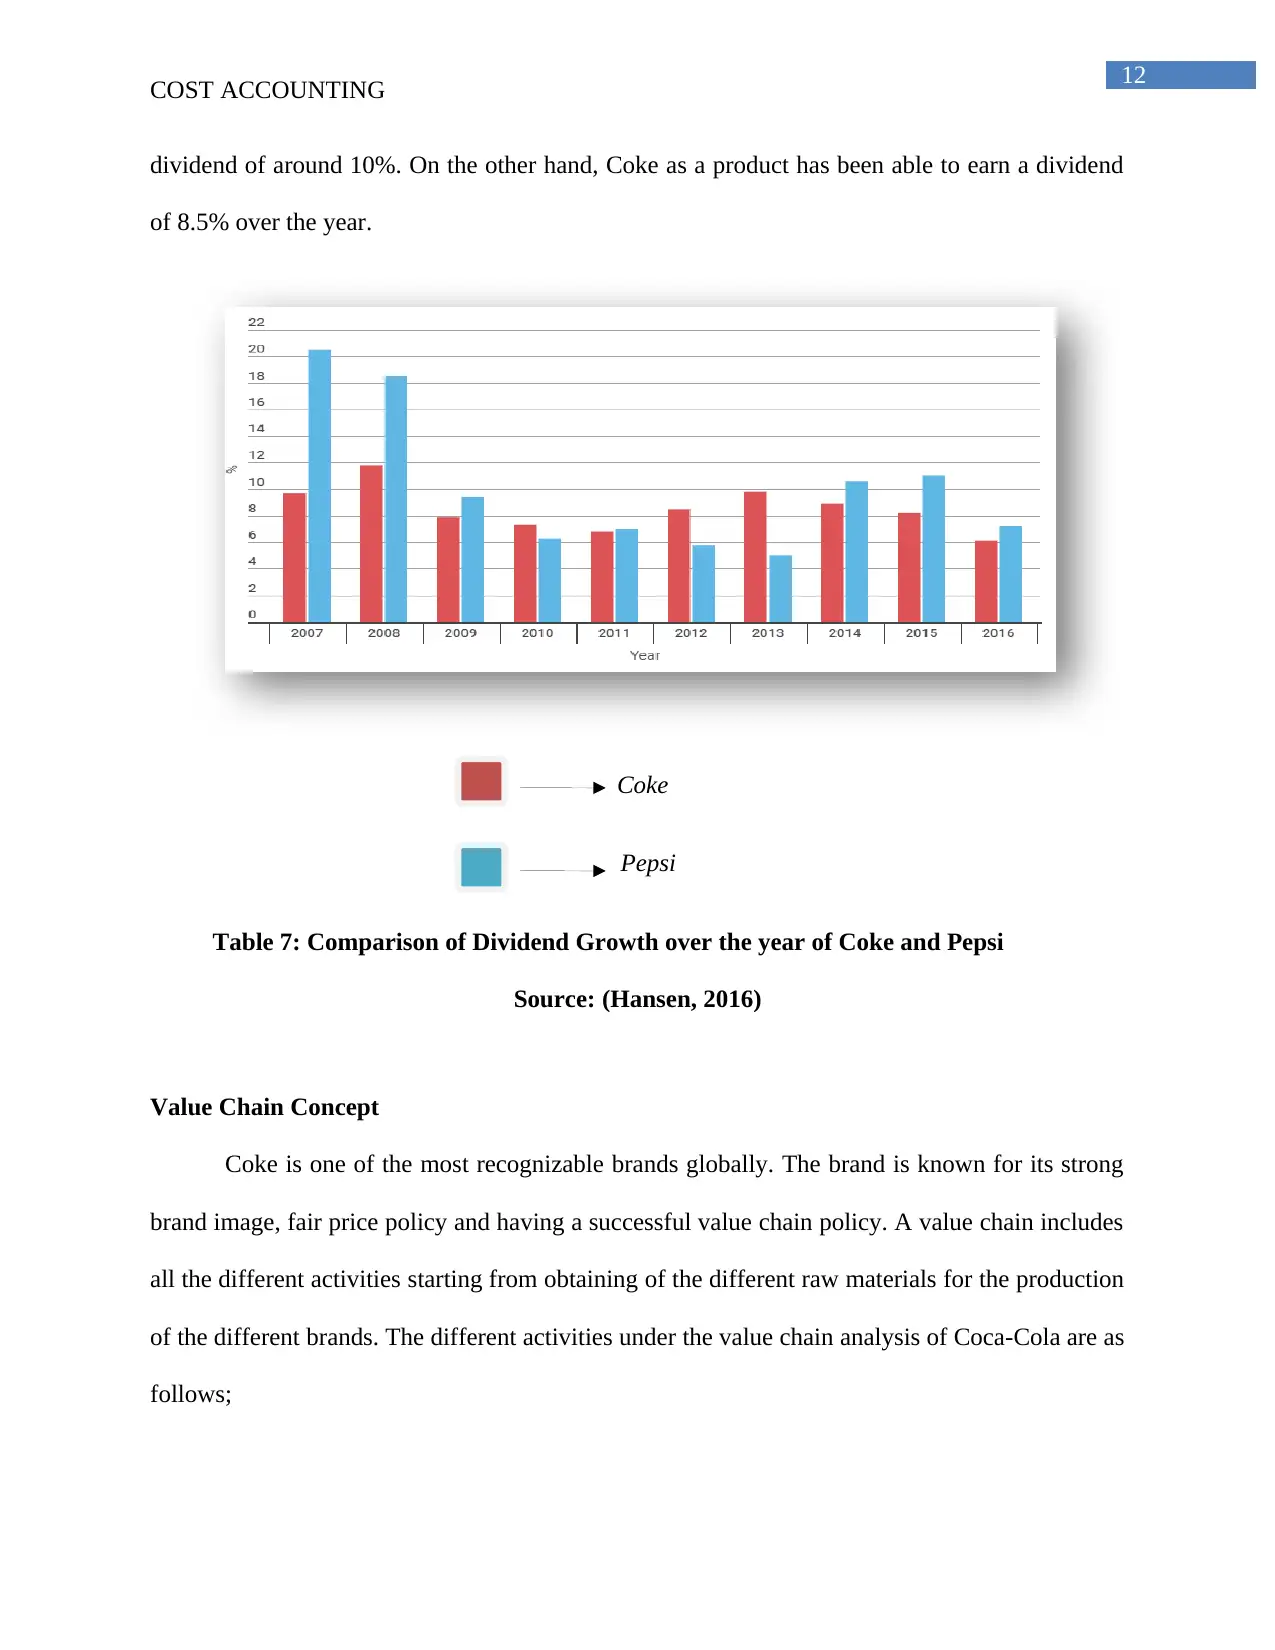
Both the companies have been able to grow their dividend in the market. Pepsi has been able
to turn the table over Coke in this regard as because the former company has been able to earn a
COST ACCOUNTING
grow their quarterly dividends that help to meet the goals and financial returns for their
shareholders.
Coke
Pepsi
Table 6: Comparison of Dividend Increase of Coca-Cola and Pepsi
Source: (Hansen, 2016)
4. Dividend Growth
Both the companies have been able to grow their dividend in the market. Pepsi has been able
to turn the table over Coke in this regard as because the former company has been able to earn a
12
COST ACCOUNTING
dividend of around 10%. On the other hand, Coke as a product has been able to earn a dividend
of 8.5% over the year.
Coke
Pepsi
Table 7: Comparison of Dividend Growth over the year of Coke and Pepsi
Source: (Hansen, 2016)
Value Chain Concept
Coke is one of the most recognizable brands globally. The brand is known for its strong
brand image, fair price policy and having a successful value chain policy. A value chain includes
all the different activities starting from obtaining of the different raw materials for the production
of the different brands. The different activities under the value chain analysis of Coca-Cola are as
follows;
⊘ This is a preview!⊘
Do you want full access?
Subscribe today to unlock all pages.
Trusted by 1+ million students worldwide
1 out of 19
Related Documents


Your All-in-One AI-Powered Toolkit for Academic Success.
+13062052269
info@desklib.com
Available 24*7 on WhatsApp / Email
![[object Object]](/_next/static/media/star-bottom.7253800d.svg)
Unlock your academic potential
Copyright © 2020–2025 A2Z Services. All Rights Reserved. Developed and managed by ZUCOL.