Cost Accounting & Management Control: Pelican Instruments Analysis
VerifiedAdded on 2023/06/15
|7
|1359
|251
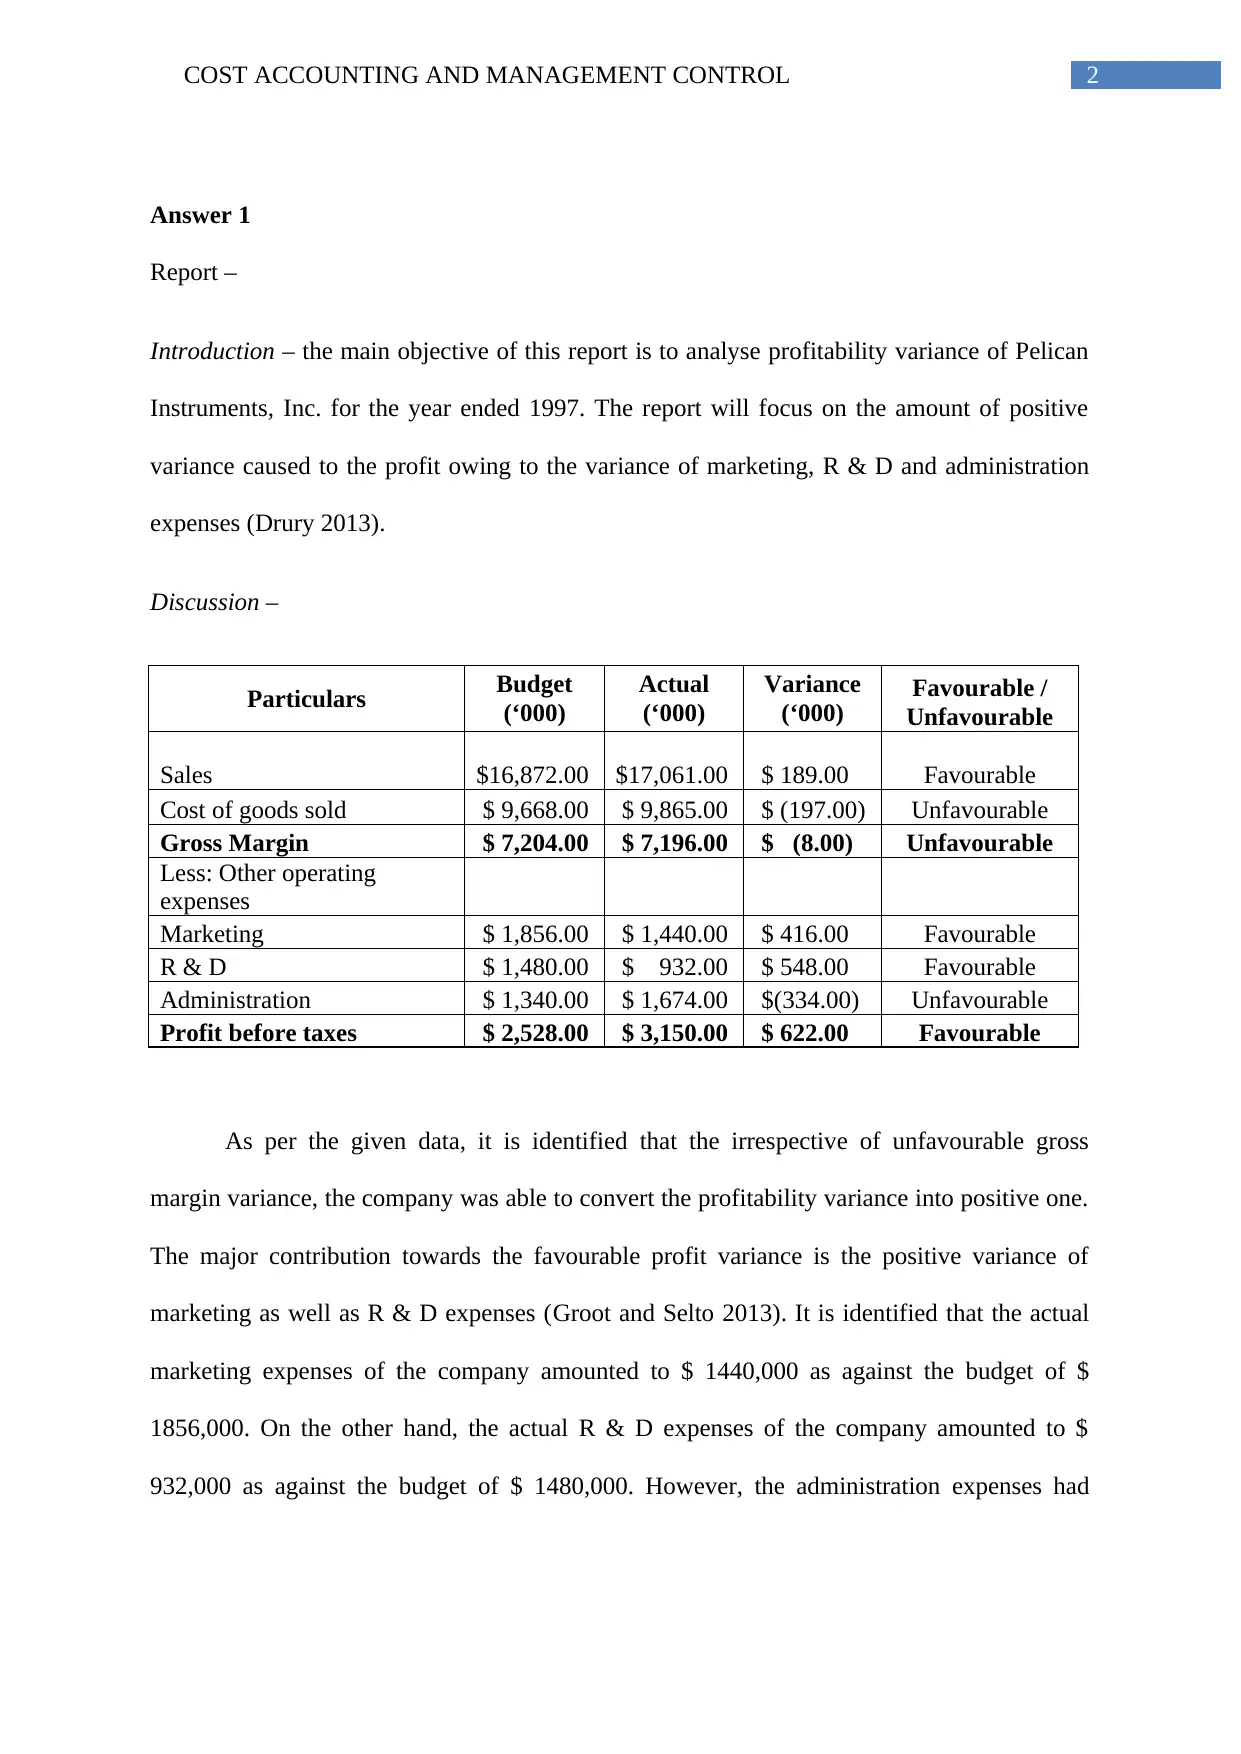
Report
AI Summary
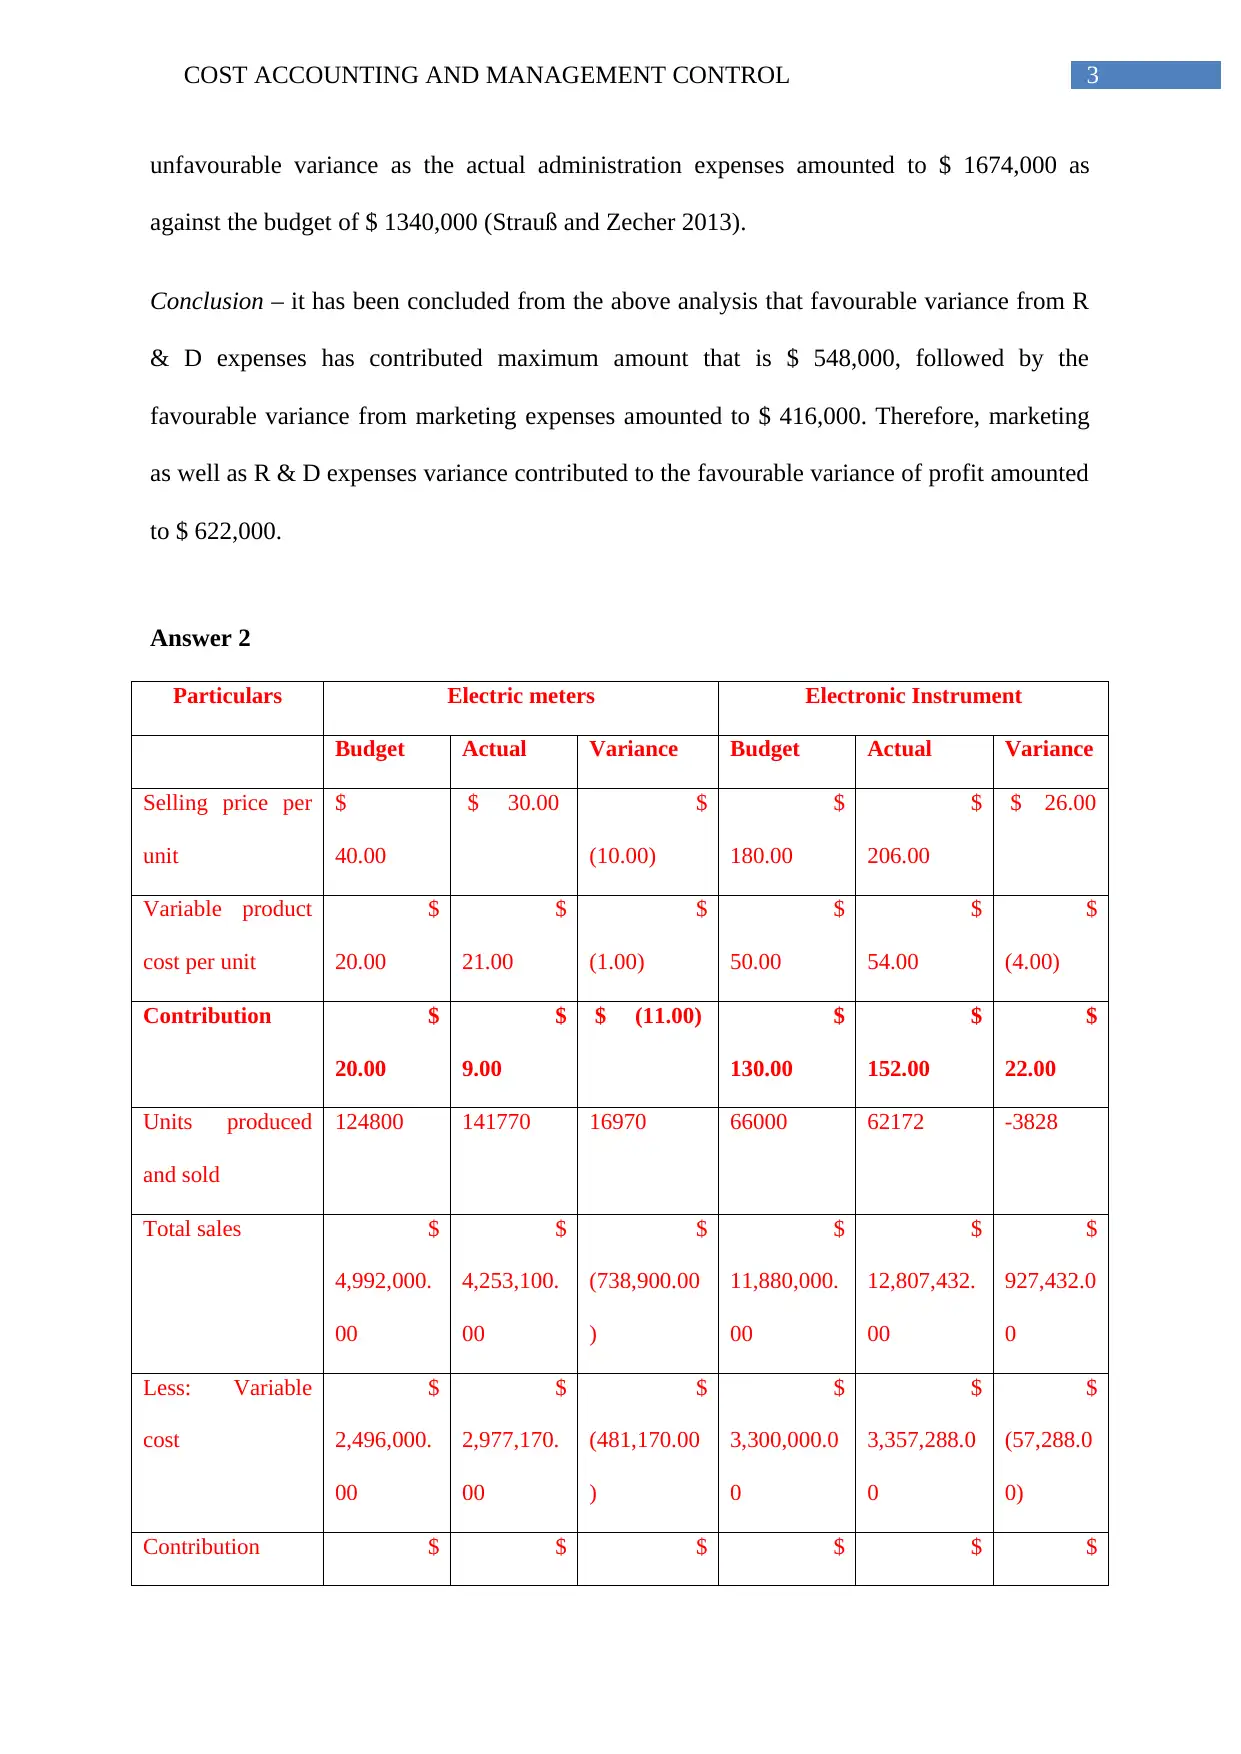
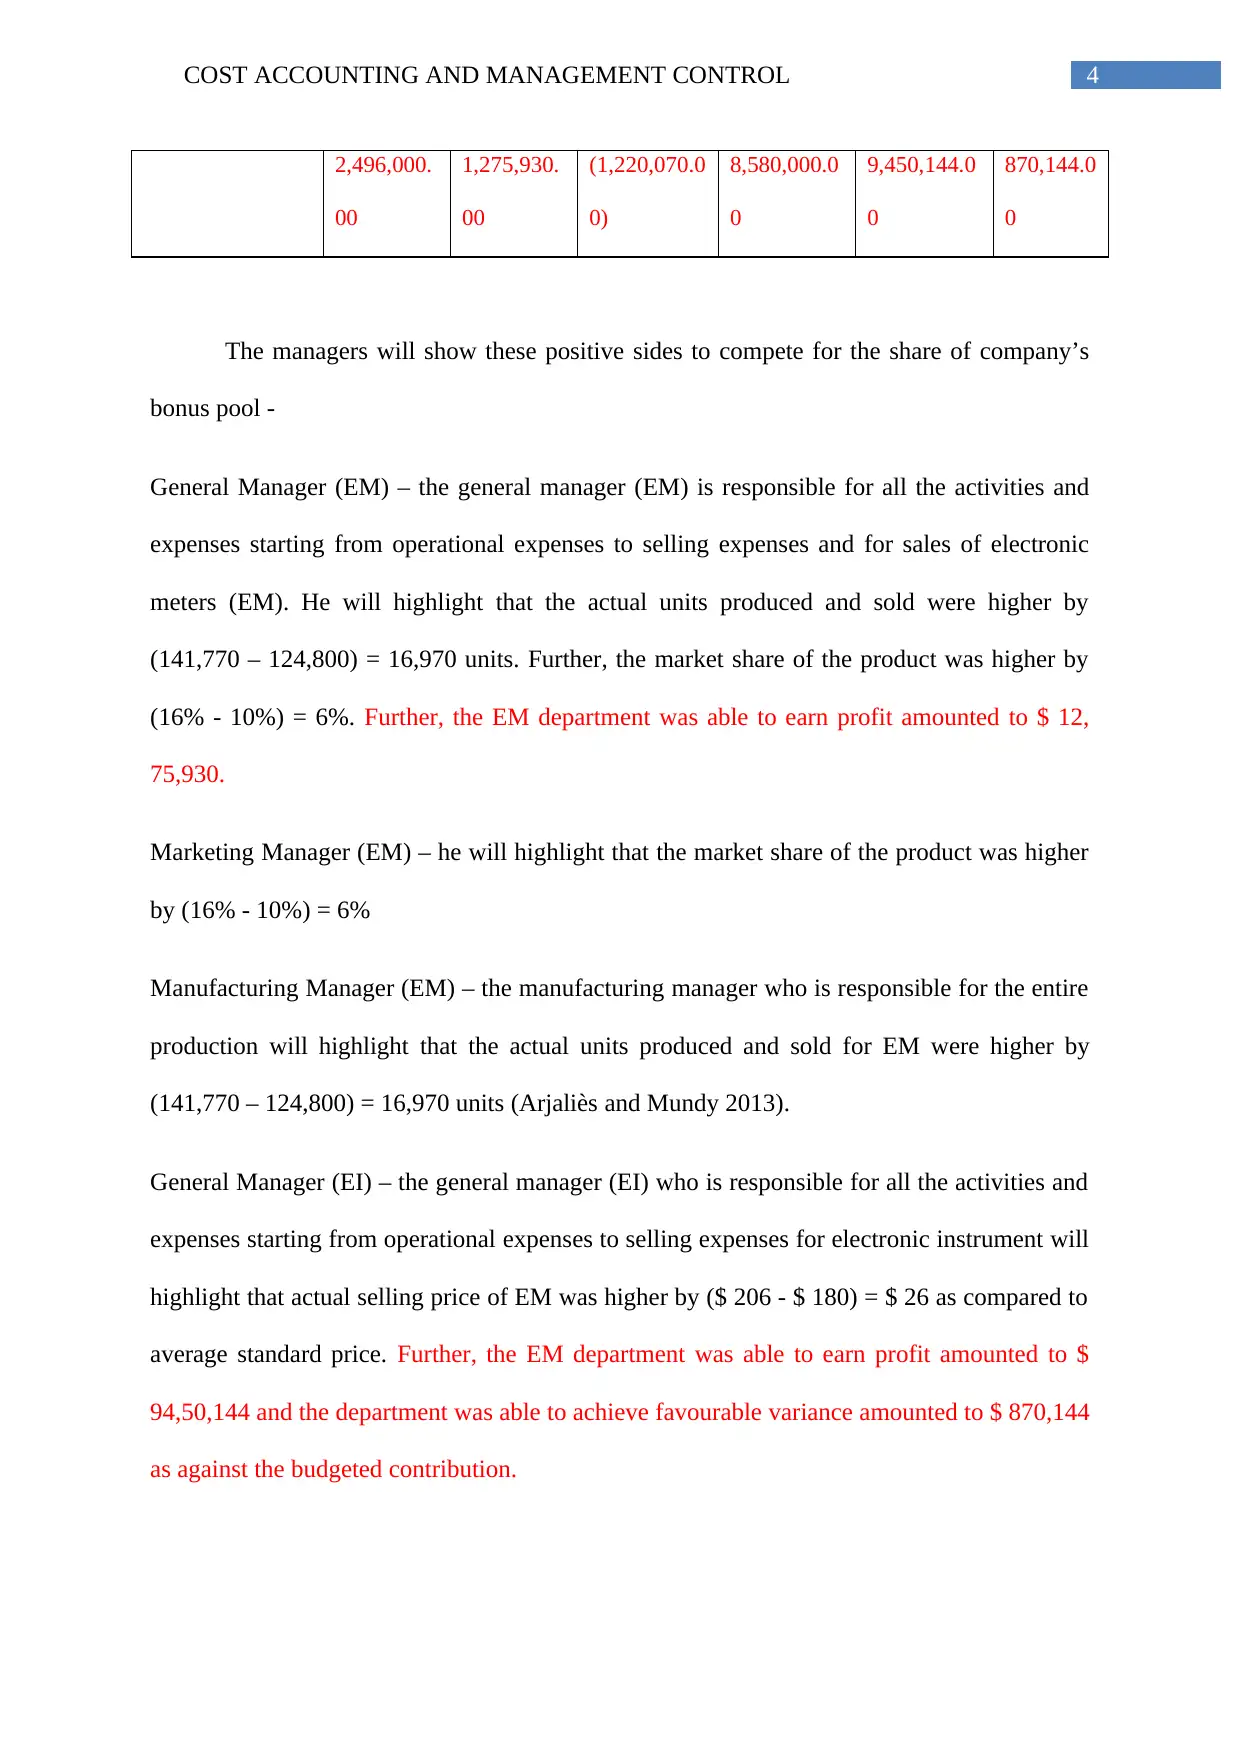
This report analyzes the profitability variance of Pelican Instruments, Inc. for the year ended 1997, focusing on the impact of marketing, R&D, and administration expenses. Despite an unfavorable gross margin variance, the company achieved a positive profitability variance, primarily due to favorable variances in marketing and R&D expenses. The analysis includes a detailed breakdown of budget vs. actual figures for sales, cost of goods sold, operating expenses, and profit before taxes. The report also assesses the performance of different managers and departments, suggesting bonus allocations based on their contributions to the company's overall profitability, with emphasis on rewarding positive contributions to profit.
1 out of 7
Related Documents


Your All-in-One AI-Powered Toolkit for Academic Success.
+13062052269
info@desklib.com
Available 24*7 on WhatsApp / Email
![[object Object]](/_next/static/media/star-bottom.7253800d.svg)
Copyright © 2020–2026 A2Z Services. All Rights Reserved. Developed and managed by ZUCOL.