Financial Resources Management: Cost Analysis, Budgeting & Forecasting
VerifiedAdded on 2023/06/15
|11
|2647
|226
Report
AI Summary
This report provides a comprehensive overview of managing financial resources, including detailed cost calculations for a business, preparation of a cost sheet, and analysis of budgeting and forecasting techniques. It covers prime cost, production cost, administrative expenses, sales and distribution expenses, and total cost calculations. The report further examines budgeting and forecasting with examples, variance analysis (favorable and adverse), and flexible budgeting. Key financial terms such as labor cost, customer retention rate, food average spend, and food cost of sales ratio are explained with formulas and practical examples, illustrating their importance in financial management and decision-making. This document is available for review and study on Desklib, a platform offering a wide range of academic resources.
Managing Financial
Resources
Resources
Paraphrase This Document
Need a fresh take? Get an instant paraphrase of this document with our AI Paraphraser
Table of Contents
INTRODUCTION ..........................................................................................................................3
TASK ..............................................................................................................................................3
Question 1: Calculate the different costs for Costa.....................................................................3
Question 4 : Analyse the following with examples....................................................................5
Question 6 : Explain the following terms with their formula and examples..............................8
CONCLUSION .............................................................................................................................10
REFERENCES..............................................................................................................................11
INTRODUCTION
Managing financial resources refers to the management of the complicated issues which arise In
an organisation related to the financial planning and control of the business (Plaskova, and et.al.,
2020). The following assessment shows calculations related to different costs which are incurred
in the business and a cost sheet is prepared for the same. The next section of the assessment
shows discusses the different terms used in management of financial resources and are explained
thereunder using examples.
TASK
SECTION A:
Question 1: Calculate the different costs for Costa.
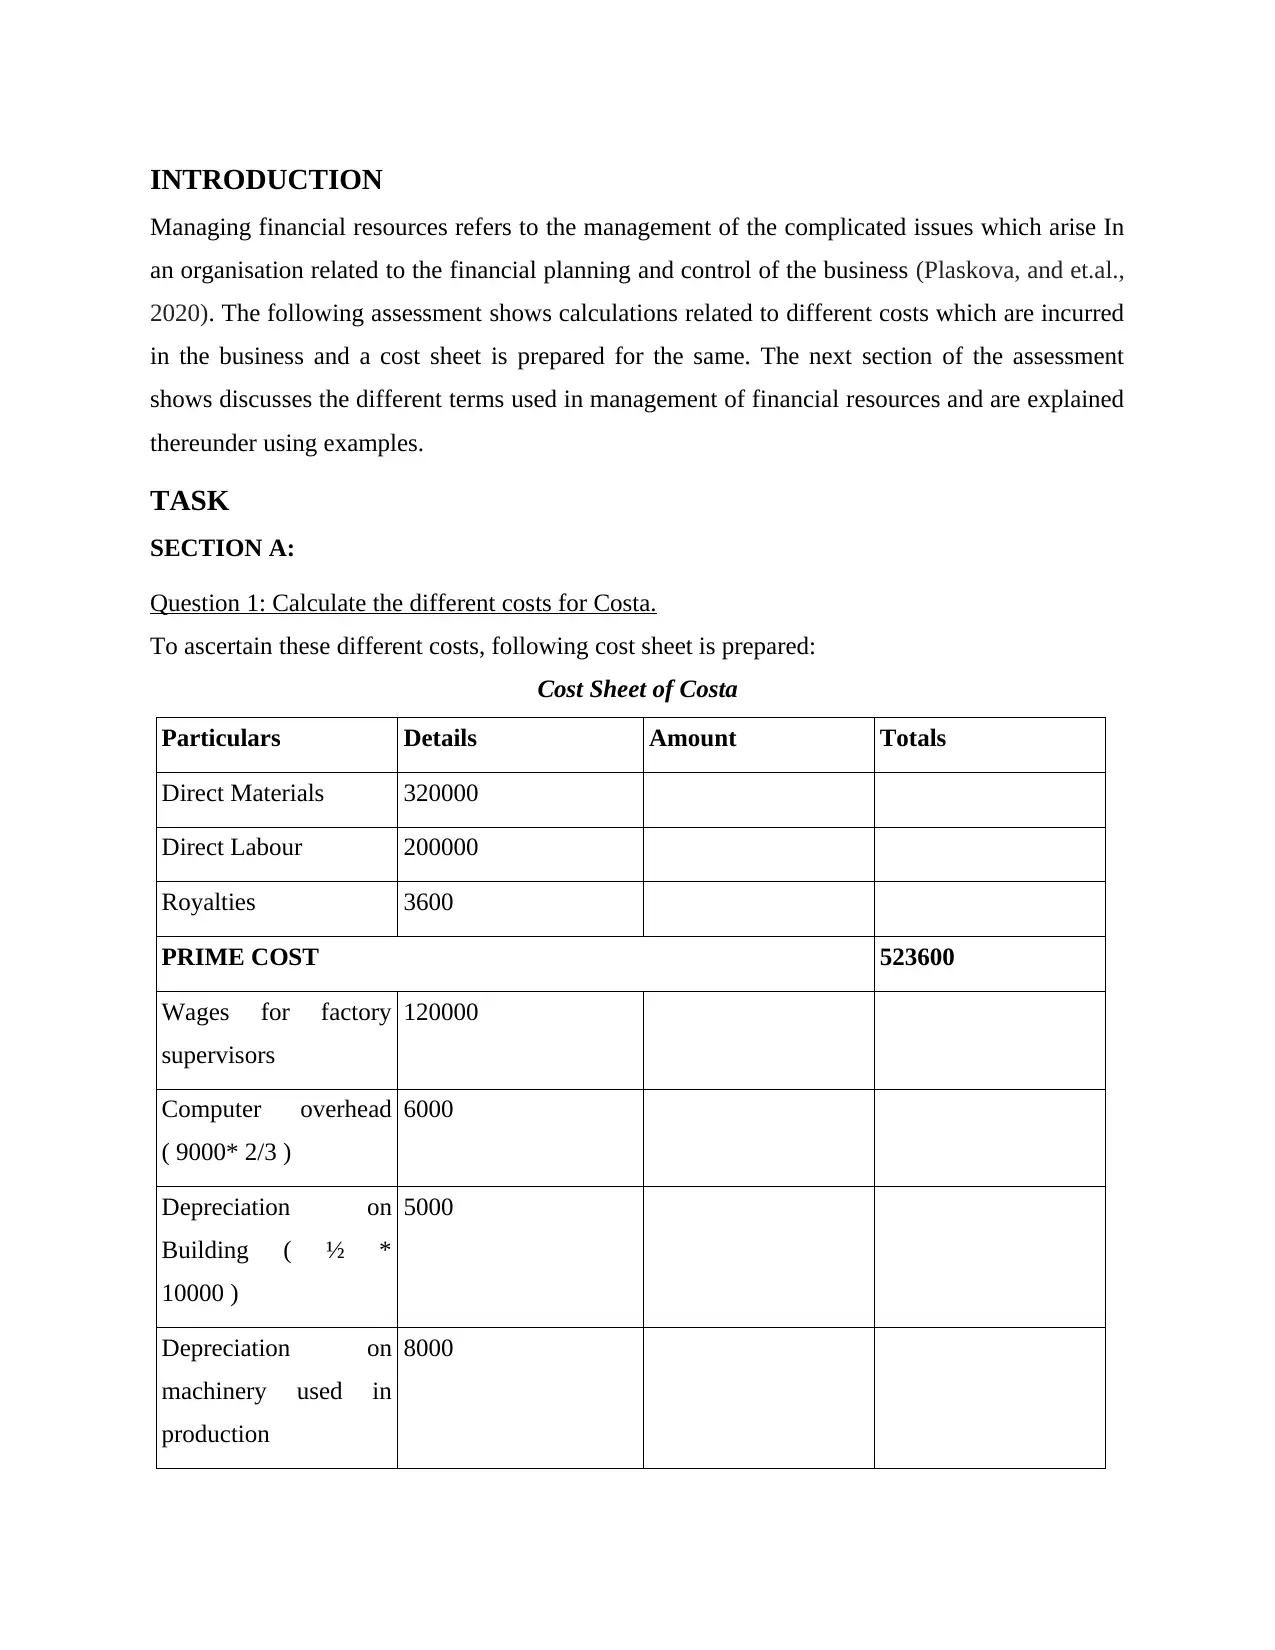
To ascertain these different costs, following cost sheet is prepared:
Cost Sheet of Costa
Particulars Details Amount Totals
Direct Materials 320000
Direct Labour 200000
Royalties 3600
PRIME COST 523600
Wages for factory
supervisors
120000
Computer overhead
( 9000* 2/3 )
6000
Depreciation on
Building ( ½ *
10000 )
5000
Depreciation on
machinery used in
production
8000
Managing financial resources refers to the management of the complicated issues which arise In
an organisation related to the financial planning and control of the business (Plaskova, and et.al.,
2020). The following assessment shows calculations related to different costs which are incurred
in the business and a cost sheet is prepared for the same. The next section of the assessment
shows discusses the different terms used in management of financial resources and are explained
thereunder using examples.
TASK
SECTION A:
Question 1: Calculate the different costs for Costa.
To ascertain these different costs, following cost sheet is prepared:
Cost Sheet of Costa
Particulars Details Amount Totals
Direct Materials 320000
Direct Labour 200000
Royalties 3600
PRIME COST 523600
Wages for factory
supervisors
120000
Computer overhead
( 9000* 2/3 )
6000
Depreciation on
Building ( ½ *
10000 )
5000
Depreciation on
machinery used in
production
8000
⊘ This is a preview!⊘
Do you want full access?
Subscribe today to unlock all pages.
Trusted by 1+ million students worldwide
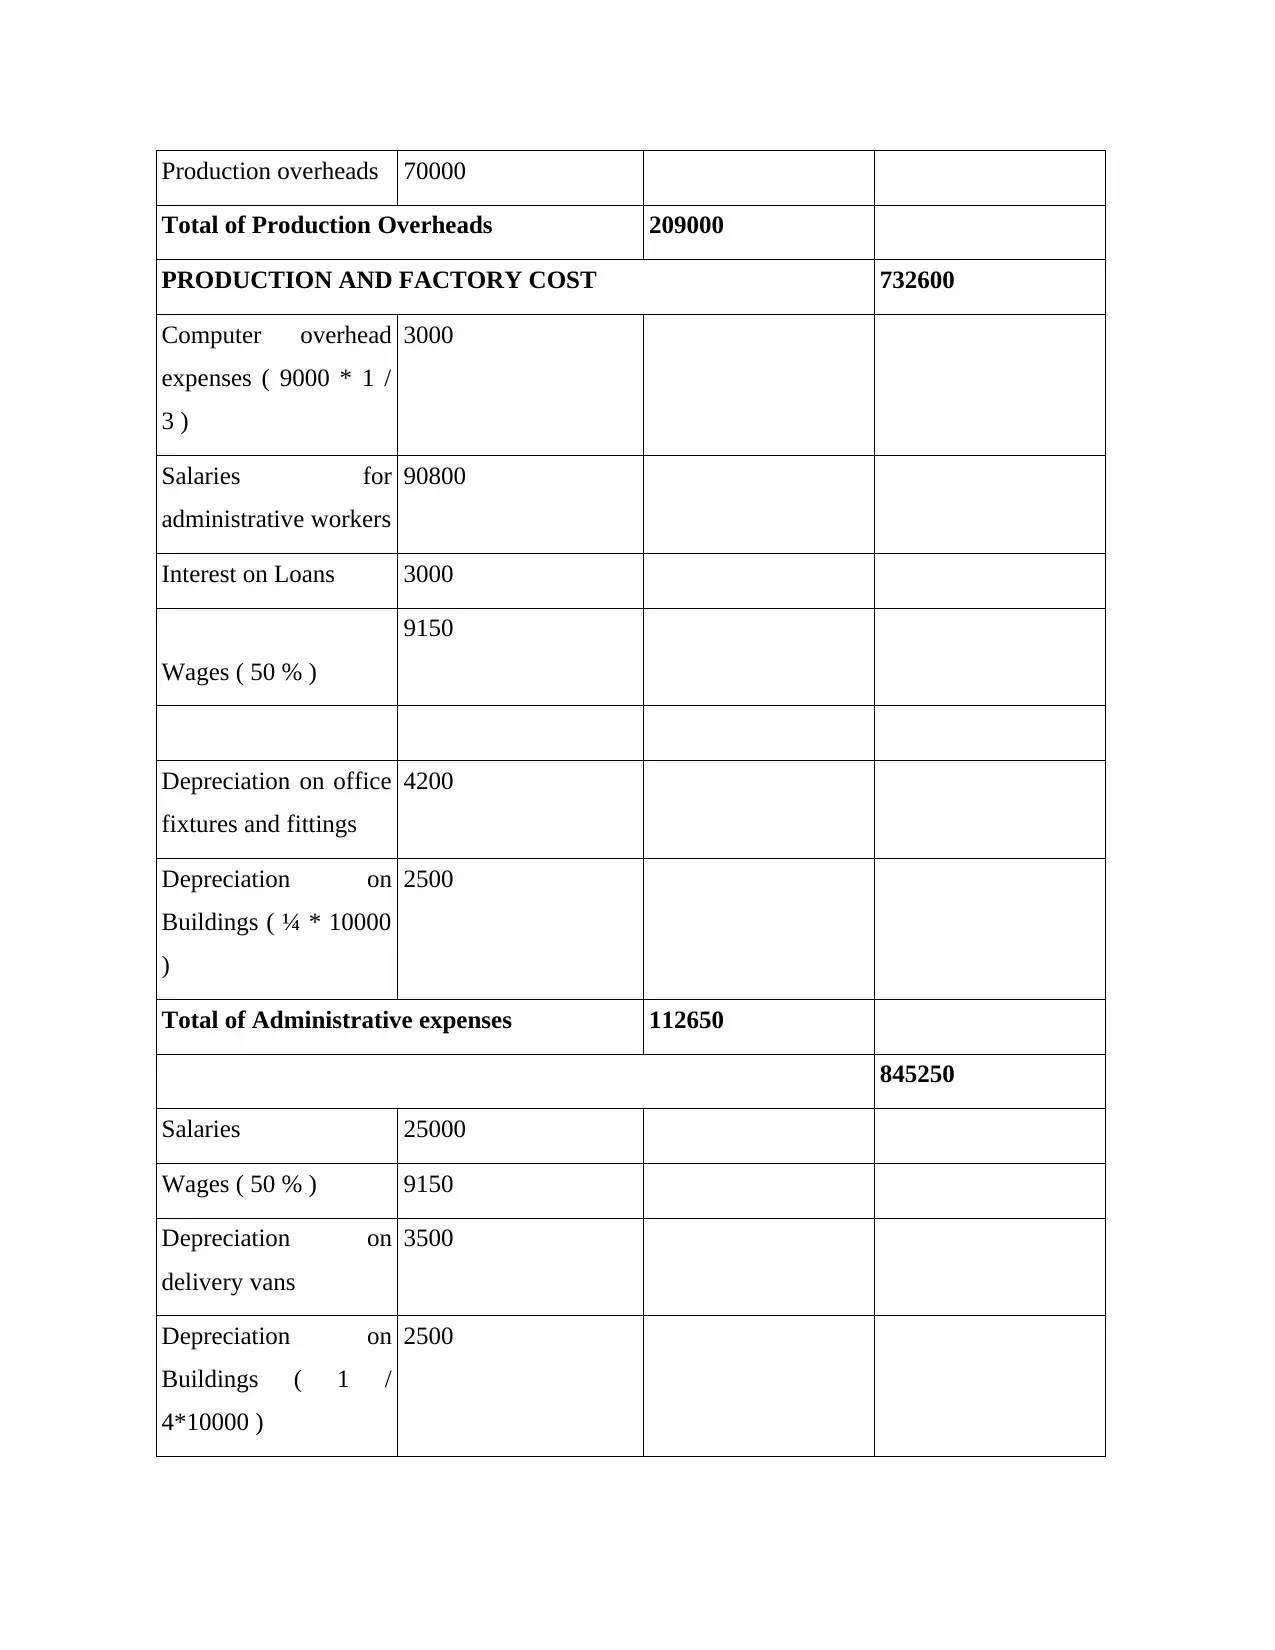
Production overheads 70000
Total of Production Overheads 209000
PRODUCTION AND FACTORY COST 732600
Computer overhead
expenses ( 9000 * 1 /
3 )
3000
Salaries for
administrative workers
90800
Interest on Loans 3000
Wages ( 50 % )
9150
Depreciation on office
fixtures and fittings
4200
Depreciation on
Buildings ( ¼ * 10000
)
2500
Total of Administrative expenses 112650
845250
Salaries 25000
Wages ( 50 % ) 9150
Depreciation on
delivery vans
3500
Depreciation on
Buildings ( 1 /
4*10000 )
2500
Paraphrase This Document
Need a fresh take? Get an instant paraphrase of this document with our AI Paraphraser
Commission to sales
staff
1200
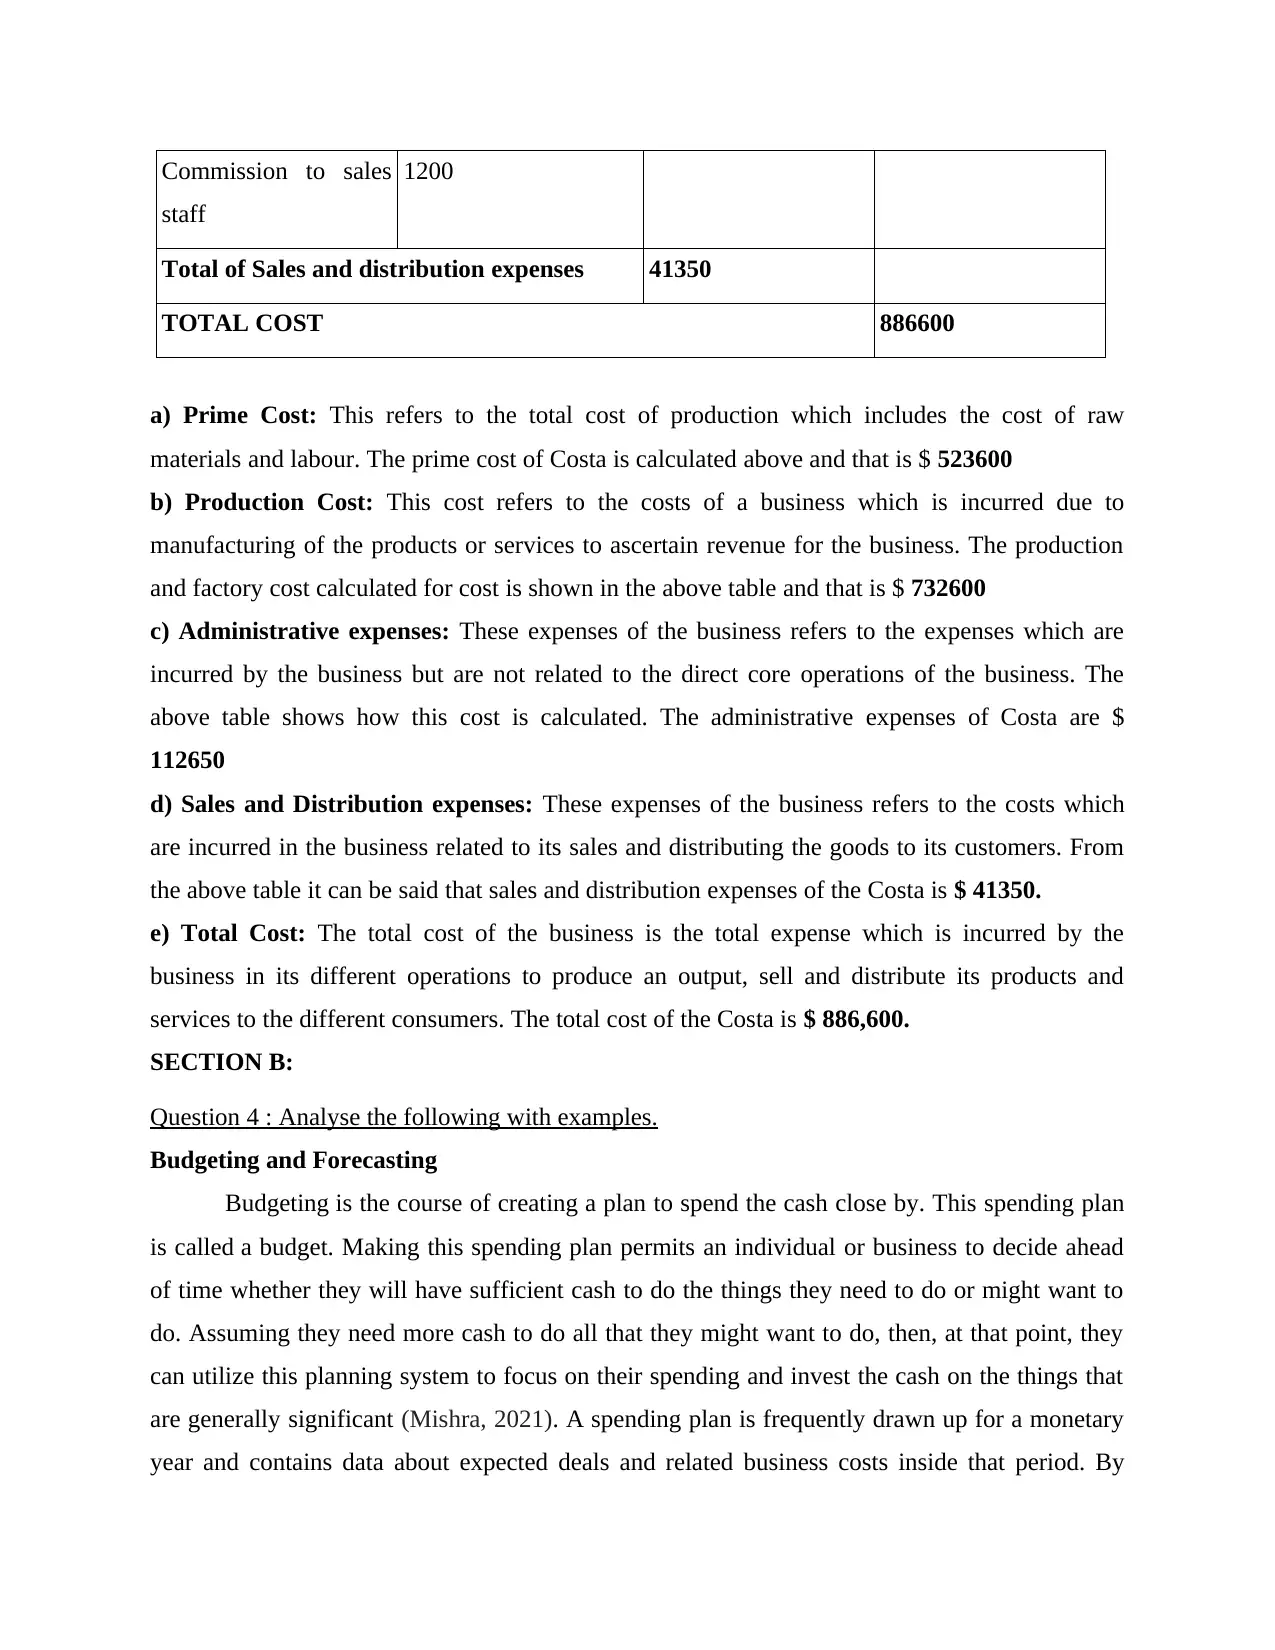
Total of Sales and distribution expenses 41350
TOTAL COST 886600
a) Prime Cost: This refers to the total cost of production which includes the cost of raw
materials and labour. The prime cost of Costa is calculated above and that is $ 523600
b) Production Cost: This cost refers to the costs of a business which is incurred due to
manufacturing of the products or services to ascertain revenue for the business. The production
and factory cost calculated for cost is shown in the above table and that is $ 732600
c) Administrative expenses: These expenses of the business refers to the expenses which are
incurred by the business but are not related to the direct core operations of the business. The
above table shows how this cost is calculated. The administrative expenses of Costa are $
112650
d) Sales and Distribution expenses: These expenses of the business refers to the costs which
are incurred in the business related to its sales and distributing the goods to its customers. From
the above table it can be said that sales and distribution expenses of the Costa is $ 41350.
e) Total Cost: The total cost of the business is the total expense which is incurred by the
business in its different operations to produce an output, sell and distribute its products and
services to the different consumers. The total cost of the Costa is $ 886,600.
SECTION B:
Question 4 : Analyse the following with examples.
Budgeting and Forecasting
Budgeting is the course of creating a plan to spend the cash close by. This spending plan
is called a budget. Making this spending plan permits an individual or business to decide ahead
of time whether they will have sufficient cash to do the things they need to do or might want to
do. Assuming they need more cash to do all that they might want to do, then, at that point, they
can utilize this planning system to focus on their spending and invest the cash on the things that
are generally significant (Mishra, 2021). A spending plan is frequently drawn up for a monetary
year and contains data about expected deals and related business costs inside that period. By
staff
1200
Total of Sales and distribution expenses 41350
TOTAL COST 886600
a) Prime Cost: This refers to the total cost of production which includes the cost of raw
materials and labour. The prime cost of Costa is calculated above and that is $ 523600
b) Production Cost: This cost refers to the costs of a business which is incurred due to
manufacturing of the products or services to ascertain revenue for the business. The production
and factory cost calculated for cost is shown in the above table and that is $ 732600
c) Administrative expenses: These expenses of the business refers to the expenses which are
incurred by the business but are not related to the direct core operations of the business. The
above table shows how this cost is calculated. The administrative expenses of Costa are $
112650
d) Sales and Distribution expenses: These expenses of the business refers to the costs which
are incurred in the business related to its sales and distributing the goods to its customers. From
the above table it can be said that sales and distribution expenses of the Costa is $ 41350.
e) Total Cost: The total cost of the business is the total expense which is incurred by the
business in its different operations to produce an output, sell and distribute its products and
services to the different consumers. The total cost of the Costa is $ 886,600.
SECTION B:
Question 4 : Analyse the following with examples.
Budgeting and Forecasting
Budgeting is the course of creating a plan to spend the cash close by. This spending plan
is called a budget. Making this spending plan permits an individual or business to decide ahead
of time whether they will have sufficient cash to do the things they need to do or might want to
do. Assuming they need more cash to do all that they might want to do, then, at that point, they
can utilize this planning system to focus on their spending and invest the cash on the things that
are generally significant (Mishra, 2021). A spending plan is frequently drawn up for a monetary
year and contains data about expected deals and related business costs inside that period. By
utilizing this financial plan a business can perceive how well they are hoping to perform inside
the year and genuine execution can be checked against this unique proposed plan. The main role
of these budgets is to help the venture methodology through arranged drives, planned asset
assignment degree to which changes in the climate are affecting the limit of the business to meet
targets.
Forecasting is an evaluation of conceivable future occasions. At the underlying arranging stage,
it is mandatory to plan to estimates potential activities for the business later on. Forecasts
includes deals, creation, cost, acquisition of material, and monetary need of the business. The
figure has some adaptability, through the spending plan having a decent objective.
By and large, budgeting and forecasting are used interchangeably or comprehended as a
similar action (Planning incorporates Anticipating). Notwithstanding, there is a merger line
between both. A budget is a projection of what will occur during the planning time frame at an
association level, by and large incorporate critical livelihoods and consumptions (Panov, and
Larionova, 2021). A forecast might be for long haul or momentary period or utilizing the
hierarchical or wider perspective.
A drawn out budget will give important result to the administration for their essential
strategy. Interestingly, transient estimate is by and large is finished functional and everyday
business needs.
Example of budgeting are, sales budget, production budget, flexed budget etc.
Variance Analysis
Variance Analysis is the investigation of deviations of genuine conduct versus estimated or
arranged conduct in planning or the executives bookkeeping. This is basically worried about how
the distinction of real and arranged practices shows how business execution is being affected.
Variance Analysis change assists organizations with understanding current outgoings and assists
them with planning for future costs. Organizations frequently do Variance Analysis - a
quantitative examination concerning the contrasts among arranged and genuine expenses and
incomes (Block, Hirt, and Danielsen, 2018). Variance Analysis can be applied to the two
incomes and costs. At the point when real outcomes are better compared to arranged, change is
alluded to as 'Favourable'. Assuming that outcomes are more awful than anticipated, fluctuation
is alluded to as ‘adverse’ or ‘unfavourable'. Analysing. For example, the forecasted expense on
⊘ This is a preview!⊘
Do you want full access?
Subscribe today to unlock all pages.
Trusted by 1+ million students worldwide
the production was 150000 but the actual cost occurred on production is 180000 which means
that the variance is unfavourable.
Adverse Variances
An adverse variance is the place where real pay is not as much as spending plan, or actual
expenditure is more than financial plan. This is equivalent to a expenditure exceeds the available
income. A positive difference is the place where genuine pay is more than financial plan, or real
use is not as much as spending plan. An unfavourable variance can happen because of changing
financial conditions, for example, lower monetary development, lower customer spending, or a
downturn, which prompts higher joblessness. Economic situations can likewise change, for
example, new contenders entering the market with new items and administrations. For example,
the forecasted sales were 18000 but the actual sales occurred is 15000 which means that the
variance is unfavourable or adverse.
Favourable Variances
A Favourable Variances is the place where real pay is more than spending plan, or real use is not
as much as financial plan. This is equivalent to an excess where consumption is not exactly the
accessible income. An ideal fluctuation shows that a business has either produced more income
than anticipated or caused less costs than anticipated. For a cost, this is the abundance of a norm
or planned sum over the genuine sum brought about (Chernov, 2020). At the point when income
is involved, an ideal change is the point at which the real income perceived is more prominent
than the norm or planned sum. For example, the forecasted sales were 18000 but the actual sales
occurred is 20000 which means that the variance is favourable.
Flexible Budget
An flexible budget acclimates to changes in authentic income levels. Real incomes or other
changes measures are gone into the adaptable spending plan once a bookkeeping period has been
finished, and it produces a spending plan that is explicit to the sources of info. The budget is then
contrasted with genuine costs for control purposes. An adaptable spending plan requires
additional opportunity to build, defers the issuance of fiscal reports, doesn't quantify income
differences, and may not be pertinent under specific financial plan models. For example, XYZ
Organization has a spending plan of $10 million in incomes and a $4 million expense of
merchandise sold. Of the $4 million in planned expense of merchandise sold, $1 million is fixed,
and $3 million fluctuates straightforwardly with income. In this way, the variable piece of the
Paraphrase This Document
Need a fresh take? Get an instant paraphrase of this document with our AI Paraphraser
expense of products sold is 30% of incomes. When the spending plan period has been finished,
XYZ observes that deals were really $9 million. On the off chance that it utilized an adaptable
spending plan, the proper piece of the expense of merchandise sold would in any case be $1
million, yet the variable part would drop to $2.7 million, since it is 30% all the time of incomes.
The outcome is that an adaptable spending plan yields a planned expense of products sold of
$3.7 million at a $9 million income level, rather than the $4 million that would be recorded in a
static financial plan.
Question 6 : Explain the following terms with their formula and examples.
1. Labour Cost:
labour cost is amongst the highest paid expenses in an organisation. In fact, in restaurant
business such cost contributes 5-10% of total revenue. Labour cost is not just wages or salaries
but it also includes payroll taxes, bonus, overtime, training cost, insurance etc.
formula of calculating labour cost are as under:-
Labour cost(as % to sales)= (Total labour/ Total sales*100) and
Labour cost(as % to operating cost)=(Total labour/Total operating cost*100)
For example, in a restaurant business, there is annual labour cost of 84000 pound ,operating cost
is 4,12,000 pound and suppose their revenue during the accounting year is 11,25,600 pound.
Then their labour cost will be:
% to sales= (84000/1125600*100)
=7.46%
% to operating cost=(84000/412000*100)
=20.39%
2. Customer retention rate: It simply means the number of customer, an organisation retains
over the giver period of time. Their is a financial reason to retain existing customer as keeping
existing customer is lot cheaper rather to maintain a new customer base for a company (Barr, and
McClellan, 2018). Loyal and old customers also makes contribution towards wealth of firm by
way of promoting brand in social media, commenting or making regular feedback to improve
products of services.
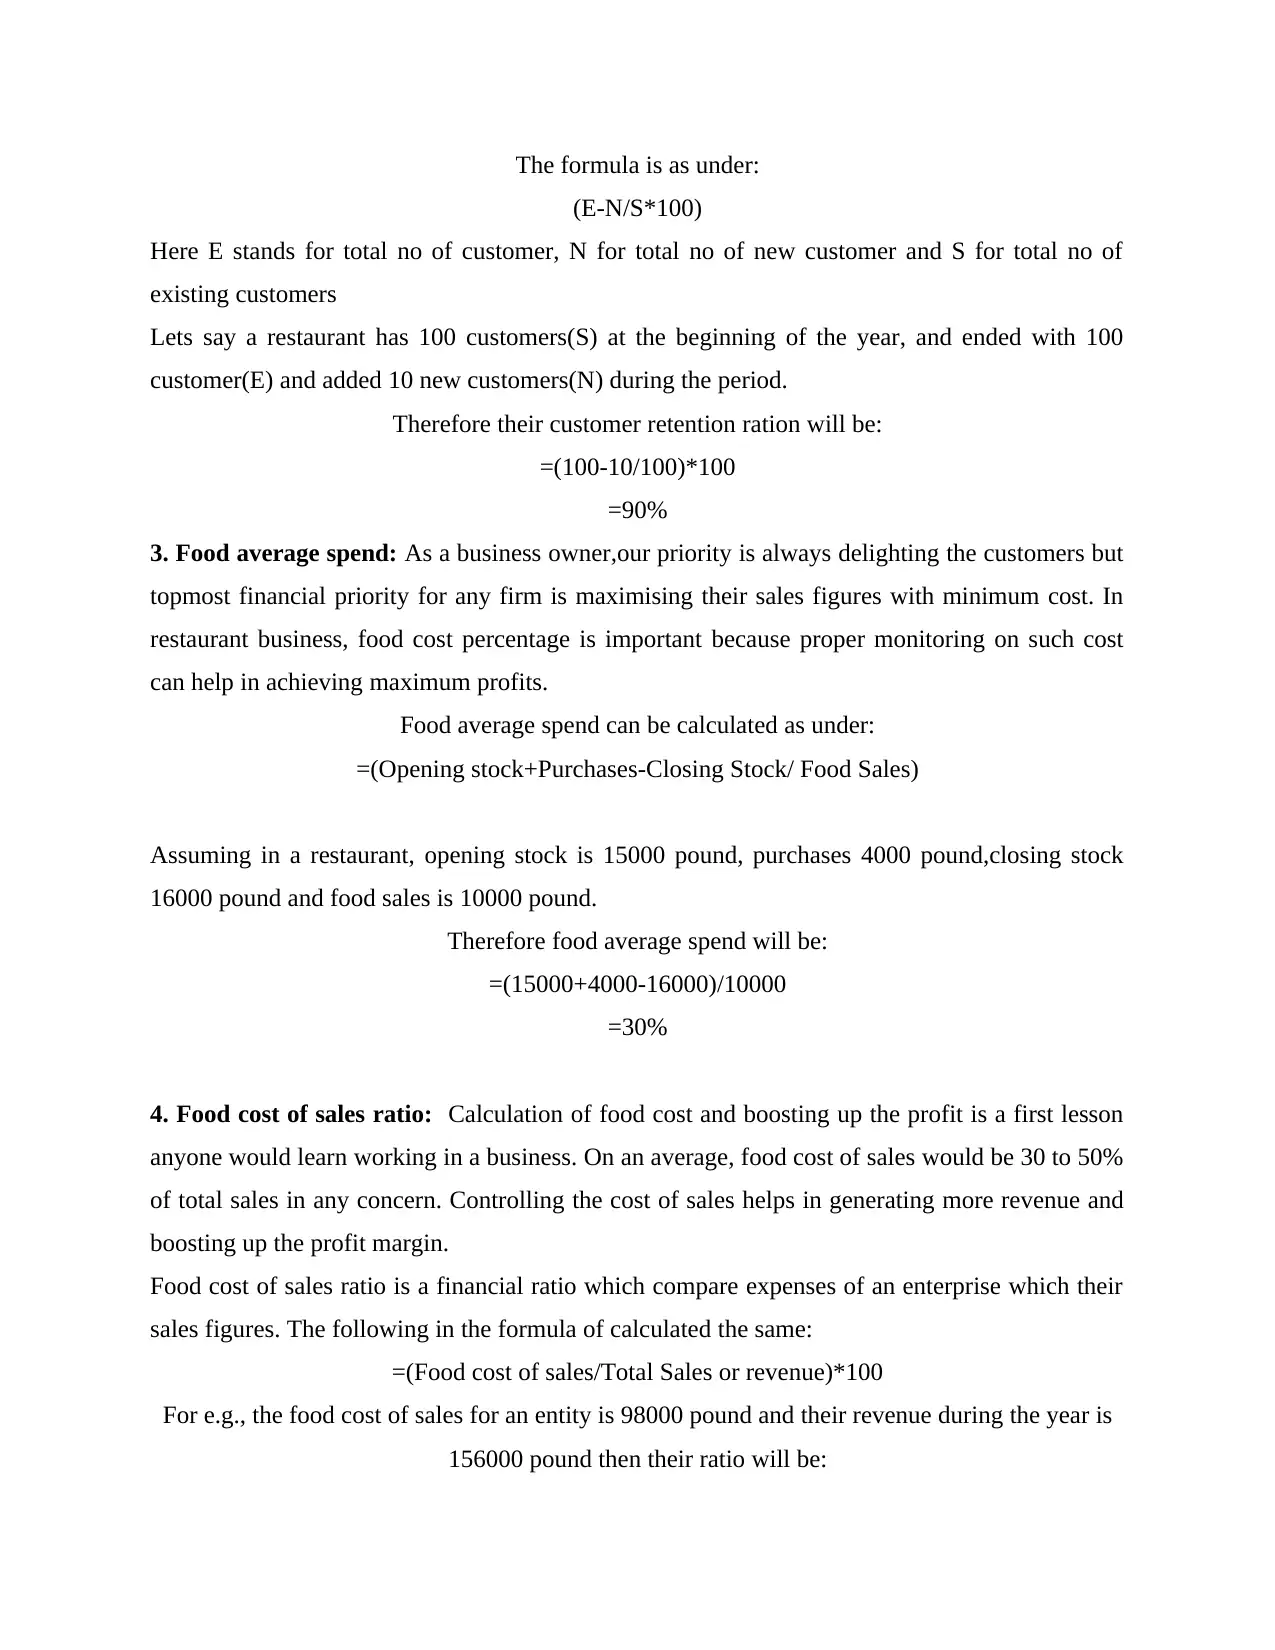
The formula is as under:
(E-N/S*100)
Here E stands for total no of customer, N for total no of new customer and S for total no of
existing customers
Lets say a restaurant has 100 customers(S) at the beginning of the year, and ended with 100
customer(E) and added 10 new customers(N) during the period.
Therefore their customer retention ration will be:
=(100-10/100)*100
=90%
3. Food average spend: As a business owner,our priority is always delighting the customers but
topmost financial priority for any firm is maximising their sales figures with minimum cost. In
restaurant business, food cost percentage is important because proper monitoring on such cost
can help in achieving maximum profits.
Food average spend can be calculated as under:
=(Opening stock+Purchases-Closing Stock/ Food Sales)
Assuming in a restaurant, opening stock is 15000 pound, purchases 4000 pound,closing stock
16000 pound and food sales is 10000 pound.
Therefore food average spend will be:
=(15000+4000-16000)/10000
=30%
4. Food cost of sales ratio: Calculation of food cost and boosting up the profit is a first lesson
anyone would learn working in a business. On an average, food cost of sales would be 30 to 50%
of total sales in any concern. Controlling the cost of sales helps in generating more revenue and
boosting up the profit margin.
Food cost of sales ratio is a financial ratio which compare expenses of an enterprise which their
sales figures. The following in the formula of calculated the same:
=(Food cost of sales/Total Sales or revenue)*100
For e.g., the food cost of sales for an entity is 98000 pound and their revenue during the year is
156000 pound then their ratio will be:
⊘ This is a preview!⊘
Do you want full access?
Subscribe today to unlock all pages.
Trusted by 1+ million students worldwide
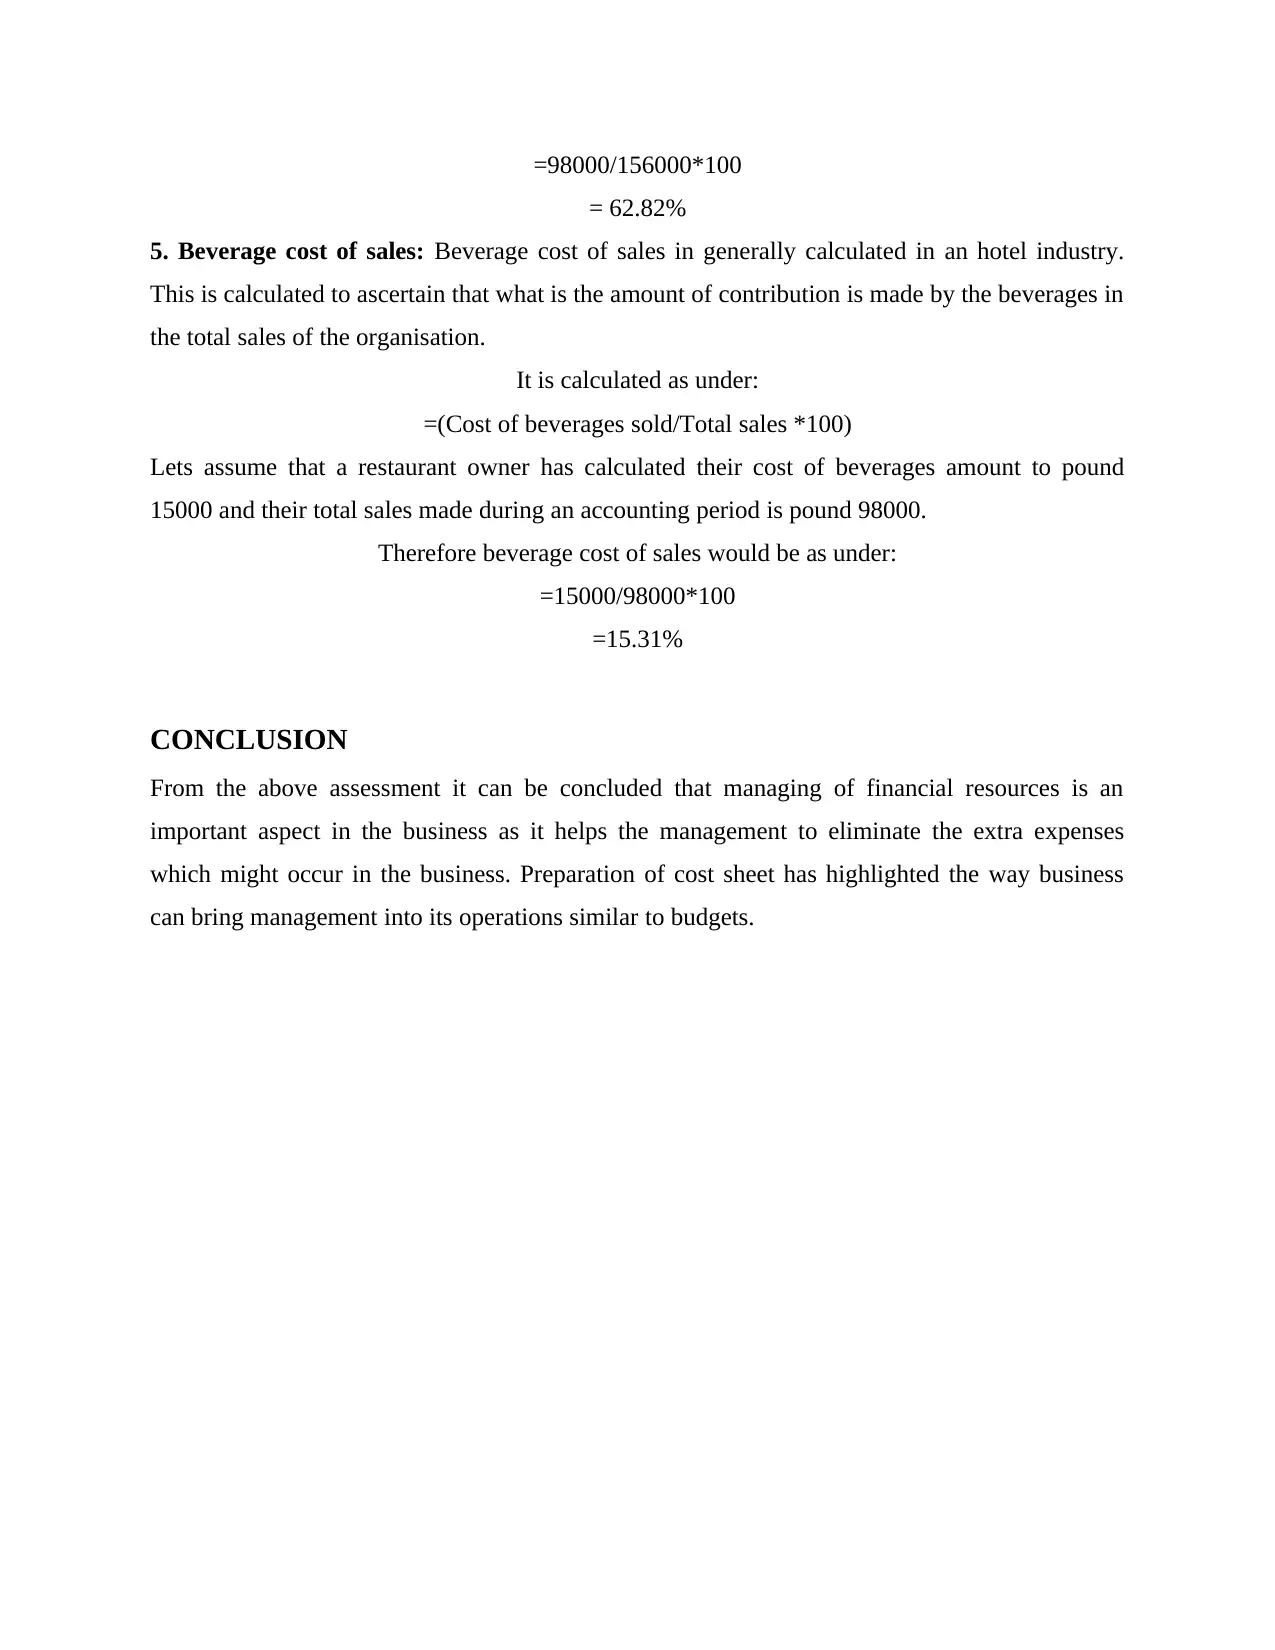
=98000/156000*100
= 62.82%
5. Beverage cost of sales: Beverage cost of sales in generally calculated in an hotel industry.
This is calculated to ascertain that what is the amount of contribution is made by the beverages in
the total sales of the organisation.
It is calculated as under:
=(Cost of beverages sold/Total sales *100)
Lets assume that a restaurant owner has calculated their cost of beverages amount to pound
15000 and their total sales made during an accounting period is pound 98000.
Therefore beverage cost of sales would be as under:
=15000/98000*100
=15.31%
CONCLUSION
From the above assessment it can be concluded that managing of financial resources is an
important aspect in the business as it helps the management to eliminate the extra expenses
which might occur in the business. Preparation of cost sheet has highlighted the way business
can bring management into its operations similar to budgets.
Paraphrase This Document
Need a fresh take? Get an instant paraphrase of this document with our AI Paraphraser
REFERENCES
Books and Journals
Plaskova, N.S., and et.al., 2020. Improving Information and Analytical and Methodological
Support for Managing the Structure of Financial Resources of the Organization. Talent
Development & Excellence, 12.
Mishra, S.K., 2021. GMFP Food and Products: Managing Financial Distress. SAGE
Publications: SAGE Business Cases Originals.
Panov, D. and Larionova, I., 2021. Managing the Risks of Financial Intermediaries:
Transforming Approaches and Reality. In Financial Markets Evolution (pp. 261-271).
Palgrave Macmillan, Cham.
Block, S.B., Hirt, G.A. and Danielsen, B.R., 2018. Foundations of financial management.
McGraw-Hill Education.
Chernov, V.A., 2020. Implementation of Digital Technologies in Financial
Management. Ekonomika Regiona, (1), p.283.
Barr, M.J. and McClellan, G.S., 2018. Budgets and financial management in higher education.
John Wiley & Sons.
1 out of 11
Related Documents

Your All-in-One AI-Powered Toolkit for Academic Success.
+13062052269
info@desklib.com
Available 24*7 on WhatsApp / Email
![[object Object]](/_next/static/media/star-bottom.7253800d.svg)
Unlock your academic potential
Copyright © 2020–2026 A2Z Services. All Rights Reserved. Developed and managed by ZUCOL.