Financial Resource Management: Cost Analysis and Budgeting for Costa
VerifiedAdded on 2023/06/15
|13
|2945
|393
Report
AI Summary
This report provides a detailed analysis of managing financial resources, focusing on Costa as a case study. It includes calculations of various costs such as production cost, administrative expenses, prime cost, total cost, and sales & distribution expenses. The report further analyzes budgeting and forecasting, variance analysis (favorable and unfavorable), and flexible budgets with examples. Key financial terms like labor cost, customer retention rate, food average spends, food cost of sales ratio, and beverage cost of sales are explained with formulas and examples, offering a comprehensive overview of financial management principles and their practical application in a business context. Desklib offers a variety of solved assignments and resources for students.

MANAGING
FINANCIAL
RESOURCES
FINANCIAL
RESOURCES
Paraphrase This Document
Need a fresh take? Get an instant paraphrase of this document with our AI Paraphraser
Table of Contents
Introduction......................................................................................................................................4
Task..................................................................................................................................................4
Question 1: Calculate the different costs for Costa................................................................4
Question 4 - Analyse the following with examples................................................................7
Question 6 : Explain the following terms with their formula and examples........................10
CONCLUSION..............................................................................................................................13
REFERENCES..............................................................................................................................14
Introduction
Monitoring sources of finance is the process of dealing with the complex and critical
difficulties that develop in an organization in relation to finance strategic decision making In this
evaluation, various kind of cost is follows includes computations for various expenditure in the
firm, as well as a pricing spreadsheet for the very same. The primary motive of this report is to
mainly focus on the financial resources so that the company can manage their operations. The
next portion of the evaluation delves into the various terminologies used in funding managing &
explains them with samples (Plaskova and et.al., 2020).
Task
Section A -
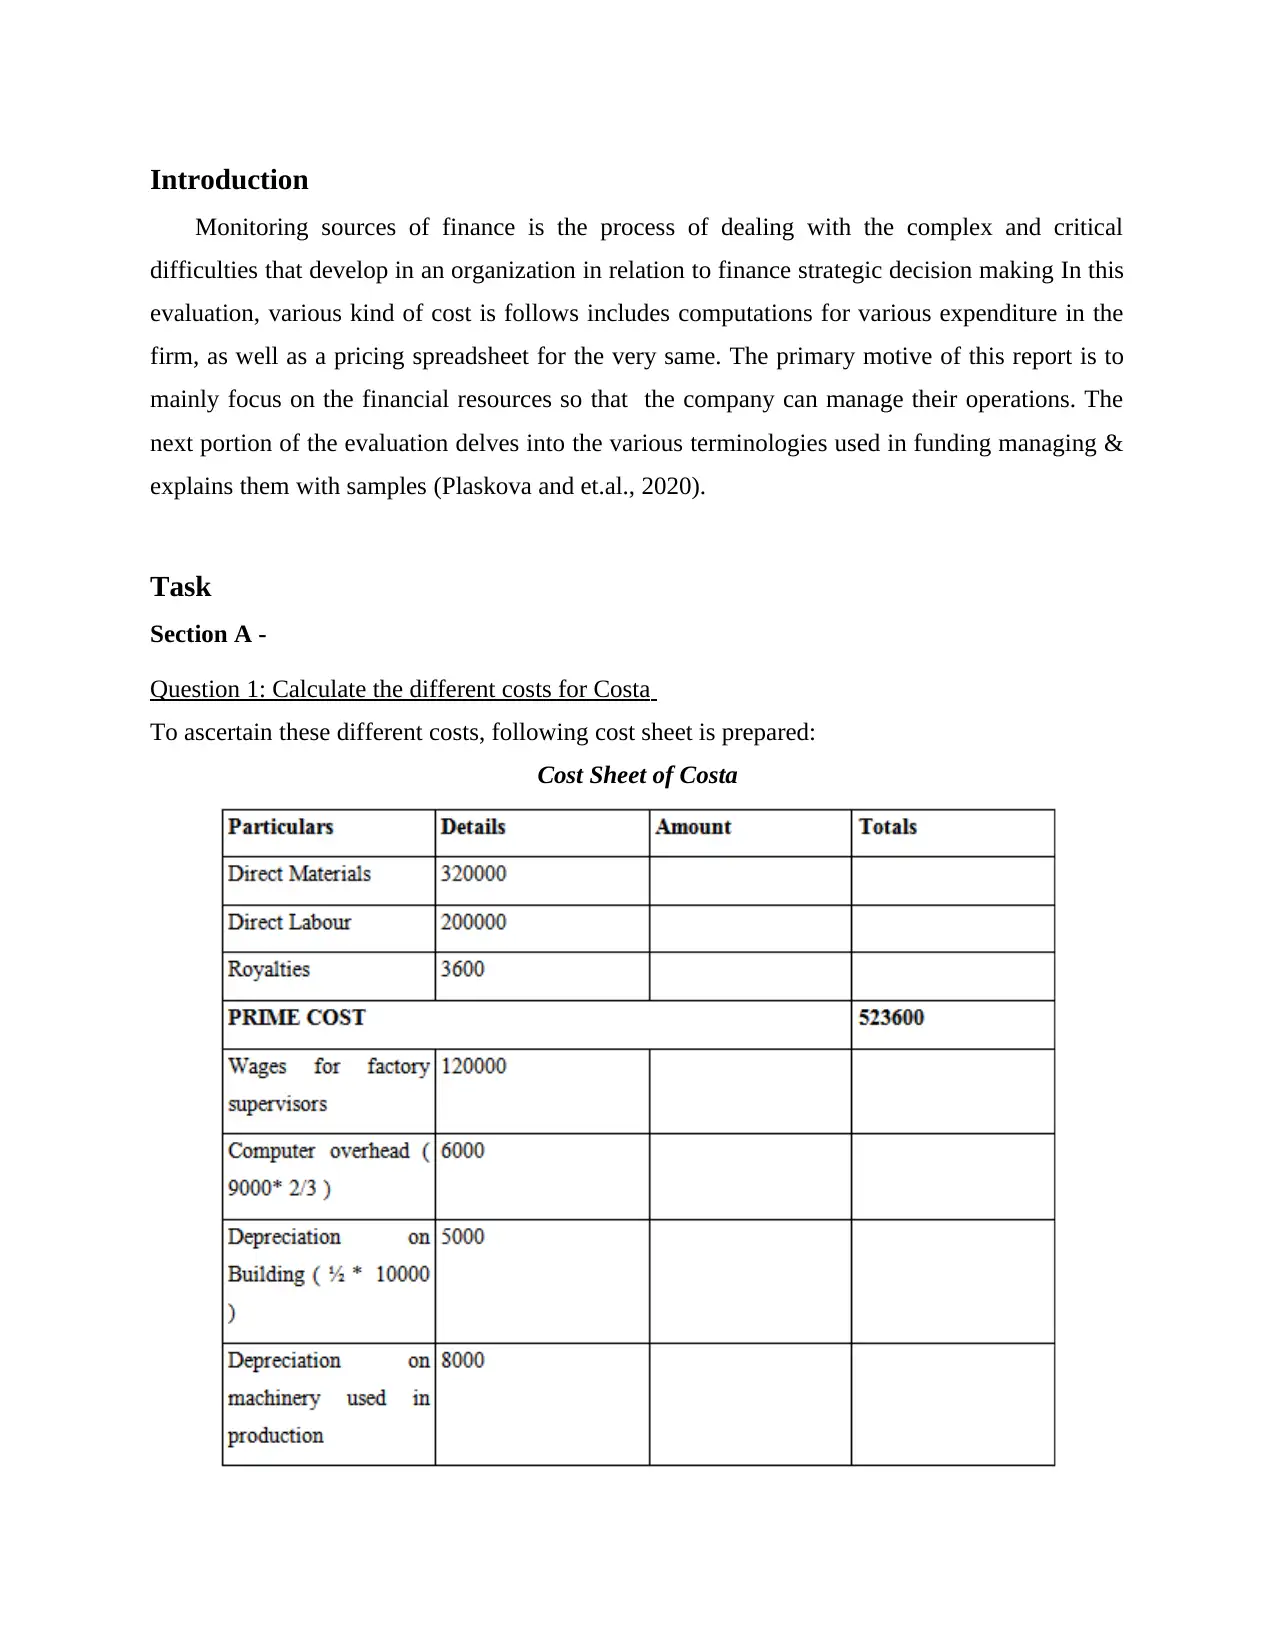
Question 1: Calculate the different costs for Costa
To ascertain these different costs, following cost sheet is prepared:
Cost Sheet of Costa
Monitoring sources of finance is the process of dealing with the complex and critical
difficulties that develop in an organization in relation to finance strategic decision making In this
evaluation, various kind of cost is follows includes computations for various expenditure in the
firm, as well as a pricing spreadsheet for the very same. The primary motive of this report is to
mainly focus on the financial resources so that the company can manage their operations. The
next portion of the evaluation delves into the various terminologies used in funding managing &
explains them with samples (Plaskova and et.al., 2020).
Task
Section A -
Question 1: Calculate the different costs for Costa
To ascertain these different costs, following cost sheet is prepared:
Cost Sheet of Costa
⊘ This is a preview!⊘
Do you want full access?
Subscribe today to unlock all pages.
Trusted by 1+ million students worldwide
Paraphrase This Document
Need a fresh take? Get an instant paraphrase of this document with our AI Paraphraser
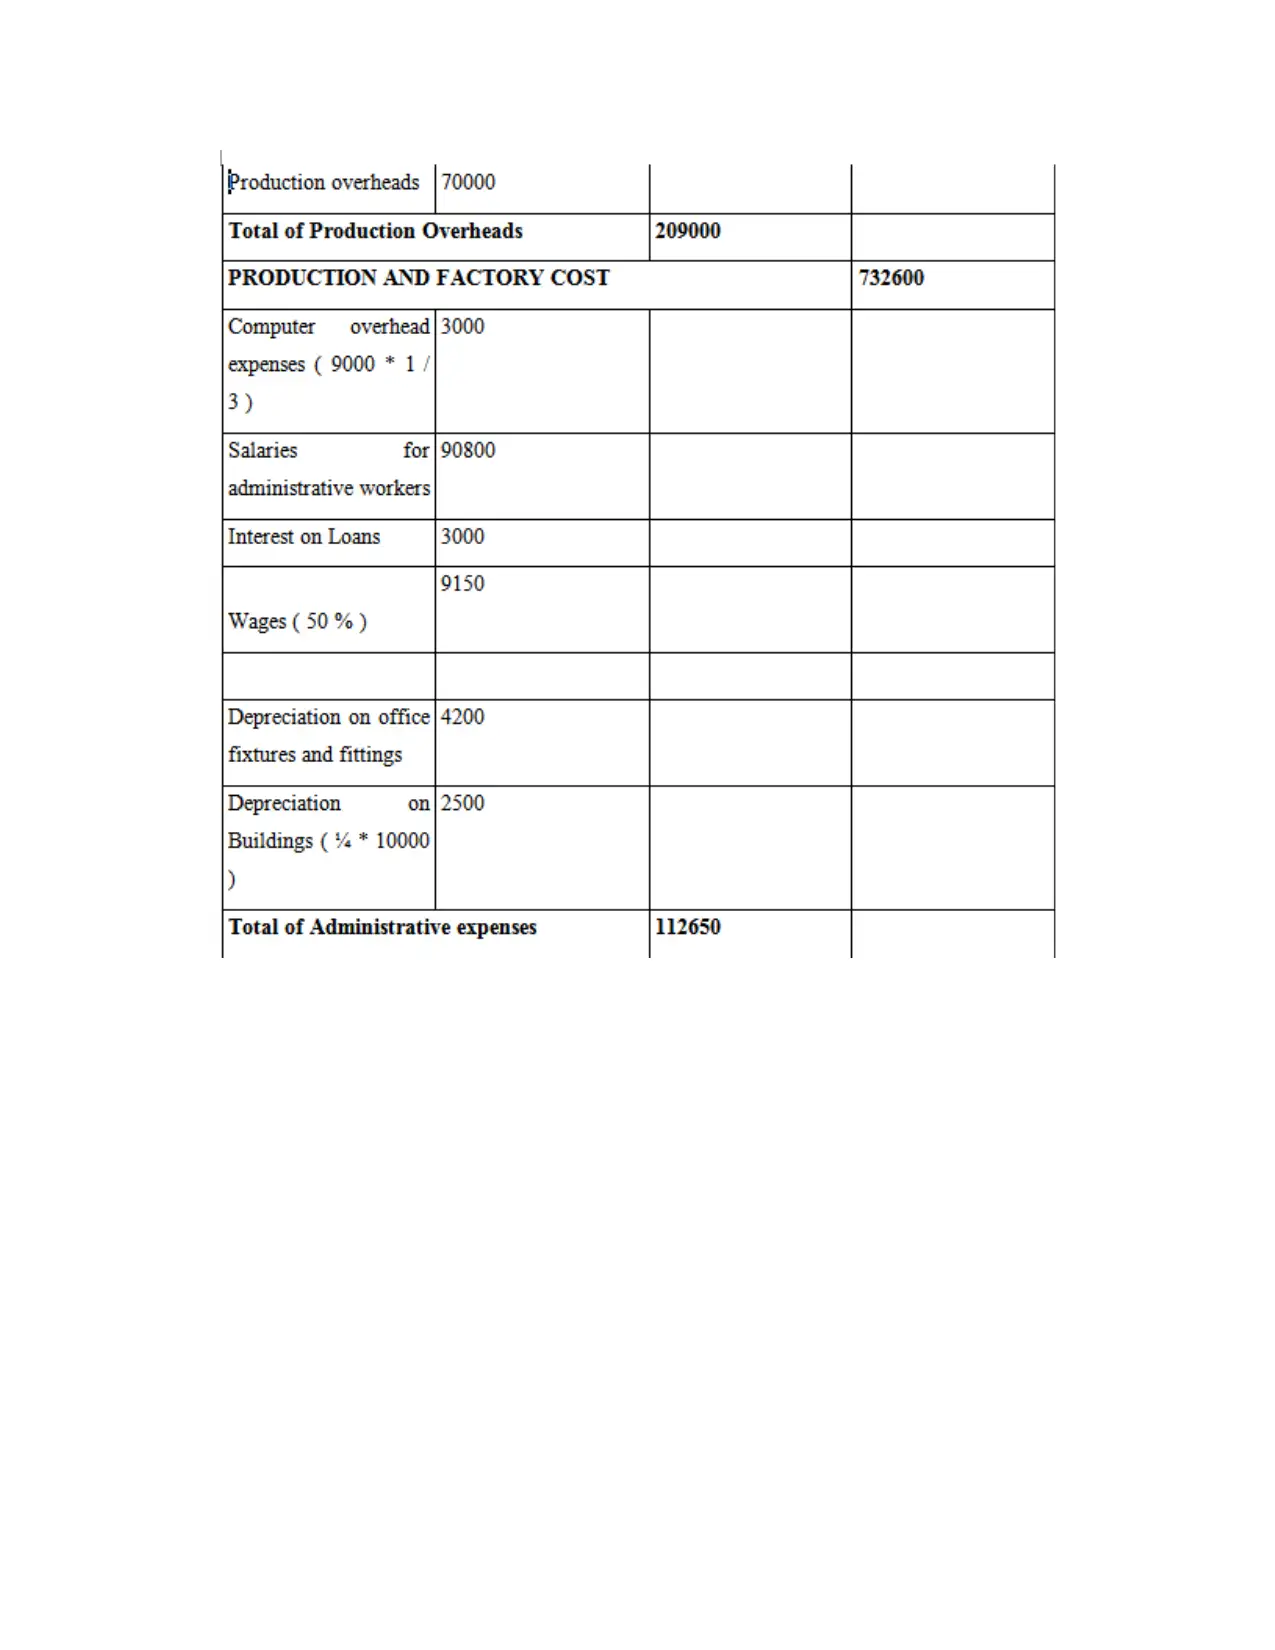
1. Production Cost - This cost mainly represents the specific cost which incurred by a
company as a result of the manufacture of products or services in order to generate more
revenue. The following table shows the manufacturing and factory cost computed for
cost, which is $ 732600 (Mishra, 2021).
2. Administrative expenses - The context of administrative expenses which is considered as
the "business costs" that to expenditure incurred by the organisation that aren't even
directly connected to the company's primary operations. This cost is determined as shown
in the table above. Costa's administrative costs are $ 112650.
3. Prime Cost – Prime cost is considered as the entire cost of production that comprises the
price of raw materials as well as the cost of labour. Costa's prime cost, which is $
523600, is estimated accordingly (Panov and Larionova, 2021).
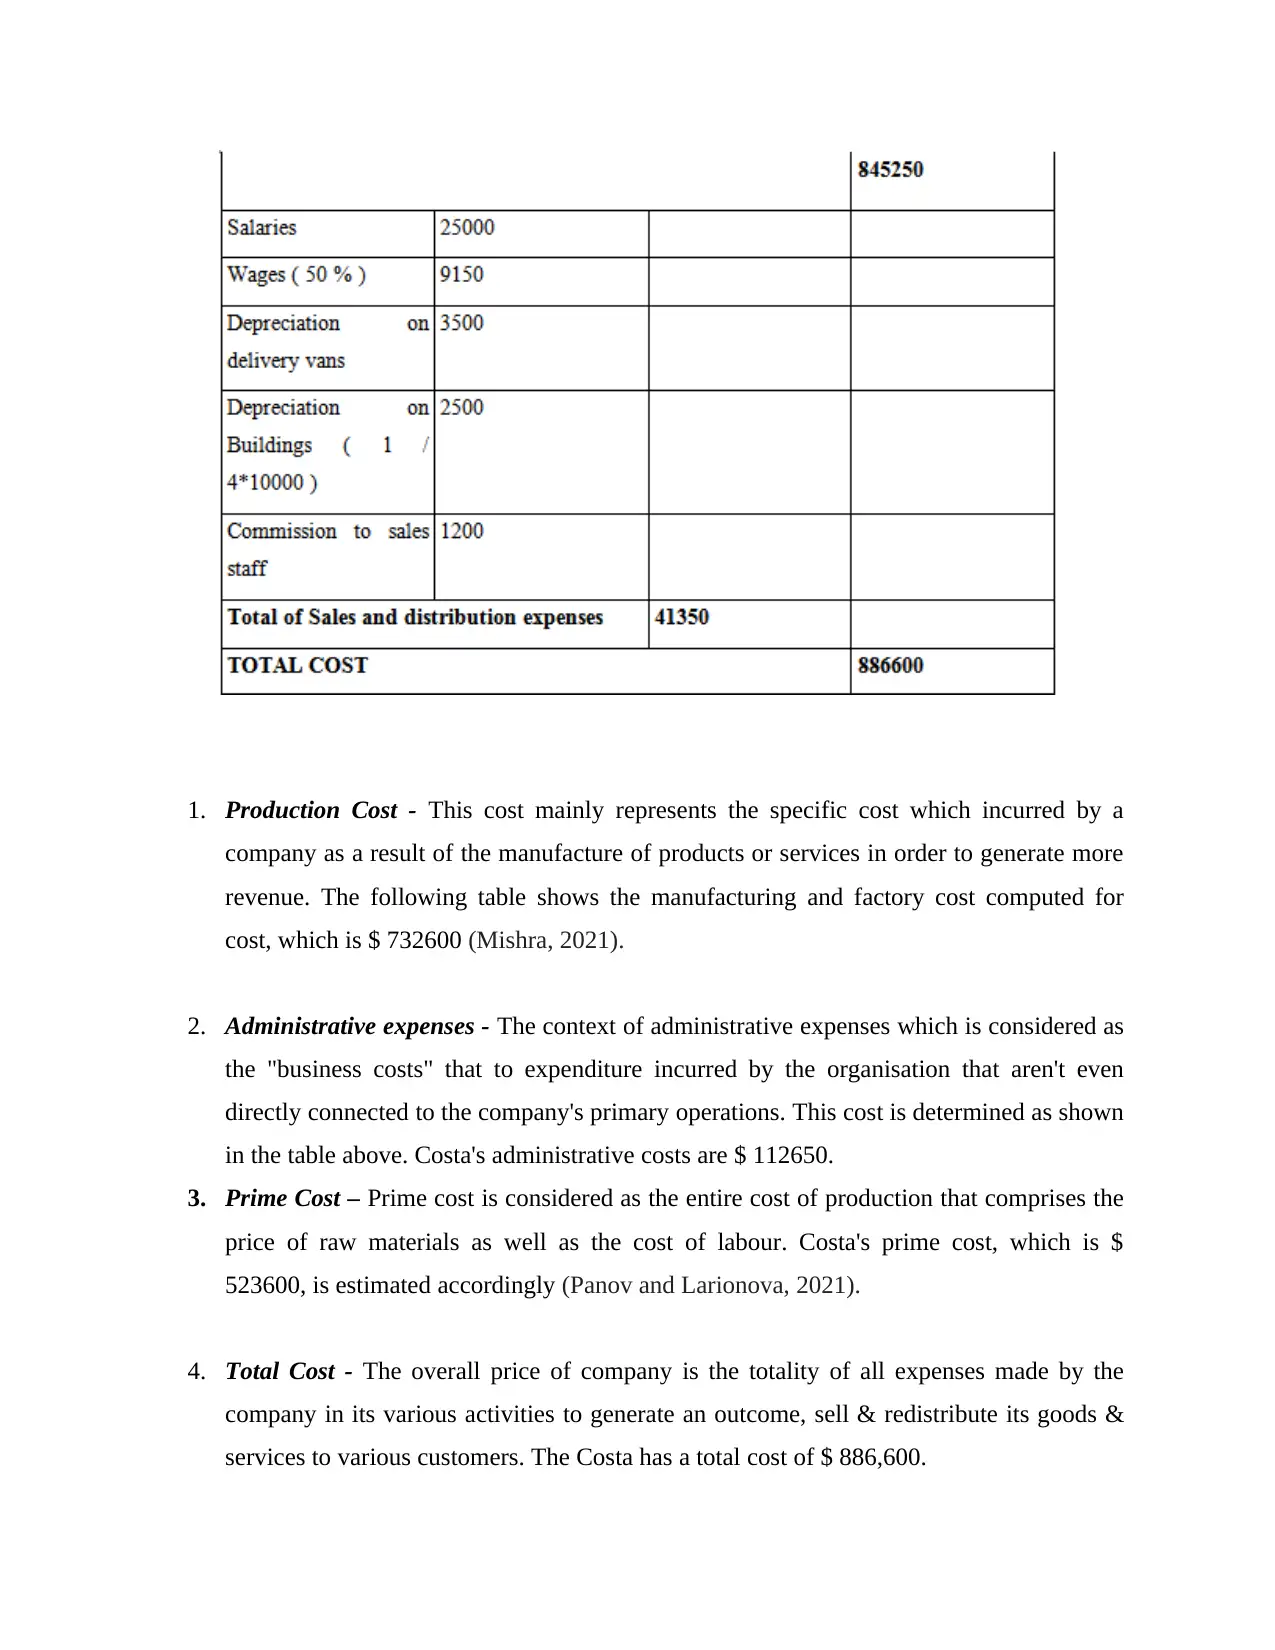
4. Total Cost - The overall price of company is the totality of all expenses made by the
company in its various activities to generate an outcome, sell & redistribute its goods &
services to various customers. The Costa has a total cost of $ 886,600.
company as a result of the manufacture of products or services in order to generate more
revenue. The following table shows the manufacturing and factory cost computed for
cost, which is $ 732600 (Mishra, 2021).
2. Administrative expenses - The context of administrative expenses which is considered as
the "business costs" that to expenditure incurred by the organisation that aren't even
directly connected to the company's primary operations. This cost is determined as shown
in the table above. Costa's administrative costs are $ 112650.
3. Prime Cost – Prime cost is considered as the entire cost of production that comprises the
price of raw materials as well as the cost of labour. Costa's prime cost, which is $
523600, is estimated accordingly (Panov and Larionova, 2021).
4. Total Cost - The overall price of company is the totality of all expenses made by the
company in its various activities to generate an outcome, sell & redistribute its goods &
services to various customers. The Costa has a total cost of $ 886,600.
5. Sales & Distribution expenses - The phrase "operating costs" relates to a firm’s earnings
which aren't even directly related to the company's principal operations. As stated in the
table above, this cost is calculated. The administrative expenses for Costa are $ 112650.
SECTION B -
Question 4 - Analyse the following with examples
Budgeting & Forecasting
Budgeting is the process of making an intend to spend money in the near future. A budget is the
name for this appropriate spending strategy. Making a budget allows individuals or organisation
to determine ahead of time if they will have enough money to do what they needed to do or what
they might wish to do. If company require more money to achieve all they want to do, they may
use this planning approach to concentrate on overall expenditure and invest the money in the
issues that are important to them. A budget proposal is typically created for a fiscal year &
comprises information about anticipated sales and services organisation expenditures during that
time frame (Block, Hirt and Danielsen, 2018).
A corporation may choose very well how company require doing throughout the year by
using this investment situation & considered relevant can be compared to this unique projected
plan. The fundamental motive of these expenditures is to assist the endeavour approach through
planned objectives, scheduled asset assignments & the amount to which climatic change
influences the organisational ability to fulfil objectives (Chernov, 2020).
⊘ This is a preview!⊘
Do you want full access?
Subscribe today to unlock all pages.
Trusted by 1+ million students worldwide
Forecasting is the assessment of possible future events. There is a requirement to prepare to
anticipate prospective actions for the firm subsequently on at the foundation planning phases.
Deals, development, price, resource purchase & financial needs of the firm are all included in
forecasts. Because the budget has a reasonable goal, the amount has considerable flexibility.
Budgeting and forecasting are often used indiscriminately or equated to the same thing (Planning
incorporates Anticipating). Regardless, there is a dividing line that separates. A budget is an
estimate of what will happen at an organizational level throughout the planning horizon, and it
typically includes important activities & consumptions. A prediction can be made for the long
term or for a specific period of time & it can be determined from a hierarchy or broad viewpoint
(Barr and McClellan, 2018).
A well-thought-out budget will provide significant outcomes for the government's key
agenda. Surprisingly, a temporary estimate is largely comprised of completed functionality &
day-to-day organisation requirements. There are various factors are involved such as Sales
budgets, production budgets, flexible budgets & other types of budgeting are examples of budget
(Plaskova and et. al., 2020).
Variance Analysis
In planning or executive accounting, variation analysis is an assessment of variations in
true behaviour vs. estimated or planned conduct. This is primarily concerned by how the contrast
between genuine & arranged practises affects company performance. Organisations may use
variance measure to appropriate understand current expenses & prepare for future expenditures.
Companies regularly do the Variance Analysis that is a quantitative approach of the differences
between planned and actual costs & earnings. Both earnings & expenses can be subjected to
variance analysis. Change is said to as 'Favourable' when actual outcomes are superior to planned
ones. Variation is said to as 'adverse' or 'unfavourable' when the appropriate consequences are
worse than the expected. Analyzing, for instances, the anticipated production costs was 150000,
but the reality production cost was 180000, indicating that variation which is unfavourable.
Paraphrase This Document
Need a fresh take? Get an instant paraphrase of this document with our AI Paraphraser
Adverse Variances
It is determined that an unfavourable variance mainly occurs when the actual pay is less
than the budgeted amount, or actual expenditure exceeds the budgeted amount. This means that
the amount of money spent exceeds the amount of money available. It is determined that a
positive distinction is when true pay outweighs financial planning, or when real usage outweighs
expenditure planning. A negative variance can occur as a result of altering financial
circumstances, such as reduced monetary growth, less private consumption, or a slowdown,
which leads to increased unemployment. Economic conditions might also alter, such as new
competitors joining the marketplace with new products and services. For instance, if the
anticipated sales were 18000 however the actual sales were 15000, the variance is the difference
or unfavourable (Popkova and et. al., 2019).
Favourable Variances
A Favourable Variances occur when actual pay exceeds expenditure plan, or when actual
use falls short of budget statement. This is the same as having an excess where expenditure
exceeds available income. It is analysed that, an optimum variation indicates that an organisation
has either generated more revenue or incurred less expenditure than expected (Jones and et. al.,
2018). This is determined that excess of a norm or projected sum above the true sum carried
about at a cost. When it comes to income, one ideal shift would be when the real income is
regarded to be more significant than the usual or projected total. For instance if the anticipated
sales are 18000 but the sales numbers were 20000, the variation is 18000.
Flexible Budget
A flexible budget adjusts to fluctuating real-world revenue levels. Once an accounting
period is completed, real earnings or other changing measurements are entered into the adaptive
proposed budget, which generates a stimulus package that is responsive to pieces of knowledge.
For control reasons, the estimate is then compared to actual expenses (Ueda and et. al., 2020).
An adaptive spending plan require more time to develop, delays the release of budget
summaries, does not measure income variations, and may be irrelevant in some final budget
models. For example, XYZ Company has a $10 million income budget and a $4 million product
expenditure budget. $1 million of the $4 million anticipated expenditure of products sold is set,
whereas $3 million changes directly with income. As an outcome, the variable portion of sales
revenue expenses accounts for 30% of the profits. When the budgeting period is over, XYZ
discovers that the sales were actually $9 million. If it utilised an adaptive spending plan, the
appropriate portion of the appropriate cost of goods sold would still be $1 million, but still the
variable portion will decrease to $2.7 million, because it is determined that 30 % of income all
the times. As a consequence, an adaptive spending plan generates a planned product sales
expenditure of the $3.7 million at a $9 million profit level, instead of just the $4 million that a
static financial plan would generate (Cosenz and Noto, 2018).
Question 6 : Explain the following terms with their formula and examples.
1. Labour Cost – The cost of the labour is one of the largest paid expenditures in every
company. In reality, like expenses account for 5-10% of overall income in the appropaiet
fast food industry. Labour costs encompass not just wages and salary, but also payrolls,
bonuses, overtime, cost of training & insurance.
Formula for determining labour costs in the following areas:-
Labour cost (as % to sales) = (Total labour/ Total sales*100) &
Labour cost (as % to operating cost) = (Total labour/Total operating cost*100)
For instance, in a restaurant business, there is annual labour cost of 84000 pound, operating cost
is 4, 12,000 pound and suppose their revenue during the accounting year is 11,25,600 pound.
Then the labour cost will be -
Percentage to sales= (84000/1125600*100)
=7.46%
Percentage to operating cost=(84000/412000*100)
=20.39%
⊘ This is a preview!⊘
Do you want full access?
Subscribe today to unlock all pages.
Trusted by 1+ million students worldwide
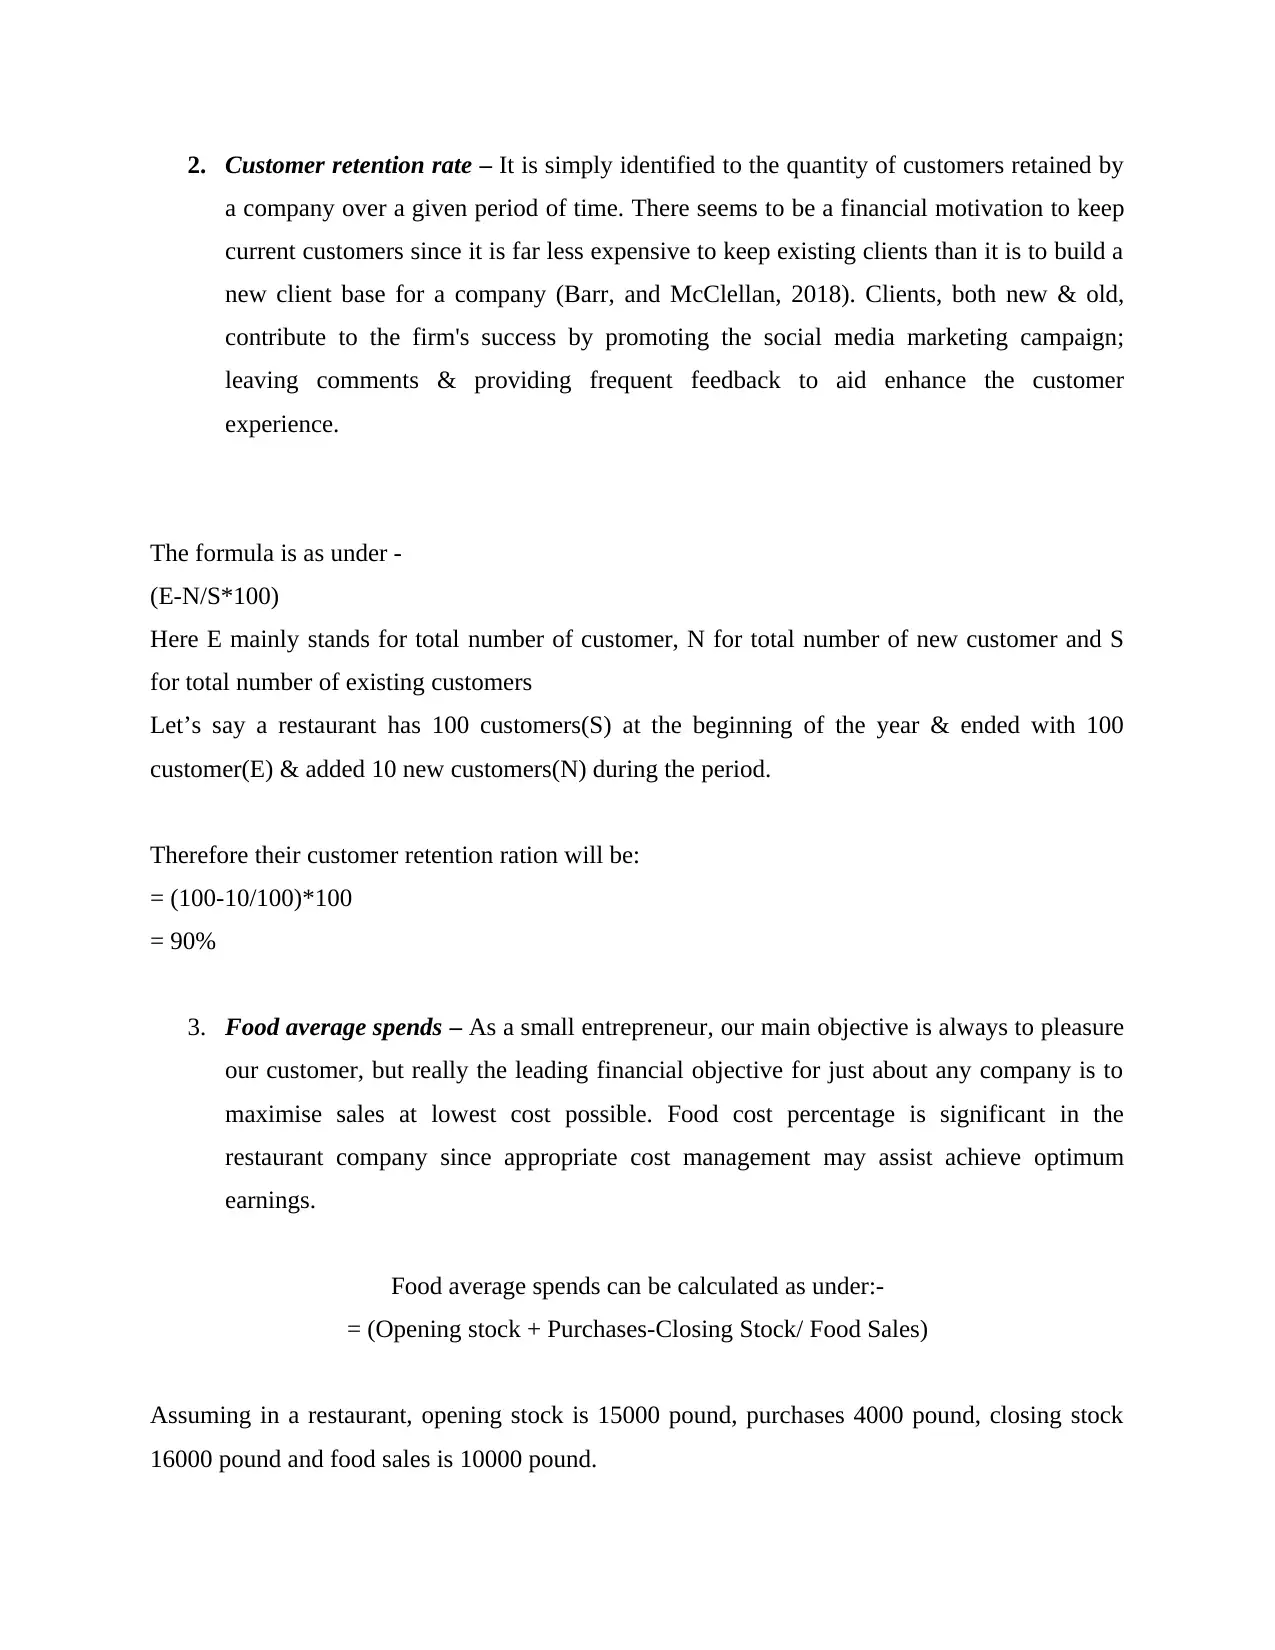
2. Customer retention rate – It is simply identified to the quantity of customers retained by
a company over a given period of time. There seems to be a financial motivation to keep
current customers since it is far less expensive to keep existing clients than it is to build a
new client base for a company (Barr, and McClellan, 2018). Clients, both new & old,
contribute to the firm's success by promoting the social media marketing campaign;
leaving comments & providing frequent feedback to aid enhance the customer
experience.
The formula is as under -
(E-N/S*100)
Here E mainly stands for total number of customer, N for total number of new customer and S
for total number of existing customers
Let’s say a restaurant has 100 customers(S) at the beginning of the year & ended with 100
customer(E) & added 10 new customers(N) during the period.
Therefore their customer retention ration will be:
= (100-10/100)*100
= 90%
3. Food average spends – As a small entrepreneur, our main objective is always to pleasure
our customer, but really the leading financial objective for just about any company is to
maximise sales at lowest cost possible. Food cost percentage is significant in the
restaurant company since appropriate cost management may assist achieve optimum
earnings.
Food average spends can be calculated as under:-
= (Opening stock + Purchases-Closing Stock/ Food Sales)
Assuming in a restaurant, opening stock is 15000 pound, purchases 4000 pound, closing stock
16000 pound and food sales is 10000 pound.
Paraphrase This Document
Need a fresh take? Get an instant paraphrase of this document with our AI Paraphraser
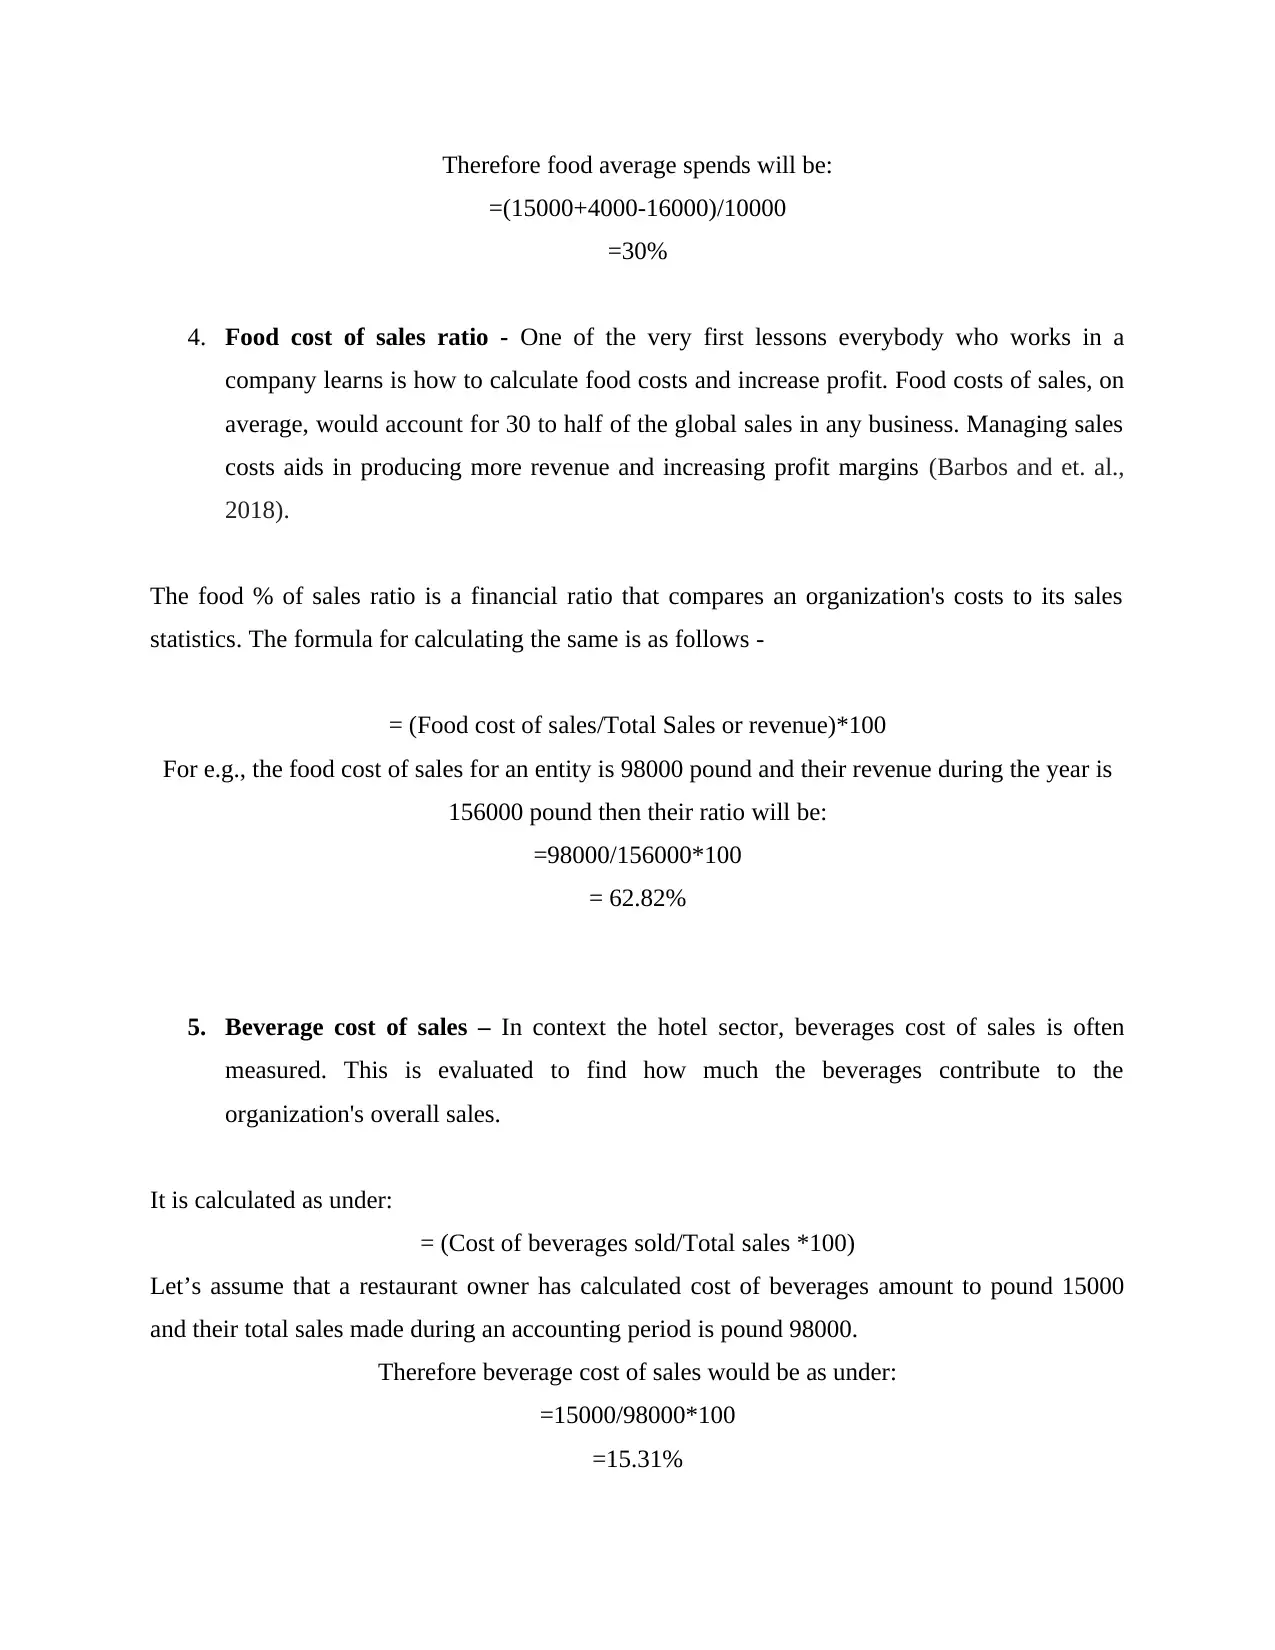
Therefore food average spends will be:
=(15000+4000-16000)/10000
=30%
4. Food cost of sales ratio - One of the very first lessons everybody who works in a
company learns is how to calculate food costs and increase profit. Food costs of sales, on
average, would account for 30 to half of the global sales in any business. Managing sales
costs aids in producing more revenue and increasing profit margins (Barbos and et. al.,
2018).
The food % of sales ratio is a financial ratio that compares an organization's costs to its sales
statistics. The formula for calculating the same is as follows -
= (Food cost of sales/Total Sales or revenue)*100
For e.g., the food cost of sales for an entity is 98000 pound and their revenue during the year is
156000 pound then their ratio will be:
=98000/156000*100
= 62.82%
5. Beverage cost of sales – In context the hotel sector, beverages cost of sales is often
measured. This is evaluated to find how much the beverages contribute to the
organization's overall sales.
It is calculated as under:
= (Cost of beverages sold/Total sales *100)
Let’s assume that a restaurant owner has calculated cost of beverages amount to pound 15000
and their total sales made during an accounting period is pound 98000.
Therefore beverage cost of sales would be as under:
=15000/98000*100
=15.31%
CONCLUSION
According to this report, it concluded that it is necessary to managing the financial resources
in every organisation. In this report, various types of cost are calculated with the help of various
examples. It is determined that foregoing analysis is necessary in order to analyse the funding
planning which is considered as the vital component for the company. In this report, it is
analysed that for the organisation, it is necessary to avoid the unnecessary cost. In this report, the
development of the project budget is mainly considered by the organisation. Organisation needs
to focus on the managing the financial resources.
⊘ This is a preview!⊘
Do you want full access?
Subscribe today to unlock all pages.
Trusted by 1+ million students worldwide
1 out of 13
Related Documents


Your All-in-One AI-Powered Toolkit for Academic Success.
+13062052269
info@desklib.com
Available 24*7 on WhatsApp / Email
![[object Object]](/_next/static/media/star-bottom.7253800d.svg)
Unlock your academic potential
Copyright © 2020–2026 A2Z Services. All Rights Reserved. Developed and managed by ZUCOL.