Cost Analysis and Management Report
VerifiedAdded on 2020/02/19
|10
|2104
|135
Report
AI Summary
This report presents a comprehensive analysis of various costing methods, including process costing, activity-based costing, and their implications for financial management. It covers physical flow analysis, equivalent units calculation, cost reconciliation, and the impact of sustainability on financial decisions. The report also discusses the differences between absorption and variable costing, providing detailed income statements and recommendations for improved cost management strategies.
Question 1 Process costing system
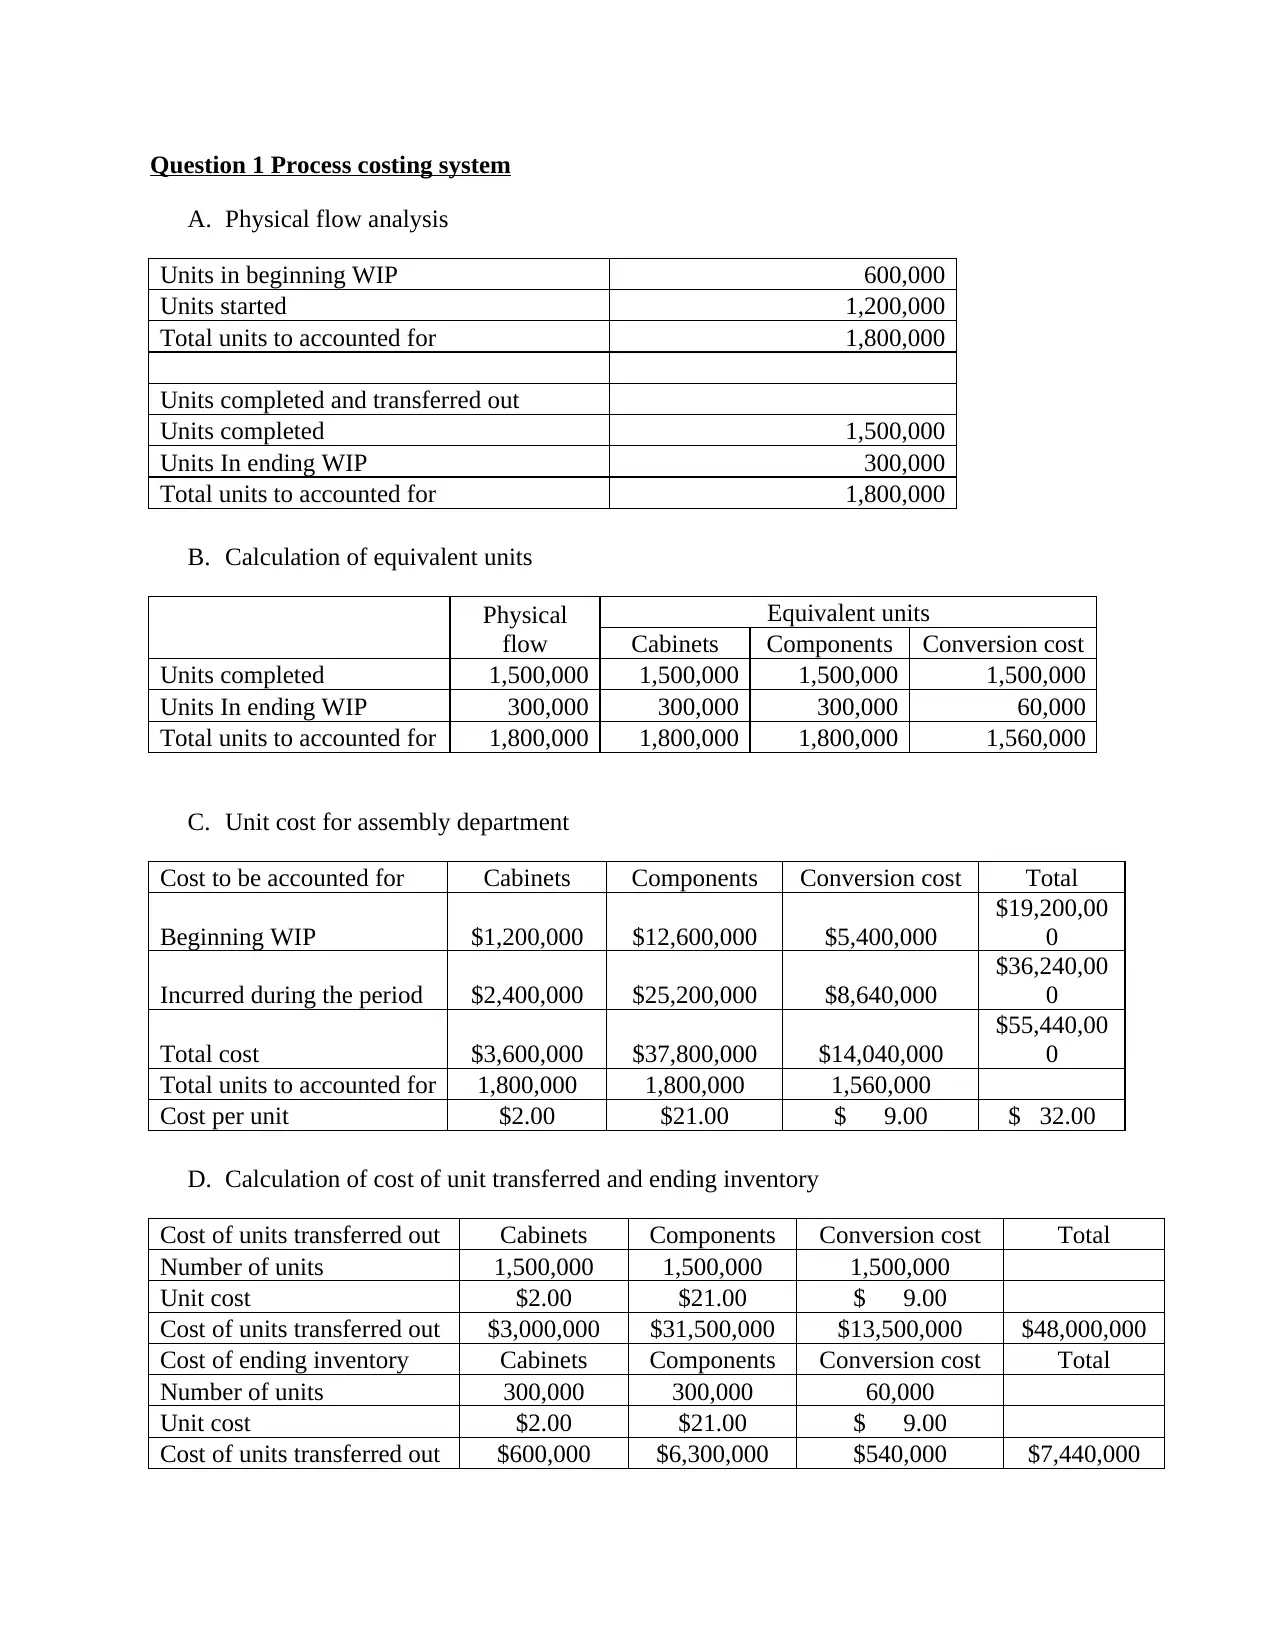
A. Physical flow analysis
Units in beginning WIP 600,000
Units started 1,200,000
Total units to accounted for 1,800,000
Units completed and transferred out
Units completed 1,500,000
Units In ending WIP 300,000
Total units to accounted for 1,800,000
B. Calculation of equivalent units
Physical
flow
Equivalent units
Cabinets Components Conversion cost
Units completed 1,500,000 1,500,000 1,500,000 1,500,000
Units In ending WIP 300,000 300,000 300,000 60,000
Total units to accounted for 1,800,000 1,800,000 1,800,000 1,560,000
C. Unit cost for assembly department
Cost to be accounted for Cabinets Components Conversion cost Total
Beginning WIP $1,200,000 $12,600,000 $5,400,000
$19,200,00
0
Incurred during the period $2,400,000 $25,200,000 $8,640,000
$36,240,00
0
Total cost $3,600,000 $37,800,000 $14,040,000
$55,440,00
0
Total units to accounted for 1,800,000 1,800,000 1,560,000
Cost per unit $2.00 $21.00 $ 9.00 $ 32.00
D. Calculation of cost of unit transferred and ending inventory
Cost of units transferred out Cabinets Components Conversion cost Total
Number of units 1,500,000 1,500,000 1,500,000
Unit cost $2.00 $21.00 $ 9.00
Cost of units transferred out $3,000,000 $31,500,000 $13,500,000 $48,000,000
Cost of ending inventory Cabinets Components Conversion cost Total
Number of units 300,000 300,000 60,000
Unit cost $2.00 $21.00 $ 9.00
Cost of units transferred out $600,000 $6,300,000 $540,000 $7,440,000
Paraphrase This Document
Need a fresh take? Get an instant paraphrase of this document with our AI Paraphraser
E. Cost reconciliation statement
Cost to be accounted for
Beginning WIP $ 19,200,000
Incurred during the period $ 36,240,000
Total $ 55,440,000
Const accounted for
Cost of units transferred out $ 48,000,000
Cost of ending inventory $ 7,440,000
Total $ 55,440,000
Question 2 Accounting for sustainability
A. Financial, environmental, social and Economic issues needs to taken into account
Financial
Cost of setup of factory at East Asia $1,200,000
Benefit due to reduction in cost of production of off shore pre-processing $0.22 Per Kilogram
Environmental
Purchase cost of improvement of filtering system $290,000
Running cost of improvement of filtering system $17,500 per annum
Social
Company’s reputation due to filtering system will improve
Cost of reduction of staff redundancies $285,000
Cost of external consultant for being mediator among management and staff $43,000
Economic
Quality of product will remain same if the pre-processing is undertaken off shore
B. Additional Factors
The company should focus regarding the reduction of health related problems and lower
wages to the employees.
The company should also take care regarding governmental and political issues involved
in off shore pre-processing.
The company sold take actions regarding the wrong stories published by the newspaper
so that company’s social image will secure.
Question 3
Part A Cost behavior
A. Scattered diagram
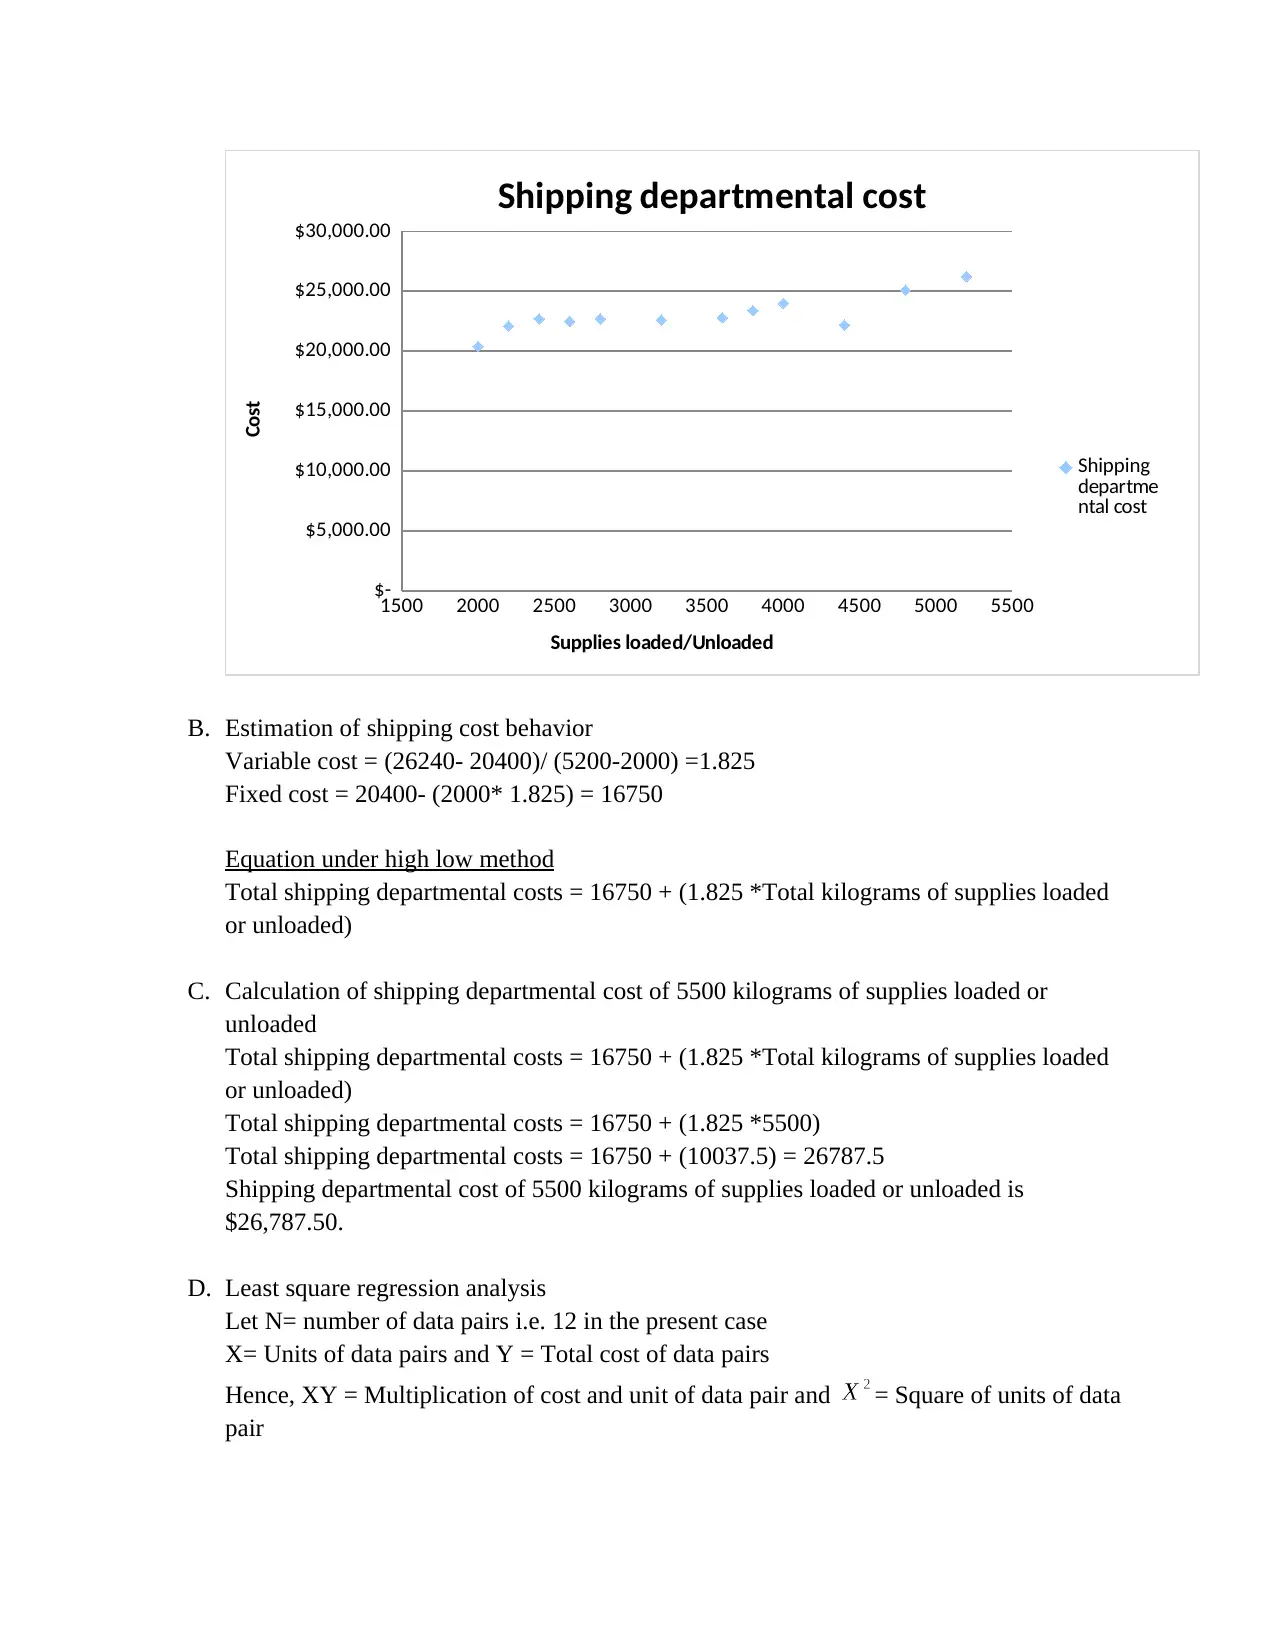
1500 2000 2500 3000 3500 4000 4500 5000 5500
$-
$5,000.00
$10,000.00
$15,000.00
$20,000.00
$25,000.00
$30,000.00
Shipping departmental cost
Shipping
departme
ntal cost
Supplies loaded/Unloaded
Cost
B. Estimation of shipping cost behavior
Variable cost = (26240- 20400)/ (5200-2000) =1.825
Fixed cost = 20400- (2000* 1.825) = 16750
Equation under high low method
Total shipping departmental costs = 16750 + (1.825 *Total kilograms of supplies loaded
or unloaded)
C. Calculation of shipping departmental cost of 5500 kilograms of supplies loaded or
unloaded
Total shipping departmental costs = 16750 + (1.825 *Total kilograms of supplies loaded
or unloaded)
Total shipping departmental costs = 16750 + (1.825 *5500)
Total shipping departmental costs = 16750 + (10037.5) = 26787.5
Shipping departmental cost of 5500 kilograms of supplies loaded or unloaded is
$26,787.50.
D. Least square regression analysis
Let N= number of data pairs i.e. 12 in the present case
X= Units of data pairs and Y = Total cost of data pairs
Hence, XY = Multiplication of cost and unit of data pair and = Square of units of data
pair
⊘ This is a preview!⊘
Do you want full access?
Subscribe today to unlock all pages.
Trusted by 1+ million students worldwide
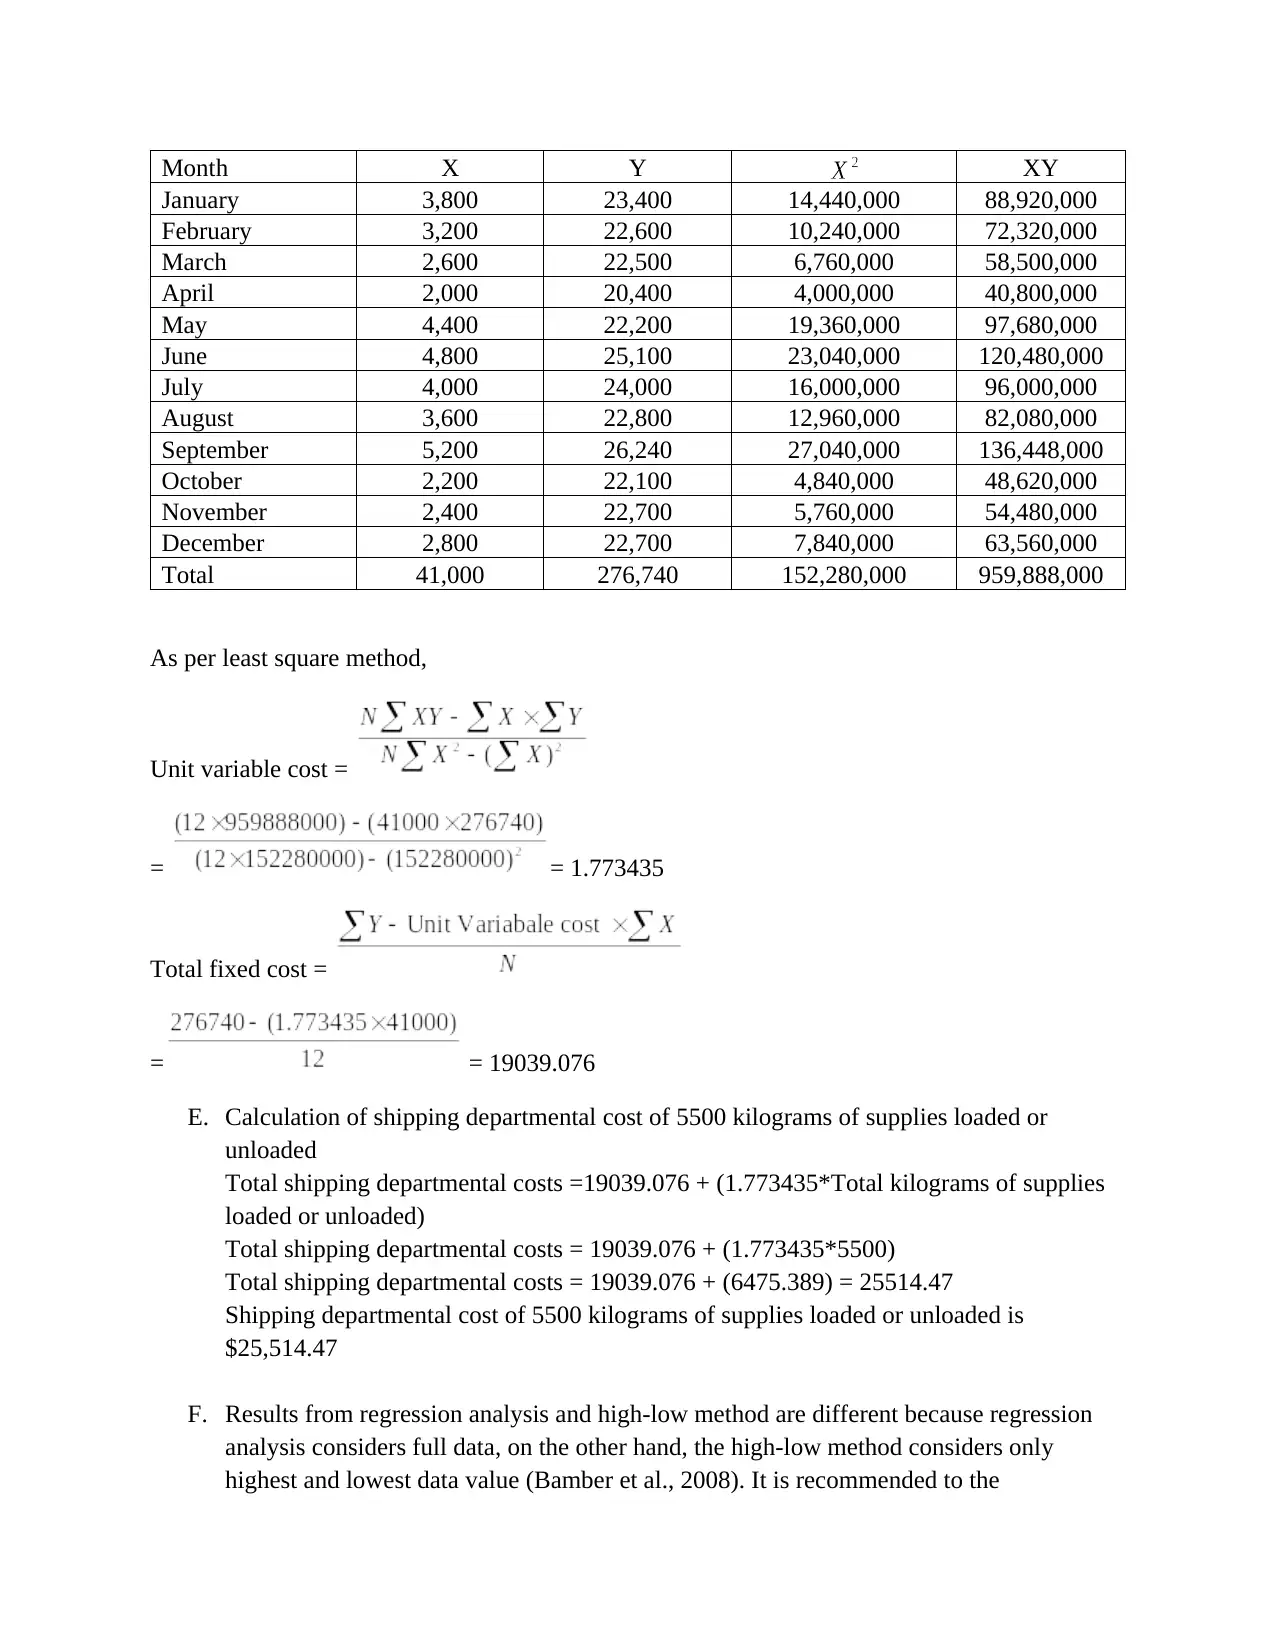
Month X Y XY
January 3,800 23,400 14,440,000 88,920,000
February 3,200 22,600 10,240,000 72,320,000
March 2,600 22,500 6,760,000 58,500,000
April 2,000 20,400 4,000,000 40,800,000
May 4,400 22,200 19,360,000 97,680,000
June 4,800 25,100 23,040,000 120,480,000
July 4,000 24,000 16,000,000 96,000,000
August 3,600 22,800 12,960,000 82,080,000
September 5,200 26,240 27,040,000 136,448,000
October 2,200 22,100 4,840,000 48,620,000
November 2,400 22,700 5,760,000 54,480,000
December 2,800 22,700 7,840,000 63,560,000
Total 41,000 276,740 152,280,000 959,888,000
As per least square method,
Unit variable cost =
= = 1.773435
Total fixed cost =
= = 19039.076
E. Calculation of shipping departmental cost of 5500 kilograms of supplies loaded or
unloaded
Total shipping departmental costs =19039.076 + (1.773435*Total kilograms of supplies
loaded or unloaded)
Total shipping departmental costs = 19039.076 + (1.773435*5500)
Total shipping departmental costs = 19039.076 + (6475.389) = 25514.47
Shipping departmental cost of 5500 kilograms of supplies loaded or unloaded is
$25,514.47
F. Results from regression analysis and high-low method are different because regression
analysis considers full data, on the other hand, the high-low method considers only
highest and lowest data value (Bamber et al., 2008). It is recommended to the
Paraphrase This Document
Need a fresh take? Get an instant paraphrase of this document with our AI Paraphraser
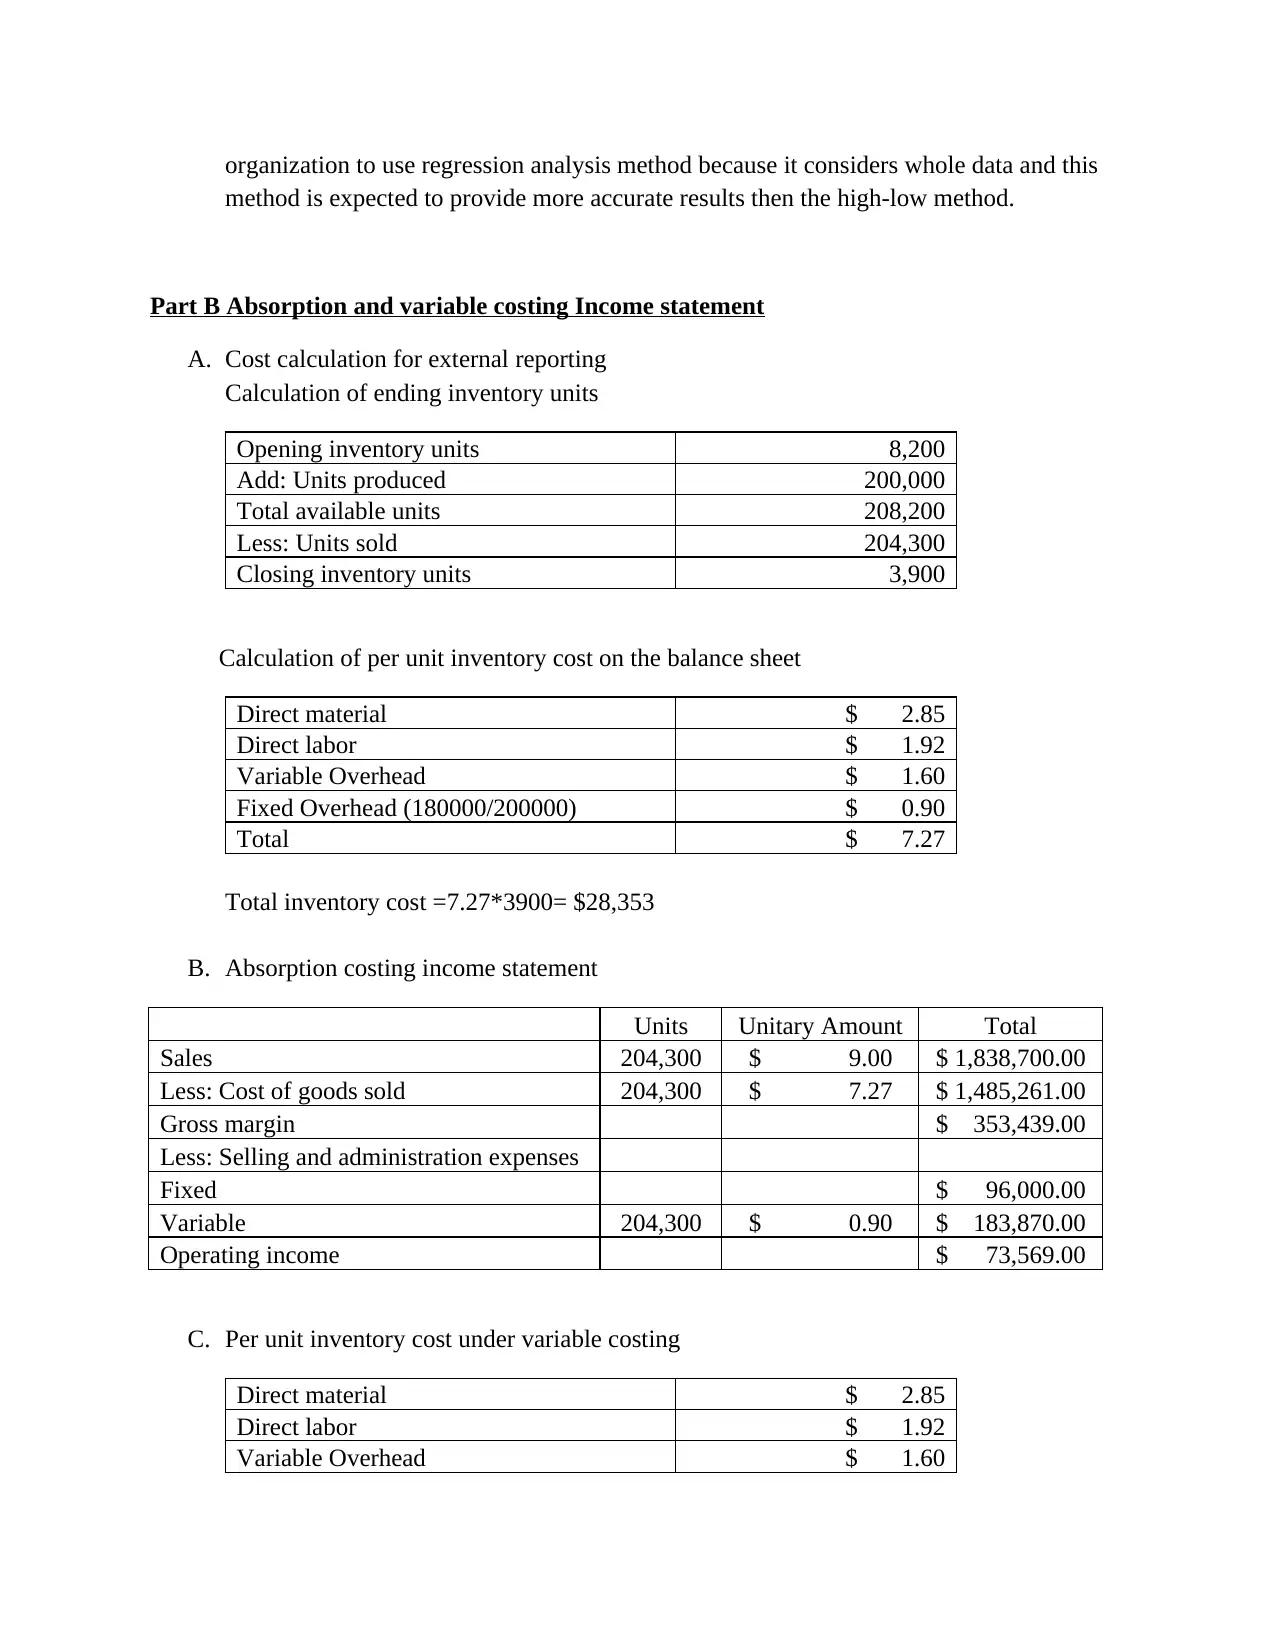
organization to use regression analysis method because it considers whole data and this
method is expected to provide more accurate results then the high-low method.
Part B Absorption and variable costing Income statement
A. Cost calculation for external reporting
Calculation of ending inventory units
Opening inventory units 8,200
Add: Units produced 200,000
Total available units 208,200
Less: Units sold 204,300
Closing inventory units 3,900
Calculation of per unit inventory cost on the balance sheet
Direct material $ 2.85
Direct labor $ 1.92
Variable Overhead $ 1.60
Fixed Overhead (180000/200000) $ 0.90
Total $ 7.27
Total inventory cost =7.27*3900= $28,353
B. Absorption costing income statement
Units Unitary Amount Total
Sales 204,300 $ 9.00 $ 1,838,700.00
Less: Cost of goods sold 204,300 $ 7.27 $ 1,485,261.00
Gross margin $ 353,439.00
Less: Selling and administration expenses
Fixed $ 96,000.00
Variable 204,300 $ 0.90 $ 183,870.00
Operating income $ 73,569.00
C. Per unit inventory cost under variable costing
Direct material $ 2.85
Direct labor $ 1.92
Variable Overhead $ 1.60
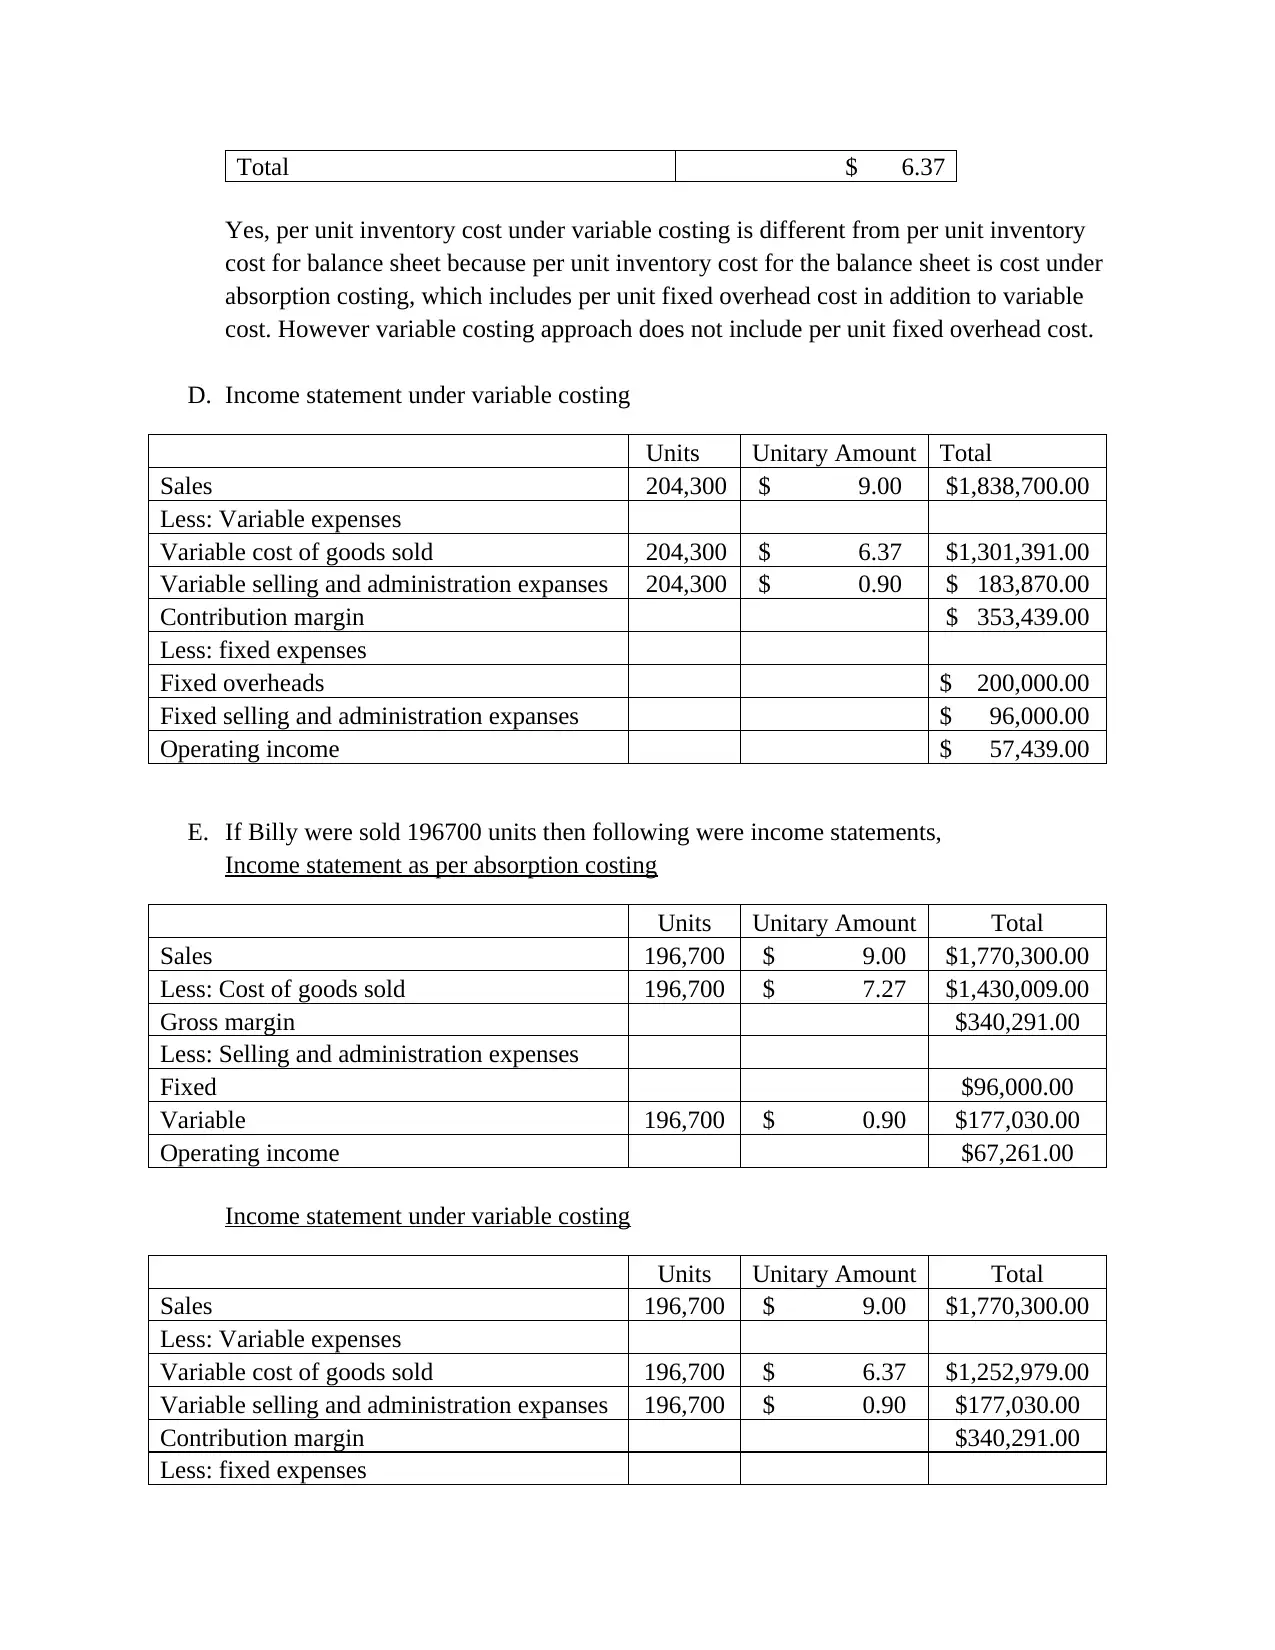
Total $ 6.37
Yes, per unit inventory cost under variable costing is different from per unit inventory
cost for balance sheet because per unit inventory cost for the balance sheet is cost under
absorption costing, which includes per unit fixed overhead cost in addition to variable
cost. However variable costing approach does not include per unit fixed overhead cost.
D. Income statement under variable costing
Units Unitary Amount Total
Sales 204,300 $ 9.00 $1,838,700.00
Less: Variable expenses
Variable cost of goods sold 204,300 $ 6.37 $1,301,391.00
Variable selling and administration expanses 204,300 $ 0.90 $ 183,870.00
Contribution margin $ 353,439.00
Less: fixed expenses
Fixed overheads $ 200,000.00
Fixed selling and administration expanses $ 96,000.00
Operating income $ 57,439.00
E. If Billy were sold 196700 units then following were income statements,
Income statement as per absorption costing
Units Unitary Amount Total
Sales 196,700 $ 9.00 $1,770,300.00
Less: Cost of goods sold 196,700 $ 7.27 $1,430,009.00
Gross margin $340,291.00
Less: Selling and administration expenses
Fixed $96,000.00
Variable 196,700 $ 0.90 $177,030.00
Operating income $67,261.00
Income statement under variable costing
Units Unitary Amount Total
Sales 196,700 $ 9.00 $1,770,300.00
Less: Variable expenses
Variable cost of goods sold 196,700 $ 6.37 $1,252,979.00
Variable selling and administration expanses 196,700 $ 0.90 $177,030.00
Contribution margin $340,291.00
Less: fixed expenses
⊘ This is a preview!⊘
Do you want full access?
Subscribe today to unlock all pages.
Trusted by 1+ million students worldwide
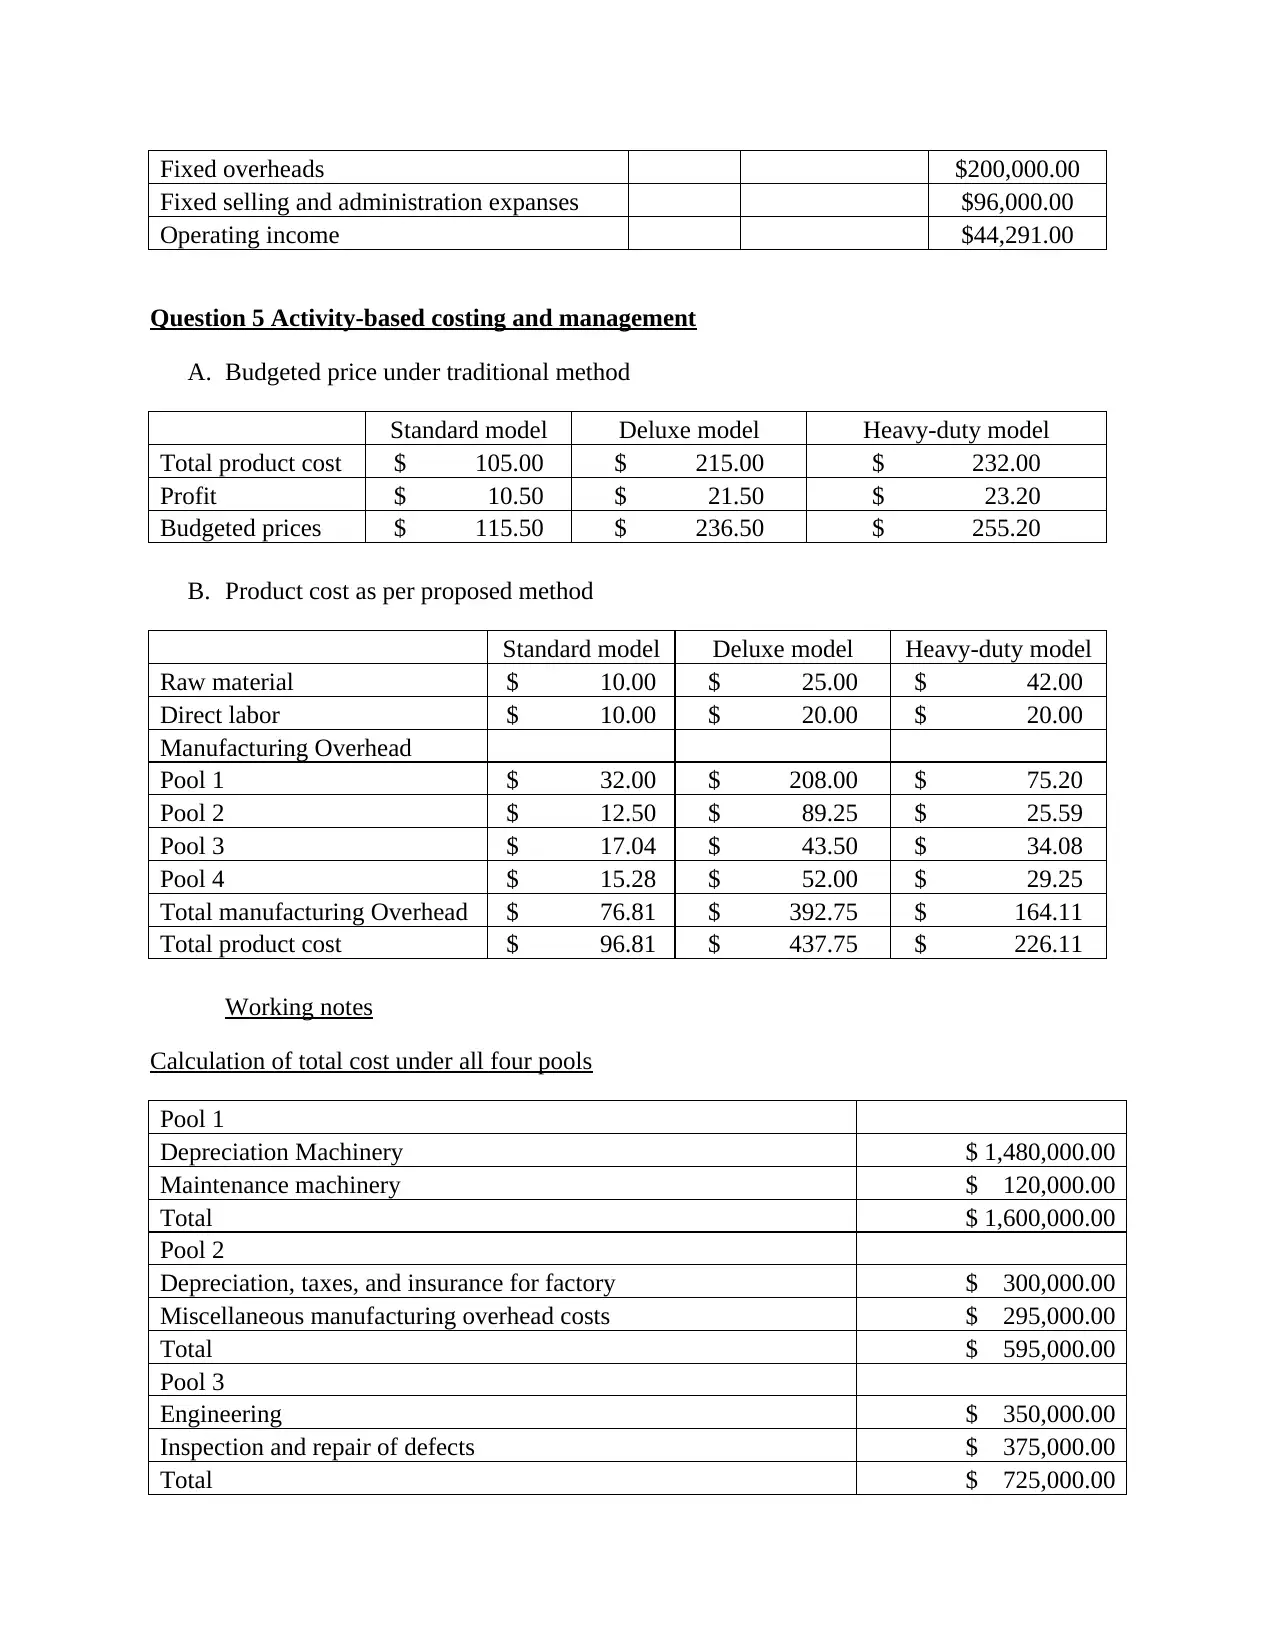
Fixed overheads $200,000.00
Fixed selling and administration expanses $96,000.00
Operating income $44,291.00
Question 5 Activity-based costing and management
A. Budgeted price under traditional method
Standard model Deluxe model Heavy-duty model
Total product cost $ 105.00 $ 215.00 $ 232.00
Profit $ 10.50 $ 21.50 $ 23.20
Budgeted prices $ 115.50 $ 236.50 $ 255.20
B. Product cost as per proposed method
Standard model Deluxe model Heavy-duty model
Raw material $ 10.00 $ 25.00 $ 42.00
Direct labor $ 10.00 $ 20.00 $ 20.00
Manufacturing Overhead
Pool 1 $ 32.00 $ 208.00 $ 75.20
Pool 2 $ 12.50 $ 89.25 $ 25.59
Pool 3 $ 17.04 $ 43.50 $ 34.08
Pool 4 $ 15.28 $ 52.00 $ 29.25
Total manufacturing Overhead $ 76.81 $ 392.75 $ 164.11
Total product cost $ 96.81 $ 437.75 $ 226.11
Working notes
Calculation of total cost under all four pools
Pool 1
Depreciation Machinery $ 1,480,000.00
Maintenance machinery $ 120,000.00
Total $ 1,600,000.00
Pool 2
Depreciation, taxes, and insurance for factory $ 300,000.00
Miscellaneous manufacturing overhead costs $ 295,000.00
Total $ 595,000.00
Pool 3
Engineering $ 350,000.00
Inspection and repair of defects $ 375,000.00
Total $ 725,000.00
Paraphrase This Document
Need a fresh take? Get an instant paraphrase of this document with our AI Paraphraser
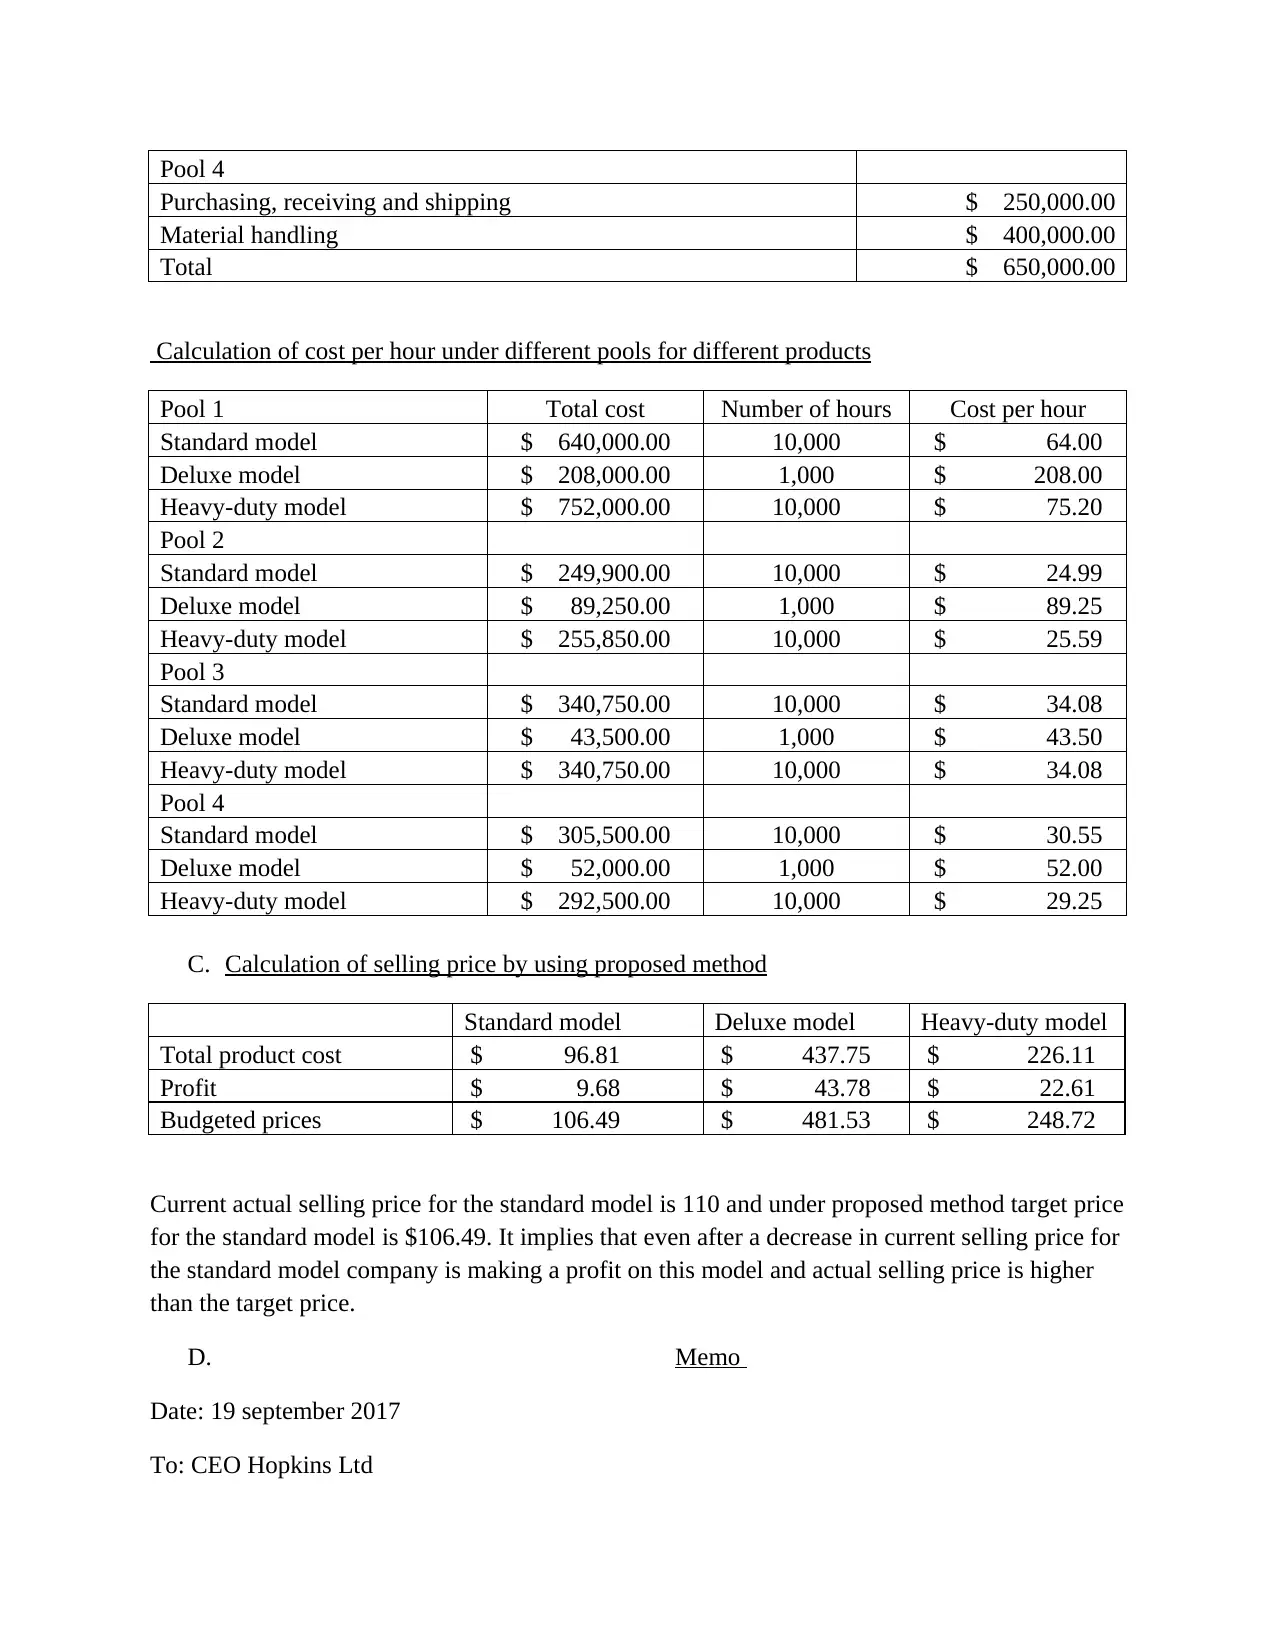
Pool 4
Purchasing, receiving and shipping $ 250,000.00
Material handling $ 400,000.00
Total $ 650,000.00
Calculation of cost per hour under different pools for different products
Pool 1 Total cost Number of hours Cost per hour
Standard model $ 640,000.00 10,000 $ 64.00
Deluxe model $ 208,000.00 1,000 $ 208.00
Heavy-duty model $ 752,000.00 10,000 $ 75.20
Pool 2
Standard model $ 249,900.00 10,000 $ 24.99
Deluxe model $ 89,250.00 1,000 $ 89.25
Heavy-duty model $ 255,850.00 10,000 $ 25.59
Pool 3
Standard model $ 340,750.00 10,000 $ 34.08
Deluxe model $ 43,500.00 1,000 $ 43.50
Heavy-duty model $ 340,750.00 10,000 $ 34.08
Pool 4
Standard model $ 305,500.00 10,000 $ 30.55
Deluxe model $ 52,000.00 1,000 $ 52.00
Heavy-duty model $ 292,500.00 10,000 $ 29.25
C. Calculation of selling price by using proposed method
Standard model Deluxe model Heavy-duty model
Total product cost $ 96.81 $ 437.75 $ 226.11
Profit $ 9.68 $ 43.78 $ 22.61
Budgeted prices $ 106.49 $ 481.53 $ 248.72
Current actual selling price for the standard model is 110 and under proposed method target price
for the standard model is $106.49. It implies that even after a decrease in current selling price for
the standard model company is making a profit on this model and actual selling price is higher
than the target price.
D. Memo
Date: 19 september 2017
To: CEO Hopkins Ltd
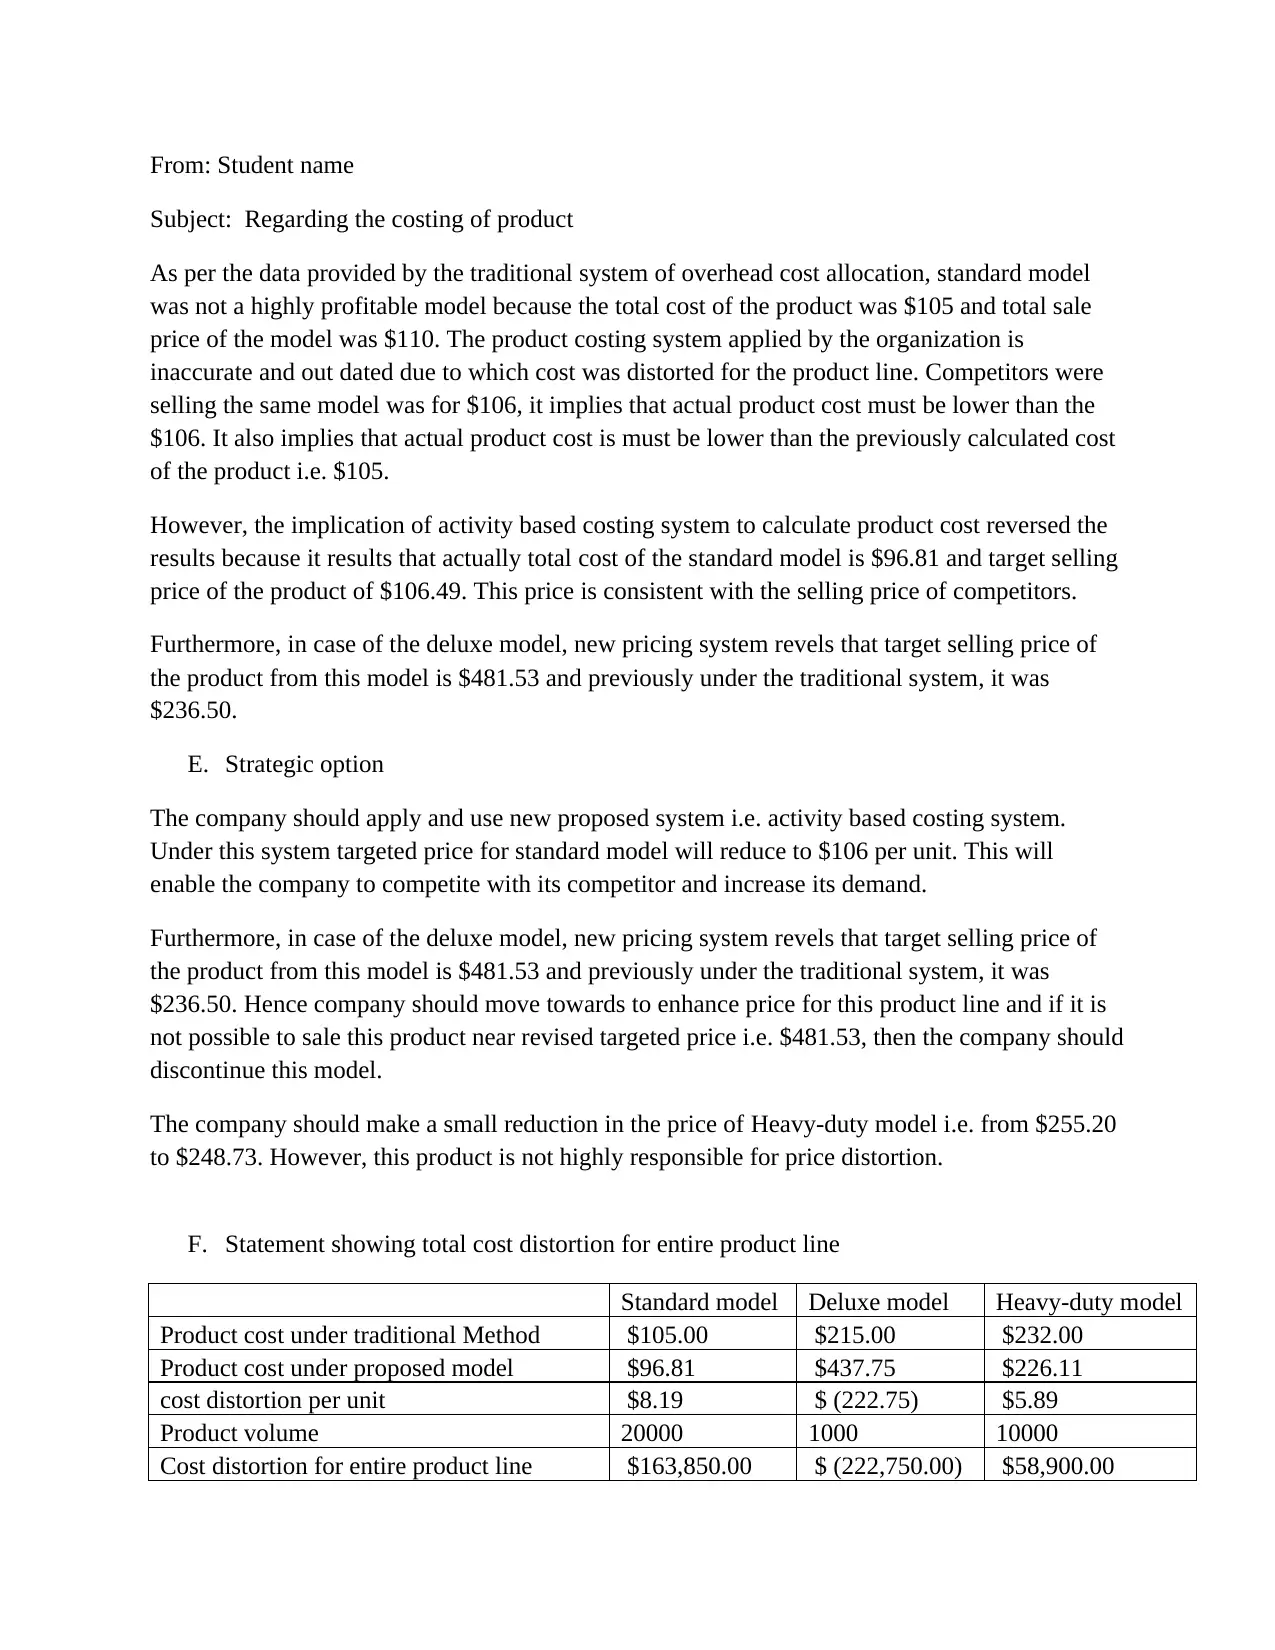
From: Student name
Subject: Regarding the costing of product
As per the data provided by the traditional system of overhead cost allocation, standard model
was not a highly profitable model because the total cost of the product was $105 and total sale
price of the model was $110. The product costing system applied by the organization is
inaccurate and out dated due to which cost was distorted for the product line. Competitors were
selling the same model was for $106, it implies that actual product cost must be lower than the
$106. It also implies that actual product cost is must be lower than the previously calculated cost
of the product i.e. $105.
However, the implication of activity based costing system to calculate product cost reversed the
results because it results that actually total cost of the standard model is $96.81 and target selling
price of the product of $106.49. This price is consistent with the selling price of competitors.
Furthermore, in case of the deluxe model, new pricing system revels that target selling price of
the product from this model is $481.53 and previously under the traditional system, it was
$236.50.
E. Strategic option
The company should apply and use new proposed system i.e. activity based costing system.
Under this system targeted price for standard model will reduce to $106 per unit. This will
enable the company to competite with its competitor and increase its demand.
Furthermore, in case of the deluxe model, new pricing system revels that target selling price of
the product from this model is $481.53 and previously under the traditional system, it was
$236.50. Hence company should move towards to enhance price for this product line and if it is
not possible to sale this product near revised targeted price i.e. $481.53, then the company should
discontinue this model.
The company should make a small reduction in the price of Heavy-duty model i.e. from $255.20
to $248.73. However, this product is not highly responsible for price distortion.
F. Statement showing total cost distortion for entire product line
Standard model Deluxe model Heavy-duty model
Product cost under traditional Method $105.00 $215.00 $232.00
Product cost under proposed model $96.81 $437.75 $226.11
cost distortion per unit $8.19 $ (222.75) $5.89
Product volume 20000 1000 10000
Cost distortion for entire product line $163,850.00 $ (222,750.00) $58,900.00
⊘ This is a preview!⊘
Do you want full access?
Subscribe today to unlock all pages.
Trusted by 1+ million students worldwide
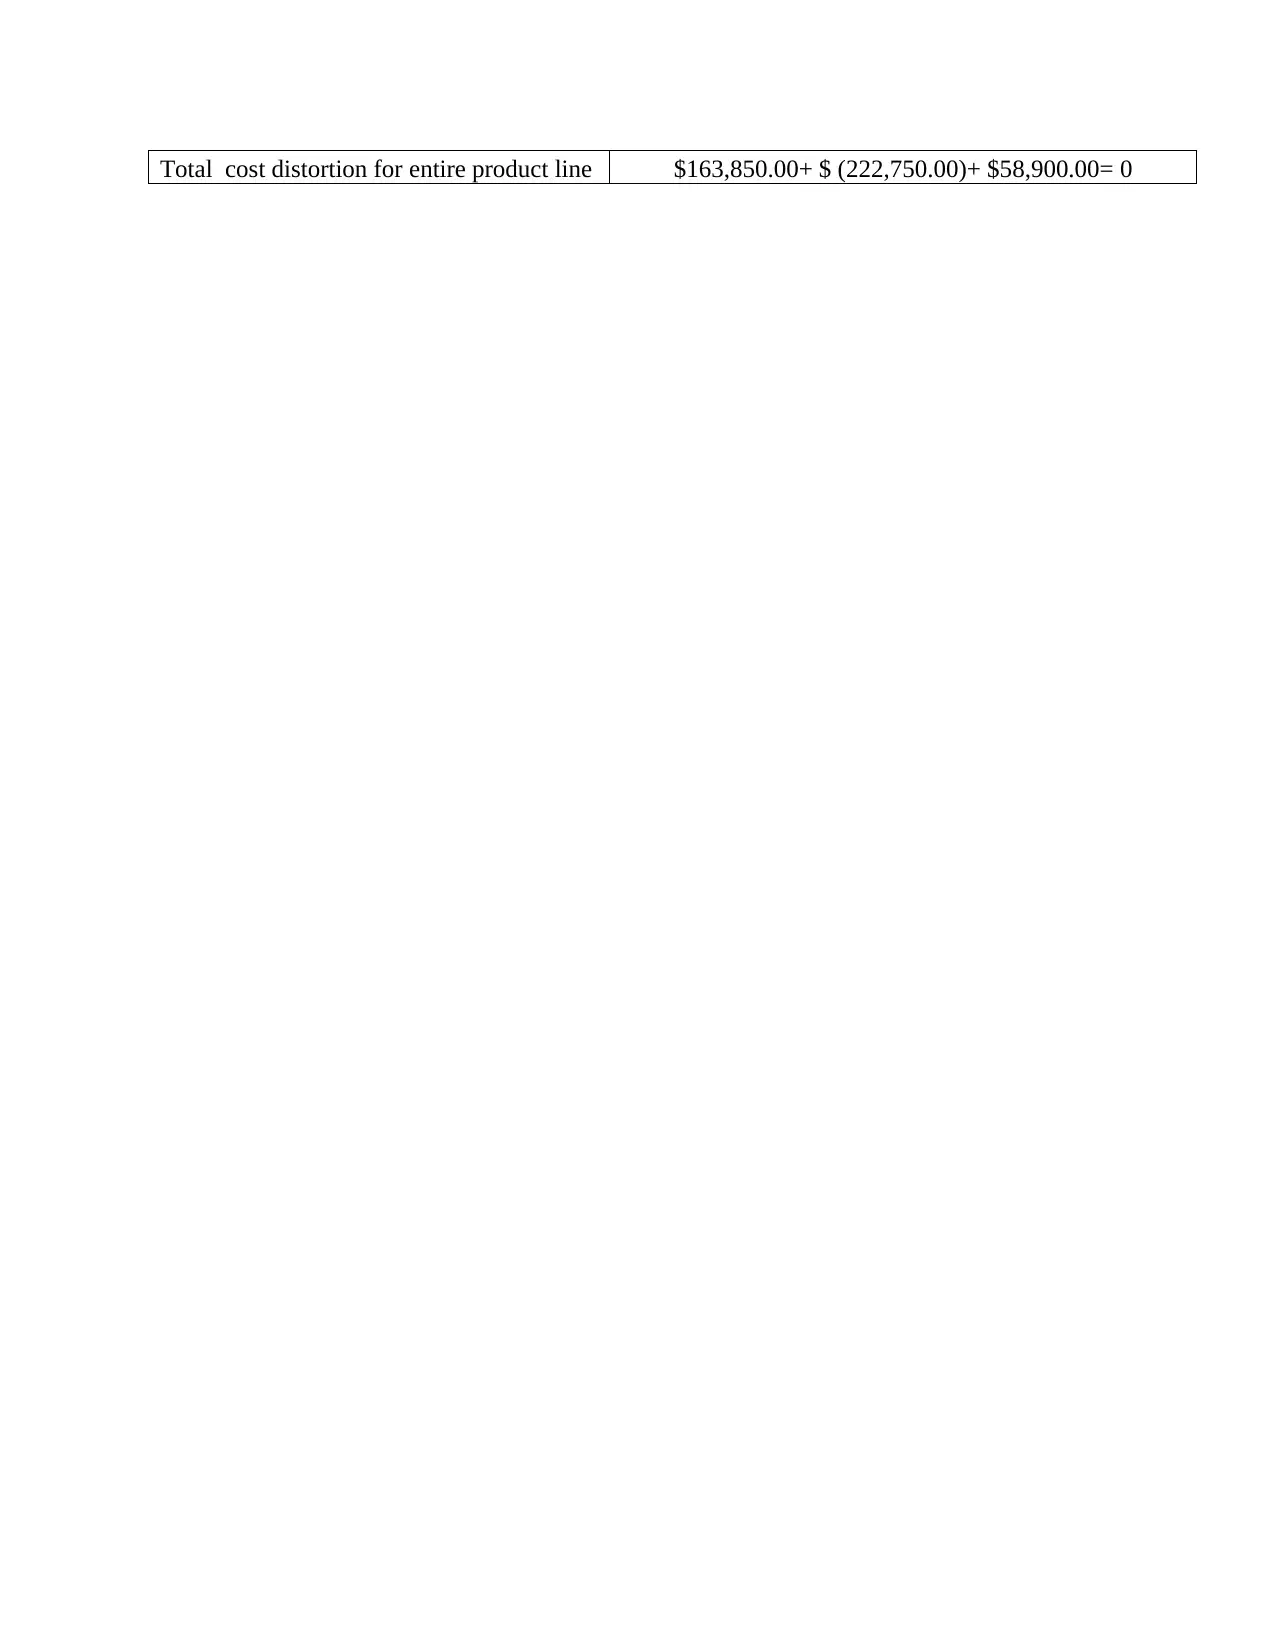
Total cost distortion for entire product line $163,850.00+ $ (222,750.00)+ $58,900.00= 0
1 out of 10

Your All-in-One AI-Powered Toolkit for Academic Success.
+13062052269
info@desklib.com
Available 24*7 on WhatsApp / Email
![[object Object]](/_next/static/media/star-bottom.7253800d.svg)
Unlock your academic potential
Copyright © 2020–2026 A2Z Services. All Rights Reserved. Developed and managed by ZUCOL.