Analyzing Costs & Revenue Metrics in Financial Resource Management
VerifiedAdded on 2023/06/15
|11
|2462
|205
Report
AI Summary
This report provides a detailed analysis of managing financial resources, focusing on cost components and revenue metrics. It differentiates between fixed and variable costs, illustrating their impact on an organization's financial performance. The report includes calculations for average daily rate (ADR), revenue per available room (RevPAR), average length of stay, and average rate index. Furthermore, it examines key performance indicators such as food and beverage cost of sales ratios, revenue per seat hour, labor costs, and customer retention rates. The analysis demonstrates how these metrics are crucial for effective financial management and decision-making within hospitality and other sectors, highlighting the importance of understanding cost structures and revenue generation strategies to achieve financial goals. Desklib provides access to this and many other solved assignments.
MANAGING FINANCIAL
RESOURCES
RESOURCES
Paraphrase This Document
Need a fresh take? Get an instant paraphrase of this document with our AI Paraphraser
Table of Contents
INTRODUCTION...........................................................................................................................1
INTRODUCTION...........................................................................................................................3
Section A.........................................................................................................................................3
Question 2....................................................................................................................................3
Section B.........................................................................................................................................5
Question 5....................................................................................................................................5
Question 6....................................................................................................................................8
CONCLUSION.............................................................................................................................10
REFERENCES..............................................................................................................................11
INTRODUCTION
In this project description about the fixed and variable component will be given.
Furthermore, the project will discuss the various types of cost incurred by the organisation.
Section A
Question 2
(a)
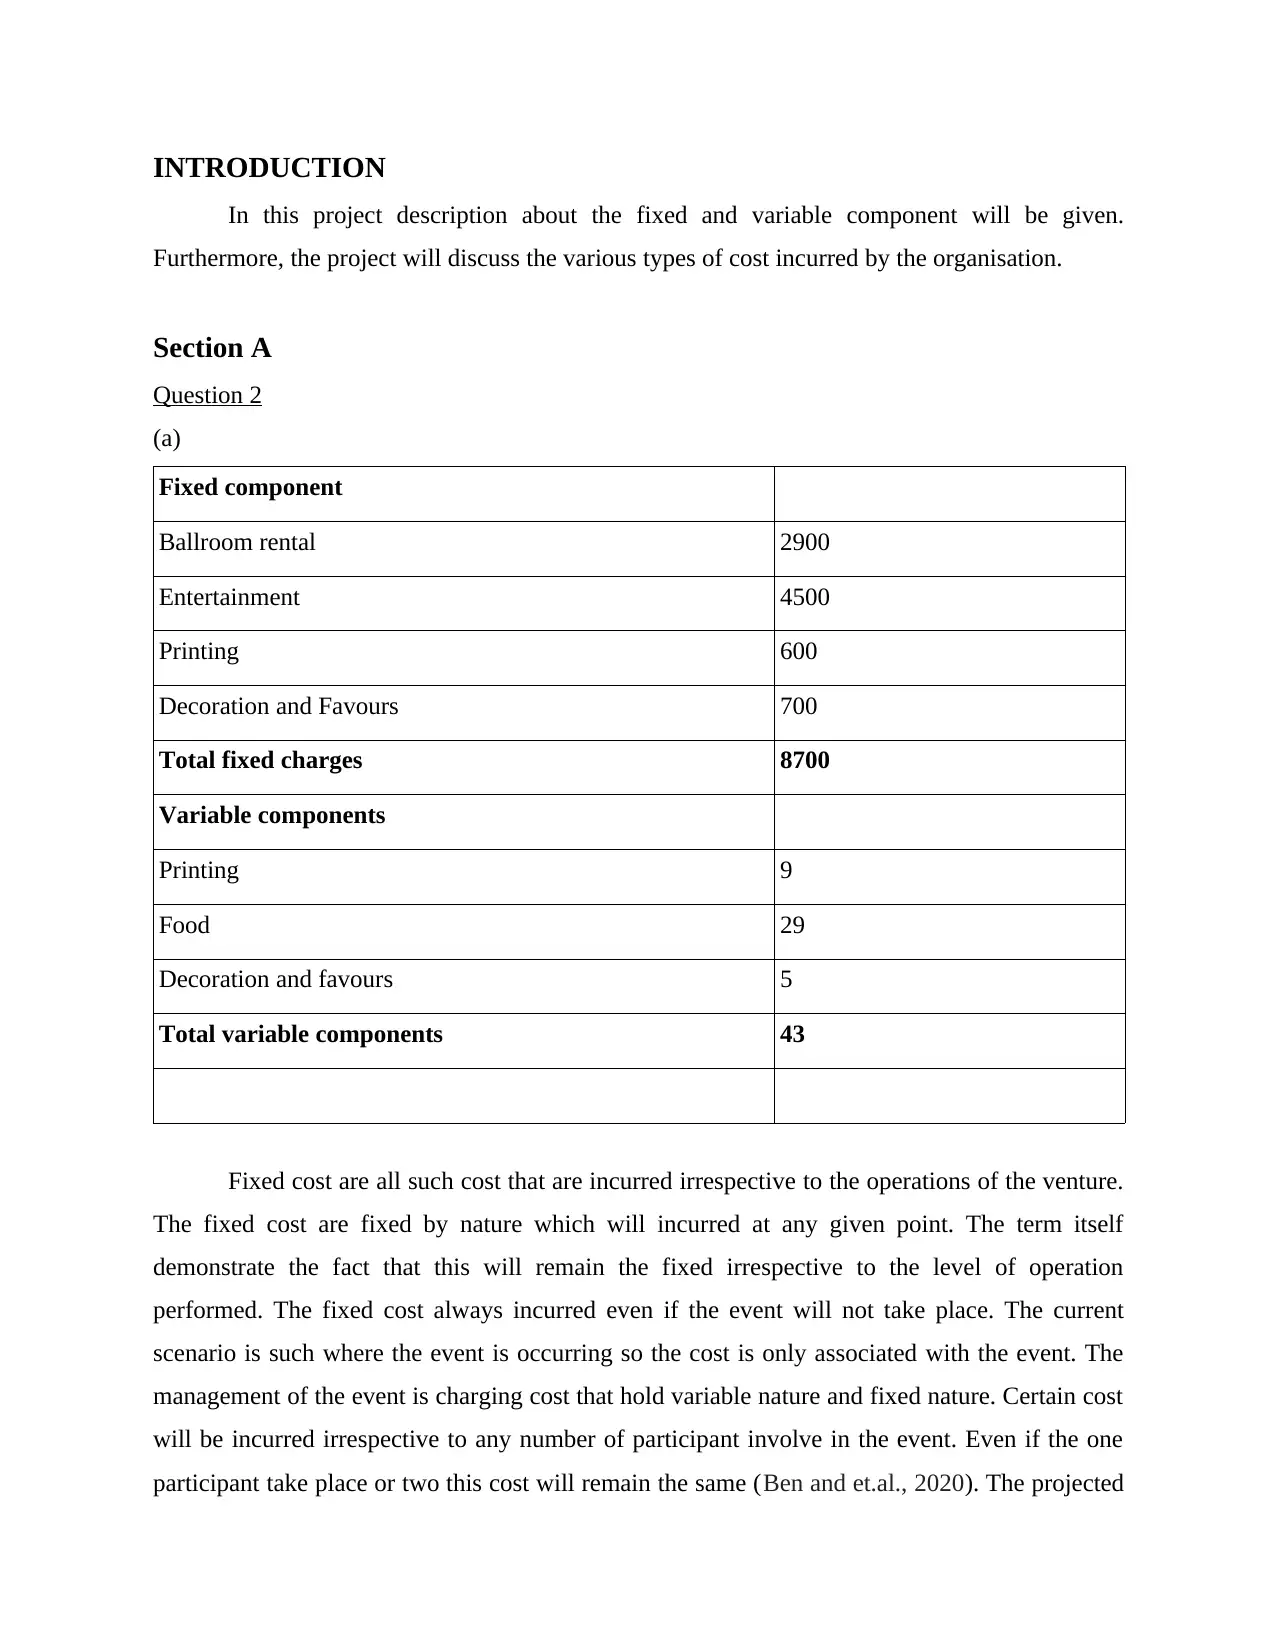
Fixed component
Ballroom rental 2900
Entertainment 4500
Printing 600
Decoration and Favours 700
Total fixed charges 8700
Variable components
Printing 9
Food 29
Decoration and favours 5
Total variable components 43
Fixed cost are all such cost that are incurred irrespective to the operations of the venture.
The fixed cost are fixed by nature which will incurred at any given point. The term itself
demonstrate the fact that this will remain the fixed irrespective to the level of operation
performed. The fixed cost always incurred even if the event will not take place. The current
scenario is such where the event is occurring so the cost is only associated with the event. The
management of the event is charging cost that hold variable nature and fixed nature. Certain cost
will be incurred irrespective to any number of participant involve in the event. Even if the one
participant take place or two this cost will remain the same (Ben and et.al., 2020). The projected
In this project description about the fixed and variable component will be given.
Furthermore, the project will discuss the various types of cost incurred by the organisation.
Section A
Question 2
(a)
Fixed component
Ballroom rental 2900
Entertainment 4500
Printing 600
Decoration and Favours 700
Total fixed charges 8700
Variable components
Printing 9
Food 29
Decoration and favours 5
Total variable components 43
Fixed cost are all such cost that are incurred irrespective to the operations of the venture.
The fixed cost are fixed by nature which will incurred at any given point. The term itself
demonstrate the fact that this will remain the fixed irrespective to the level of operation
performed. The fixed cost always incurred even if the event will not take place. The current
scenario is such where the event is occurring so the cost is only associated with the event. The
management of the event is charging cost that hold variable nature and fixed nature. Certain cost
will be incurred irrespective to any number of participant involve in the event. Even if the one
participant take place or two this cost will remain the same (Ben and et.al., 2020). The projected
⊘ This is a preview!⊘
Do you want full access?
Subscribe today to unlock all pages.
Trusted by 1+ million students worldwide
scenario reflect that ballroom rental hold the fixed cost involve ballroom rental, entertainment,
pricing and decoration and favour related cost. All thee cost hold fixed in nature. The nature of
fixed component is such that it will incur even if any participant do not take place. On the other
hand variable cost is the one that will only take place if some activity is taken. This cost will
only incurred if the people would take participate in the event. In case the person is not being
able to participate in the event than this cost will not take any place in the event. The role of
variable cost is such that if the participants are involved in the event than this cost will take
place. The above scenario include variable cost involve printing, food, decoration and favour
related cost. This cost is variable in nature. This cost will only incurred if the participant involve
in the event activity.
The above projected scenario reflect that the total fixed cost that will be incurred
amounted as 8700 whereas the variable cost on the other hand will incurred at the rate of 43 per
person. The nature of the variable cost involve this will be based on the total numb er of
participant included in the event. If the total number of participants increases this would further
increase this cost. Fixed cost amounted of 8700 will incurred even if the participants do not get
involve in the event. In case the event take place with one participant than still this cost will take
place abnd management have to bear the same (Eriksson and et.al., 2019). The basic different
between fixed cost and variable cost is such that the fixed cost will incurred in the same manner
even if any number of participant take part in thee event this cost will remain the same for the
management. There will be no change address in the scale of this cost even if one participant
involve and even the 100 participant take place this cost will remain the same for the
management. On the other hand variable cost contain the nature or the fact that this cost will be
based on the total number of participant involve in the event.
There are certain cost which is semi variable in nature. This is a cost that is partially
variable by nature and partially fixed by nature., This cost is also included and incurred by the
organisation. These cost included printing cost, decorations and favour related cost. These cost
are semi variable cost that will hold the nature of both the type of costs such as variable cost and
fixed cost.
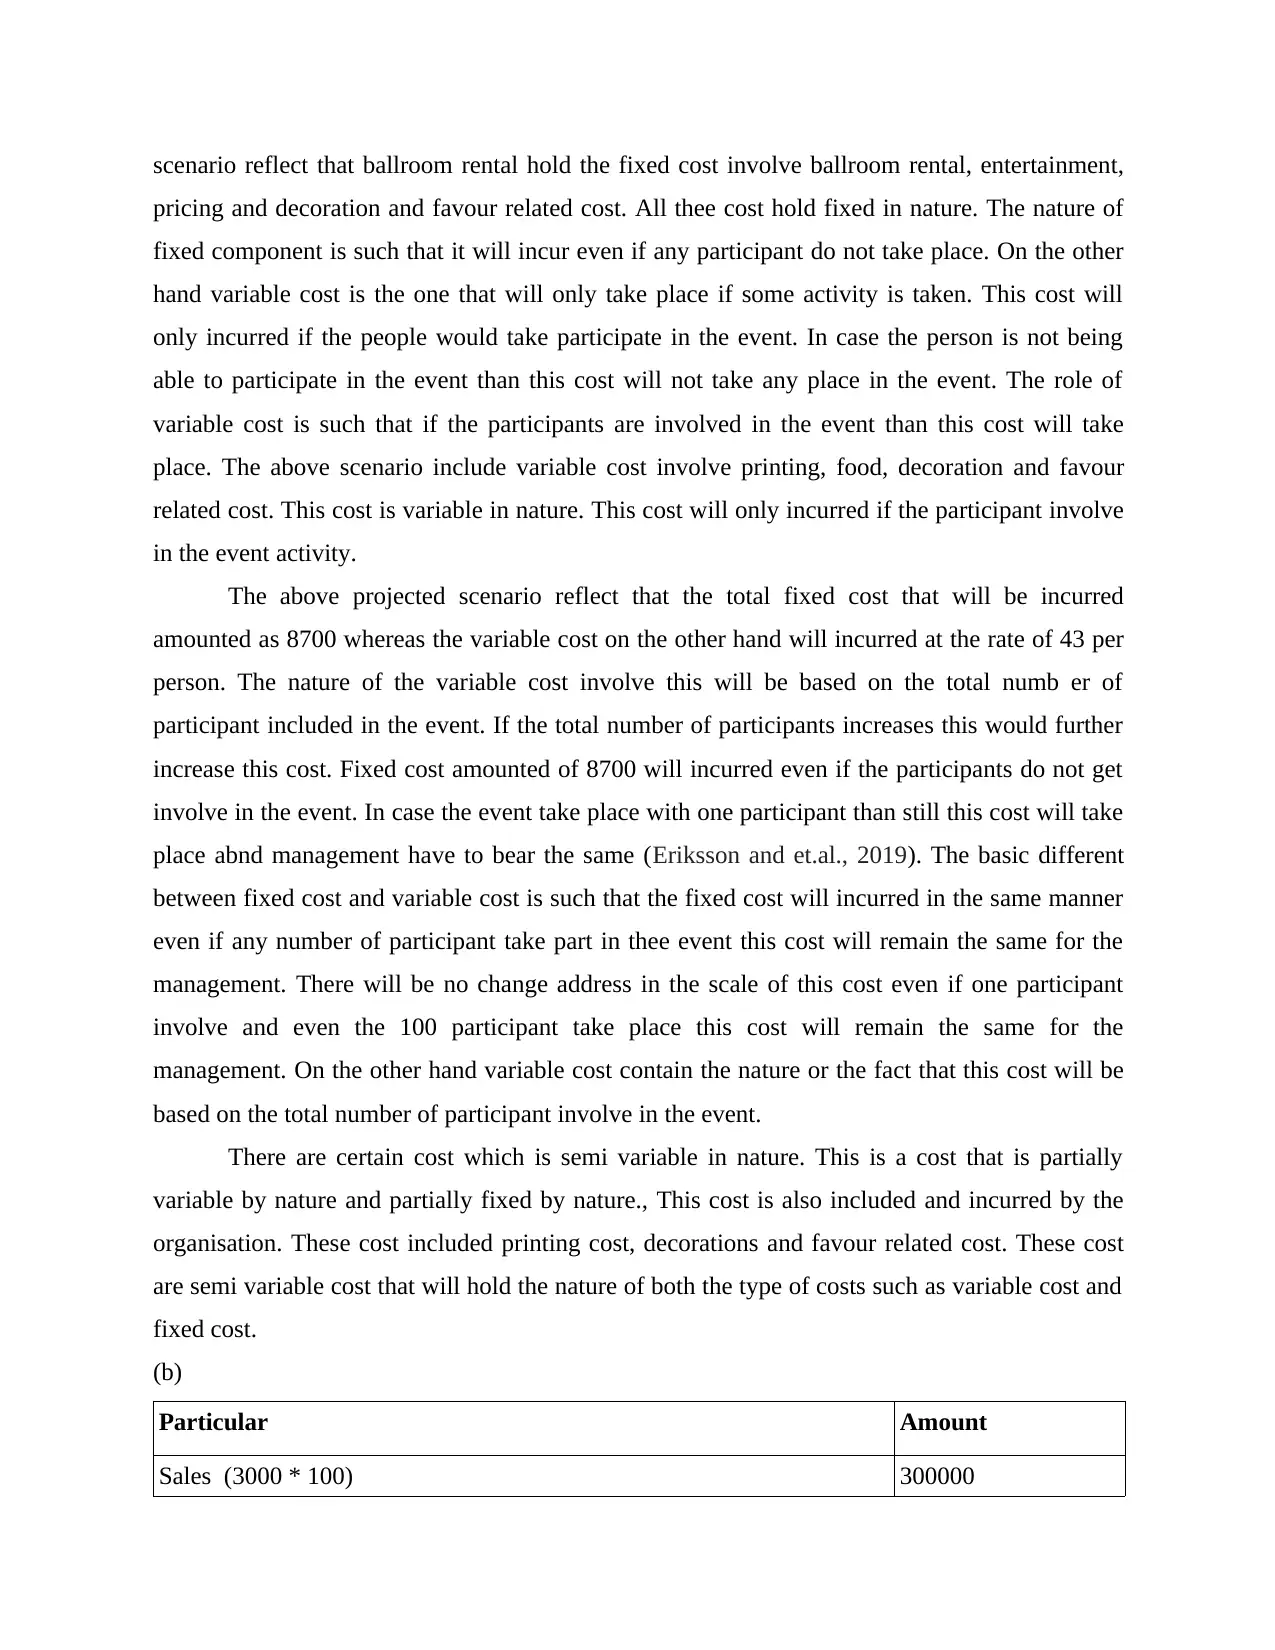
(b)
Particular Amount
Sales (3000 * 100) 300000
pricing and decoration and favour related cost. All thee cost hold fixed in nature. The nature of
fixed component is such that it will incur even if any participant do not take place. On the other
hand variable cost is the one that will only take place if some activity is taken. This cost will
only incurred if the people would take participate in the event. In case the person is not being
able to participate in the event than this cost will not take any place in the event. The role of
variable cost is such that if the participants are involved in the event than this cost will take
place. The above scenario include variable cost involve printing, food, decoration and favour
related cost. This cost is variable in nature. This cost will only incurred if the participant involve
in the event activity.
The above projected scenario reflect that the total fixed cost that will be incurred
amounted as 8700 whereas the variable cost on the other hand will incurred at the rate of 43 per
person. The nature of the variable cost involve this will be based on the total numb er of
participant included in the event. If the total number of participants increases this would further
increase this cost. Fixed cost amounted of 8700 will incurred even if the participants do not get
involve in the event. In case the event take place with one participant than still this cost will take
place abnd management have to bear the same (Eriksson and et.al., 2019). The basic different
between fixed cost and variable cost is such that the fixed cost will incurred in the same manner
even if any number of participant take part in thee event this cost will remain the same for the
management. There will be no change address in the scale of this cost even if one participant
involve and even the 100 participant take place this cost will remain the same for the
management. On the other hand variable cost contain the nature or the fact that this cost will be
based on the total number of participant involve in the event.
There are certain cost which is semi variable in nature. This is a cost that is partially
variable by nature and partially fixed by nature., This cost is also included and incurred by the
organisation. These cost included printing cost, decorations and favour related cost. These cost
are semi variable cost that will hold the nature of both the type of costs such as variable cost and
fixed cost.
(b)
Particular Amount
Sales (3000 * 100) 300000
Paraphrase This Document
Need a fresh take? Get an instant paraphrase of this document with our AI Paraphraser
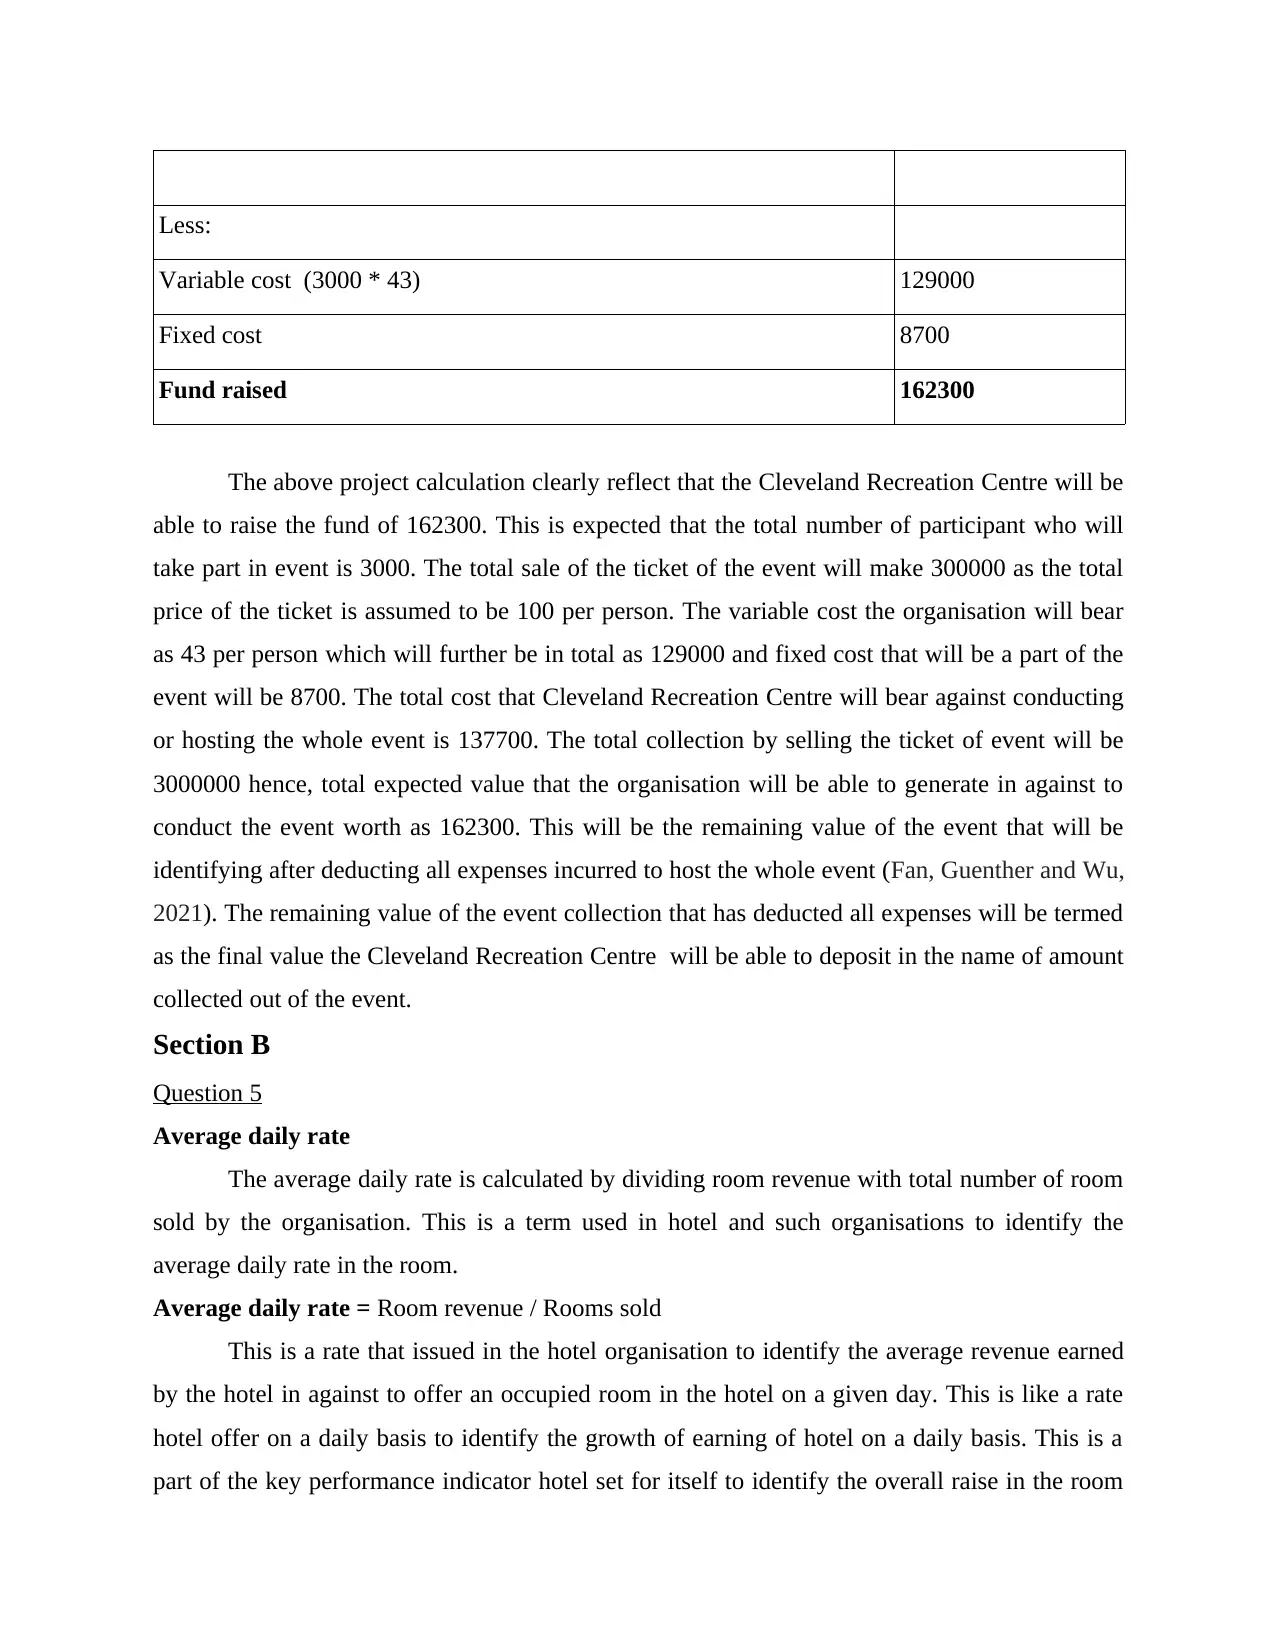
Less:
Variable cost (3000 * 43) 129000
Fixed cost 8700
Fund raised 162300
The above project calculation clearly reflect that the Cleveland Recreation Centre will be
able to raise the fund of 162300. This is expected that the total number of participant who will
take part in event is 3000. The total sale of the ticket of the event will make 300000 as the total
price of the ticket is assumed to be 100 per person. The variable cost the organisation will bear
as 43 per person which will further be in total as 129000 and fixed cost that will be a part of the
event will be 8700. The total cost that Cleveland Recreation Centre will bear against conducting
or hosting the whole event is 137700. The total collection by selling the ticket of event will be
3000000 hence, total expected value that the organisation will be able to generate in against to
conduct the event worth as 162300. This will be the remaining value of the event that will be
identifying after deducting all expenses incurred to host the whole event (Fan, Guenther and Wu,
2021). The remaining value of the event collection that has deducted all expenses will be termed
as the final value the Cleveland Recreation Centre will be able to deposit in the name of amount
collected out of the event.
Section B
Question 5
Average daily rate
The average daily rate is calculated by dividing room revenue with total number of room
sold by the organisation. This is a term used in hotel and such organisations to identify the
average daily rate in the room.
Average daily rate = Room revenue / Rooms sold
This is a rate that issued in the hotel organisation to identify the average revenue earned
by the hotel in against to offer an occupied room in the hotel on a given day. This is like a rate
hotel offer on a daily basis to identify the growth of earning of hotel on a daily basis. This is a
part of the key performance indicator hotel set for itself to identify the overall raise in the room
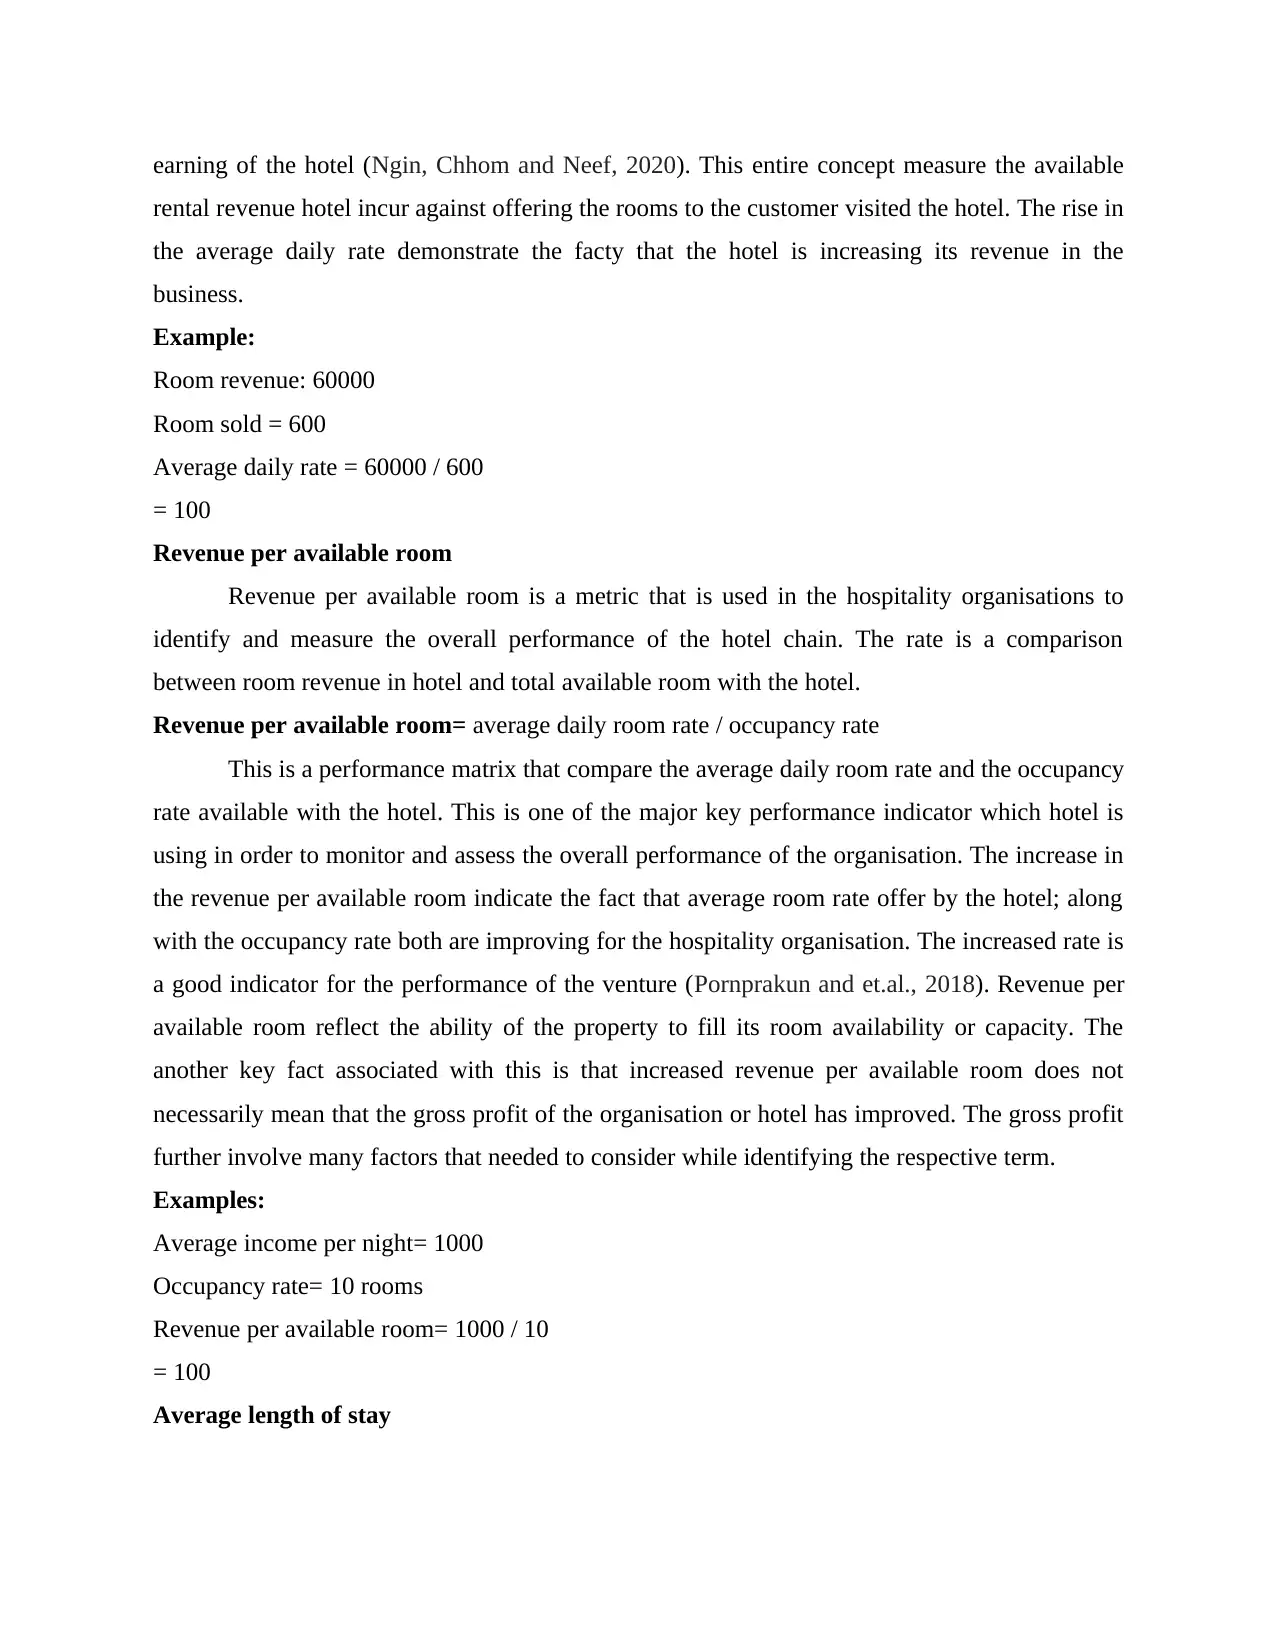
earning of the hotel (Ngin, Chhom and Neef, 2020). This entire concept measure the available
rental revenue hotel incur against offering the rooms to the customer visited the hotel. The rise in
the average daily rate demonstrate the facty that the hotel is increasing its revenue in the
business.
Example:
Room revenue: 60000
Room sold = 600
Average daily rate = 60000 / 600
= 100
Revenue per available room
Revenue per available room is a metric that is used in the hospitality organisations to
identify and measure the overall performance of the hotel chain. The rate is a comparison
between room revenue in hotel and total available room with the hotel.
Revenue per available room= average daily room rate / occupancy rate
This is a performance matrix that compare the average daily room rate and the occupancy
rate available with the hotel. This is one of the major key performance indicator which hotel is
using in order to monitor and assess the overall performance of the organisation. The increase in
the revenue per available room indicate the fact that average room rate offer by the hotel; along
with the occupancy rate both are improving for the hospitality organisation. The increased rate is
a good indicator for the performance of the venture (Pornprakun and et.al., 2018). Revenue per
available room reflect the ability of the property to fill its room availability or capacity. The
another key fact associated with this is that increased revenue per available room does not
necessarily mean that the gross profit of the organisation or hotel has improved. The gross profit
further involve many factors that needed to consider while identifying the respective term.
Examples:
Average income per night= 1000
Occupancy rate= 10 rooms
Revenue per available room= 1000 / 10
= 100
Average length of stay
⊘ This is a preview!⊘
Do you want full access?
Subscribe today to unlock all pages.
Trusted by 1+ million students worldwide

Average length of stay is defined as on an average basis how long the visitor stay in the
hotel. This is like disclosing a fact that on average basis how long or duration the travellers or
the visitors in the hotel stay. The more the average length of stay is will further improve the
revenue of the hotel.
Average length of stay: total length of stay of each customer/ number of discharge customer in
month
This rate disclose the fact that the total length or duration a customer or travellers stay in
hotel room. Length of stay is always a key aspect hospitality organisation consider while
remaining policies on how to improve the revenue of the hotel (Tresidder and Martin, 2018).
This concept solely contribute for the hotel in improving the overall revenue of the hospitality
chain. This considers as one of the wide key performance indicator for the organisation.
Example:
Total length of stay of each customer=
Victor = 3 days
Jhonson = 4 days
Maria = 5 days
John = 3 days
Mani = 7 days
Moria = 3 days
Total discharge = 6
Average length of stay = 3 + 4 + 5 + 3 + 7 + 3 / 6
= 4.16 days
This disclose the fact that on an average 4.16 days each customer visited the hotel stay in
the hotel.
Average rate index
Average rate index is a comparison between the average daily rate of the organisation by
comparing it with the industry average of average daily rate.
Formula= ADR / Industry average ADR
Paraphrase This Document
Need a fresh take? Get an instant paraphrase of this document with our AI Paraphraser
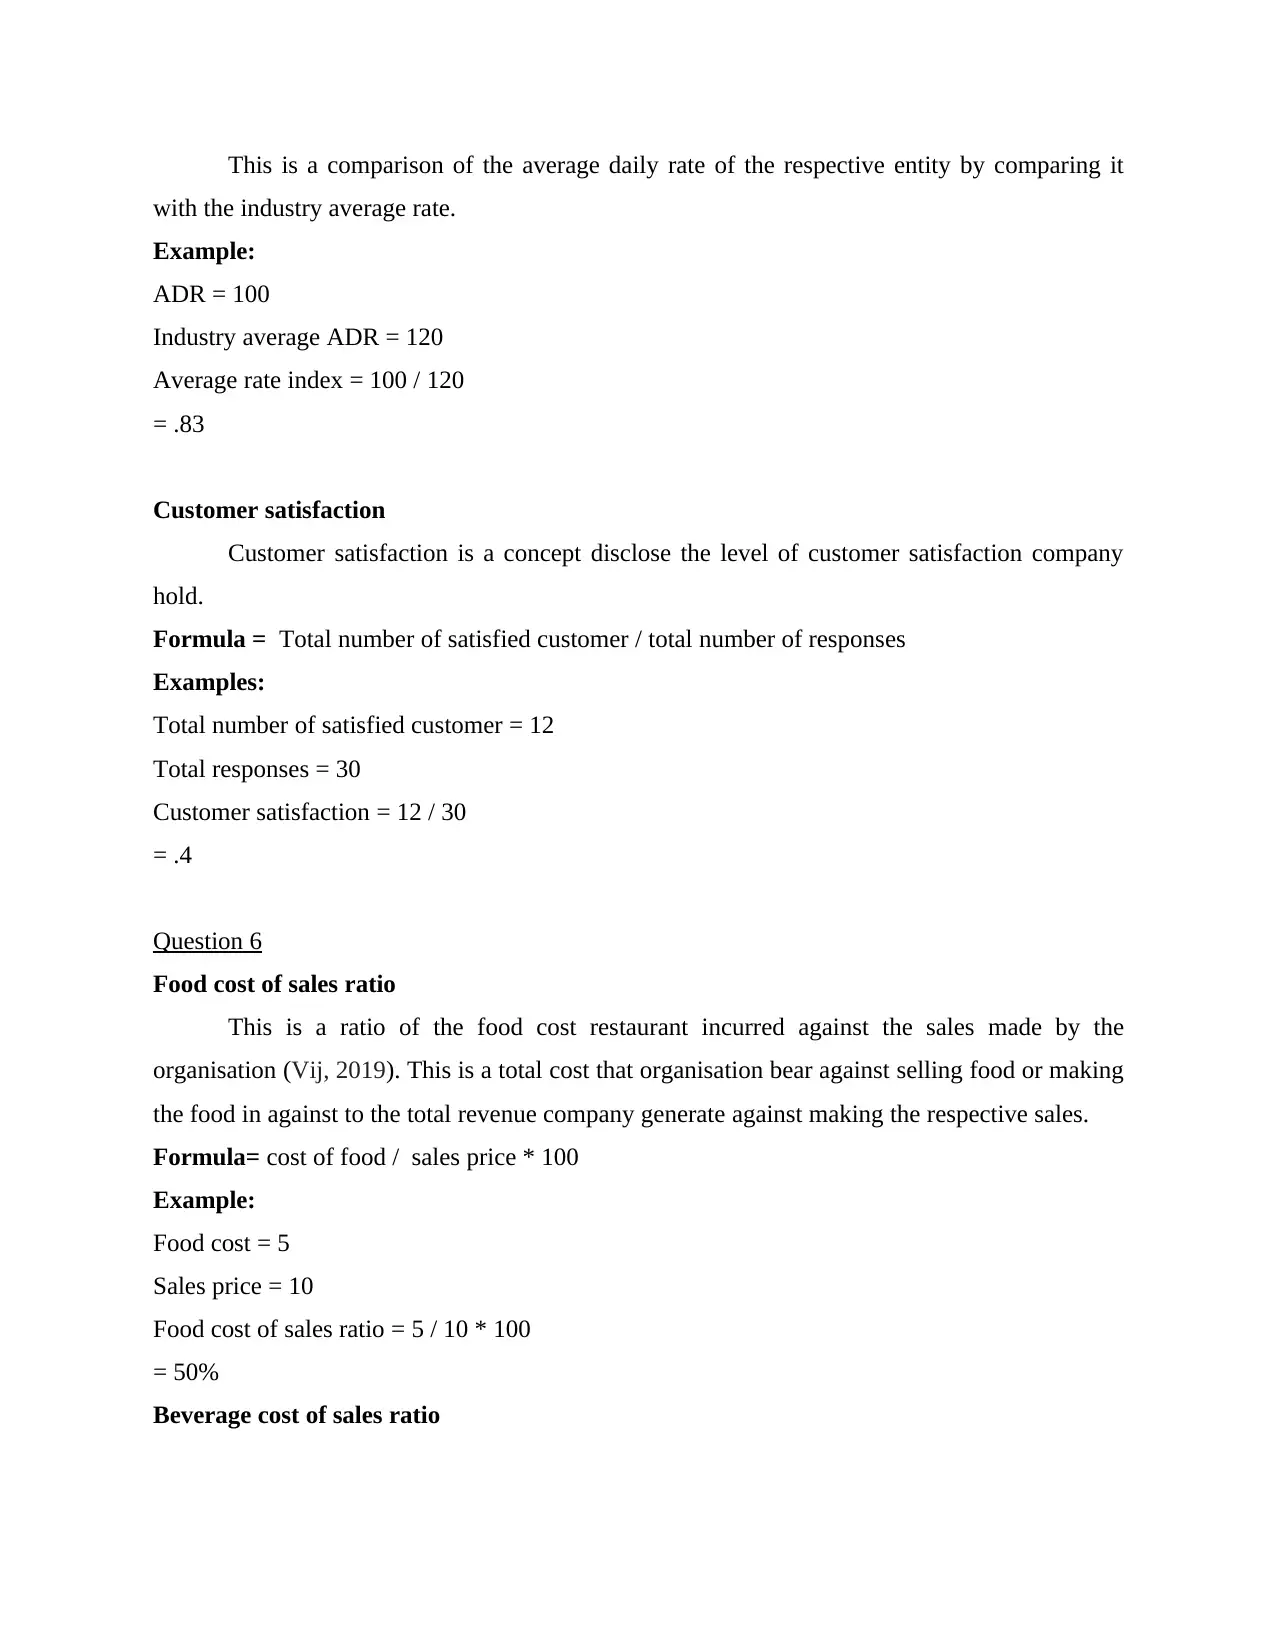
This is a comparison of the average daily rate of the respective entity by comparing it
with the industry average rate.
Example:
ADR = 100
Industry average ADR = 120
Average rate index = 100 / 120
= .83
Customer satisfaction
Customer satisfaction is a concept disclose the level of customer satisfaction company
hold.
Formula = Total number of satisfied customer / total number of responses
Examples:
Total number of satisfied customer = 12
Total responses = 30
Customer satisfaction = 12 / 30
= .4
Question 6
Food cost of sales ratio
This is a ratio of the food cost restaurant incurred against the sales made by the
organisation (Vij, 2019). This is a total cost that organisation bear against selling food or making
the food in against to the total revenue company generate against making the respective sales.
Formula= cost of food / sales price * 100
Example:
Food cost = 5
Sales price = 10
Food cost of sales ratio = 5 / 10 * 100
= 50%
Beverage cost of sales ratio
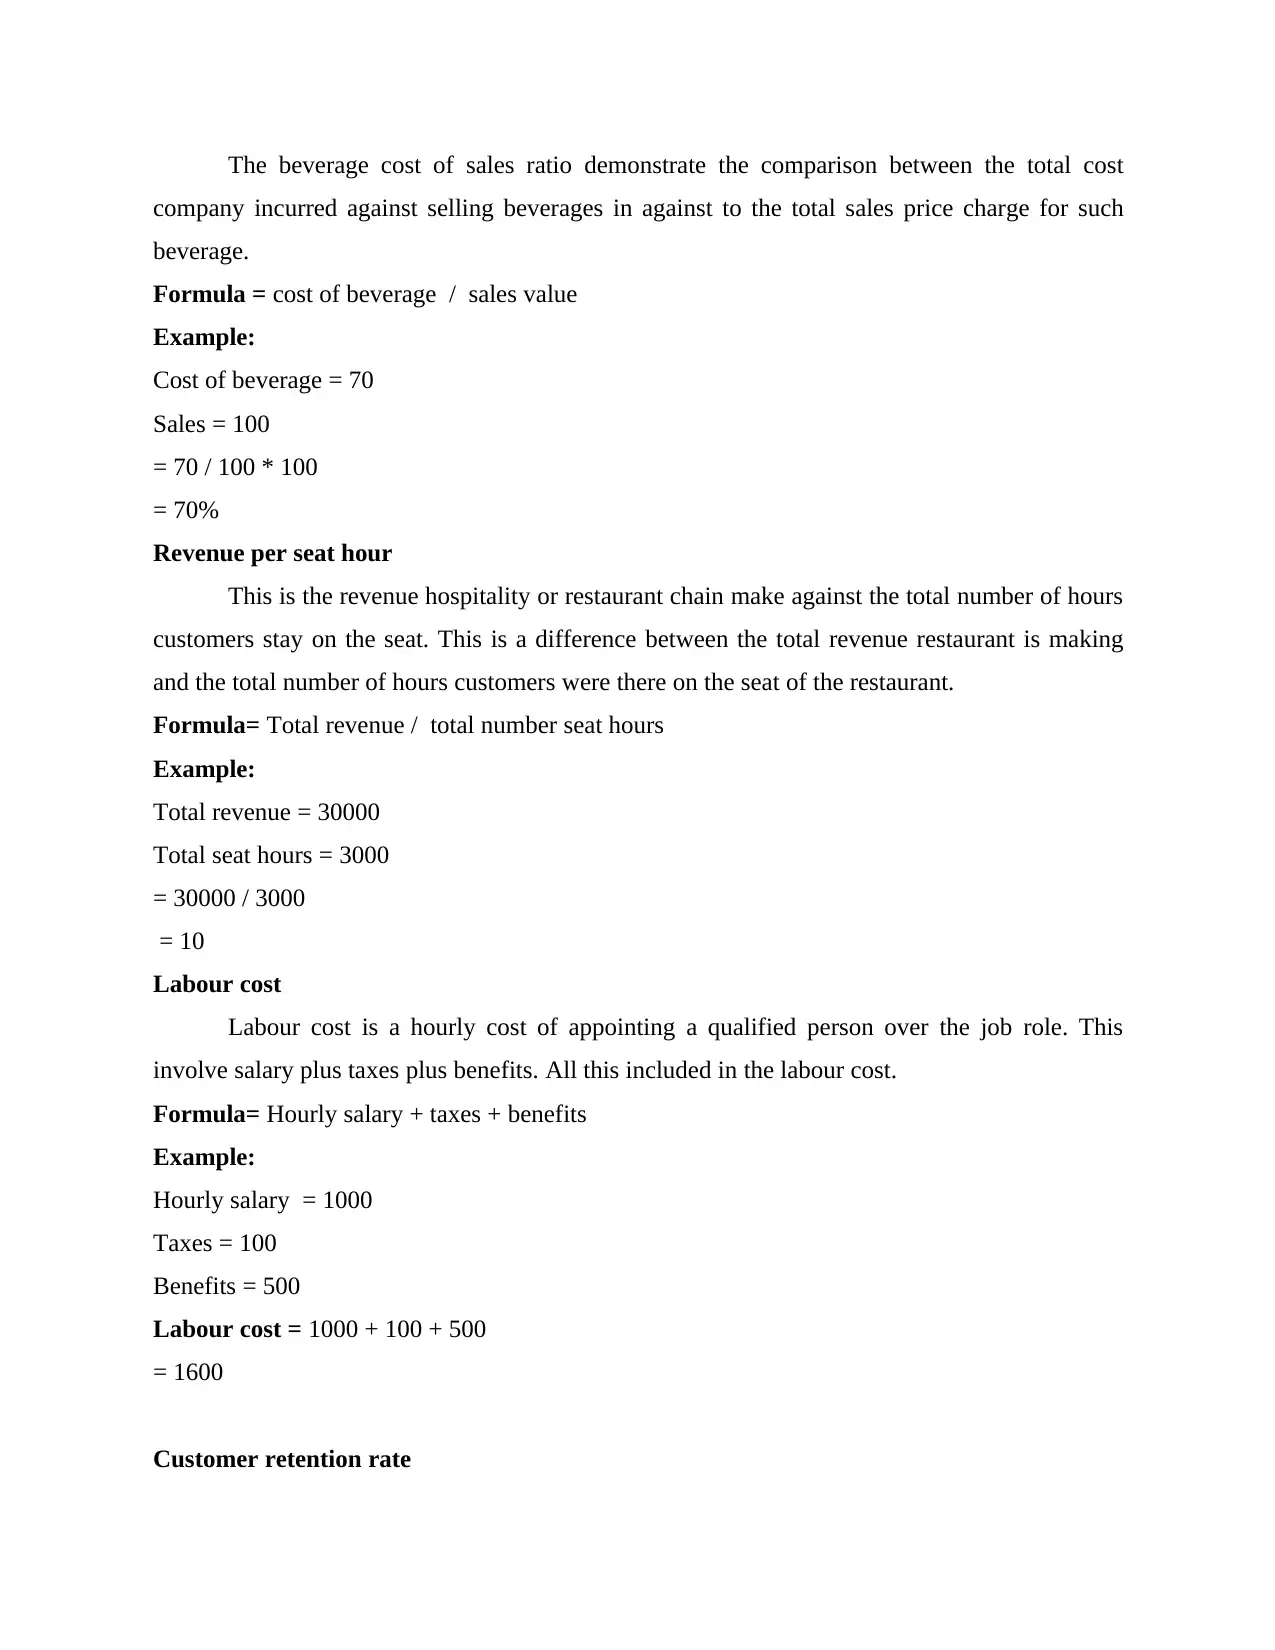
The beverage cost of sales ratio demonstrate the comparison between the total cost
company incurred against selling beverages in against to the total sales price charge for such
beverage.
Formula = cost of beverage / sales value
Example:
Cost of beverage = 70
Sales = 100
= 70 / 100 * 100
= 70%
Revenue per seat hour
This is the revenue hospitality or restaurant chain make against the total number of hours
customers stay on the seat. This is a difference between the total revenue restaurant is making
and the total number of hours customers were there on the seat of the restaurant.
Formula= Total revenue / total number seat hours
Example:
Total revenue = 30000
Total seat hours = 3000
= 30000 / 3000
= 10
Labour cost
Labour cost is a hourly cost of appointing a qualified person over the job role. This
involve salary plus taxes plus benefits. All this included in the labour cost.
Formula= Hourly salary + taxes + benefits
Example:
Hourly salary = 1000
Taxes = 100
Benefits = 500
Labour cost = 1000 + 100 + 500
= 1600
Customer retention rate
⊘ This is a preview!⊘
Do you want full access?
Subscribe today to unlock all pages.
Trusted by 1+ million students worldwide
Customer retention rate demonstrate about how the restaurant is able to retained its
customers.
Formula = CE – CN / CS * 100
Formula=
CE = 3000
CN = 1000
CS = 5000
= 3000 – 1000 / 5000 * 100
= 40%
CONCLUSION
The fixed cost remain fixed irrespective to the scale of operation whereas, variable cost
keep on changing based on the scale of operations. The cost accounting measure various cost
that involve retention rate, labour cost and many other in order to monitor the performance of the
organisation.
Paraphrase This Document
Need a fresh take? Get an instant paraphrase of this document with our AI Paraphraser
REFERENCES
Books and Journal
Ben, L. H. B. and et.al., 2020. FIXED CONVENTIONAL SPRINKLER IRRIGATION
SYSTEM: COMPONENTS OF COST AND ECONOMY OF SCALE. Revista
Engenharia na Agricultura-Reveng. 28. pp.235-244.
Eriksson, M. and et.al., 2019. What gets measured gets managed–Or does it? Connection
between food waste quantification and food waste reduction in the hospitality
sector. Resources, Conservation & Recycling: X, 4. p.100021.
Fan, Q., Guenther, D. A. and Wu, K., 2020. Fixed and Variable Tax Expense and the Cost of
Equity Capital. Available at SSRN 3575256.
Ngin, C., Chhom, C. and Neef, A., 2020. Climate change impacts and disaster resilience among
micro businesses in the tourism and hospitality sector: The case of Kratie,
Cambodia. Environmental research. 186. p.109557.
Pornprakun, W. and et.al., 2018, March. An Optimization Model of Sugarcane Harvesting with
Fixed and Variable Costs Approximated by Fourier and Cubic Functions.
In International MultiConference of Engineers and Computer Scientists (pp. 338-353).
Springer, Singapore.
Tresidder, R. and Martin, E., 2018. Deviant behaviour in the hospitality industry: A problem of
space and time. Hospitality & Society. 8(1). pp.3-22.
Vij, M., 2019. The emerging importance of risk management and enterprise risk management
strategies in the Indian hospitality industry: Senior managements’
perspective. Worldwide Hospitality and Tourism Themes.
1 out of 11
Related Documents


Your All-in-One AI-Powered Toolkit for Academic Success.
+13062052269
info@desklib.com
Available 24*7 on WhatsApp / Email
![[object Object]](/_next/static/media/star-bottom.7253800d.svg)
Unlock your academic potential
Copyright © 2020–2026 A2Z Services. All Rights Reserved. Developed and managed by ZUCOL.