University Finance Project: Cost and Control Job Costing

Verified

Added on  2020/04/01

|22
|2481
|39
Project
AI Summary
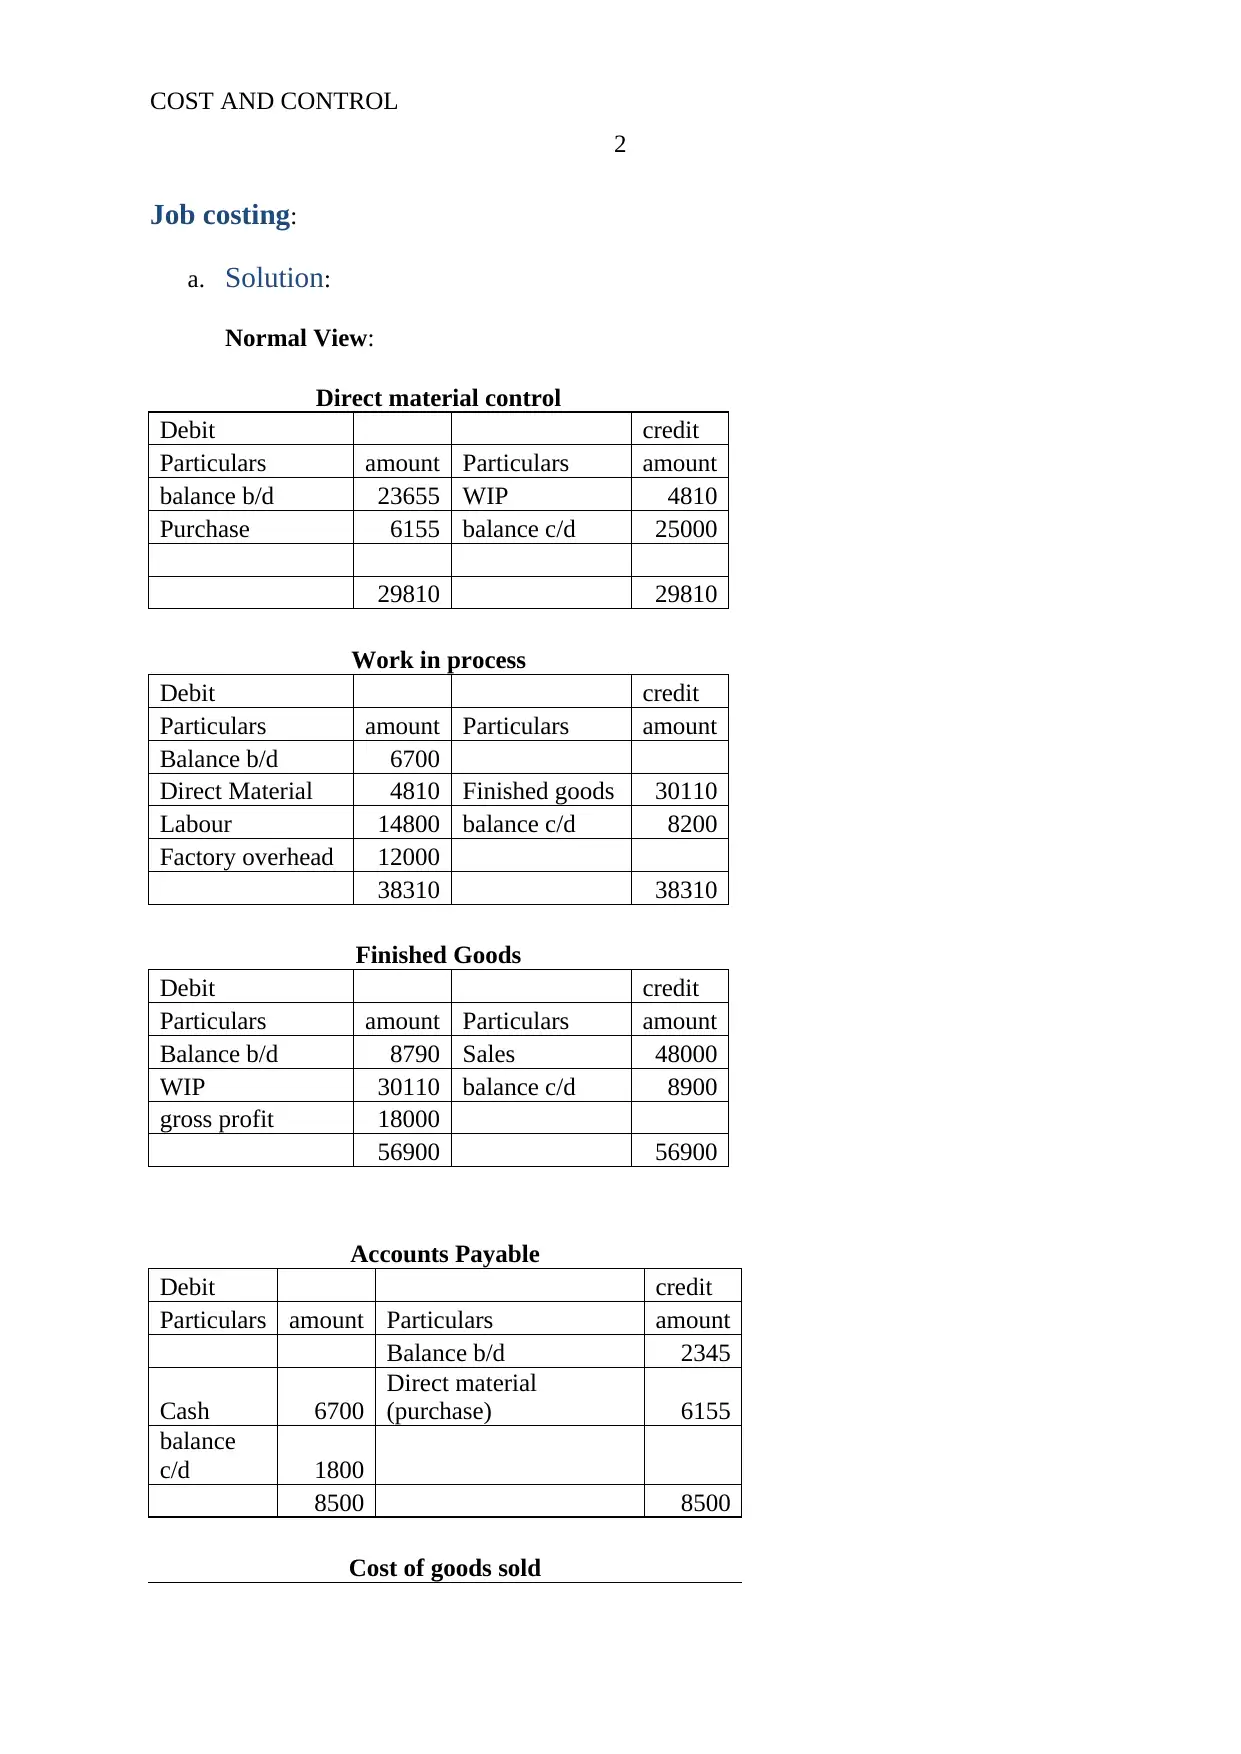
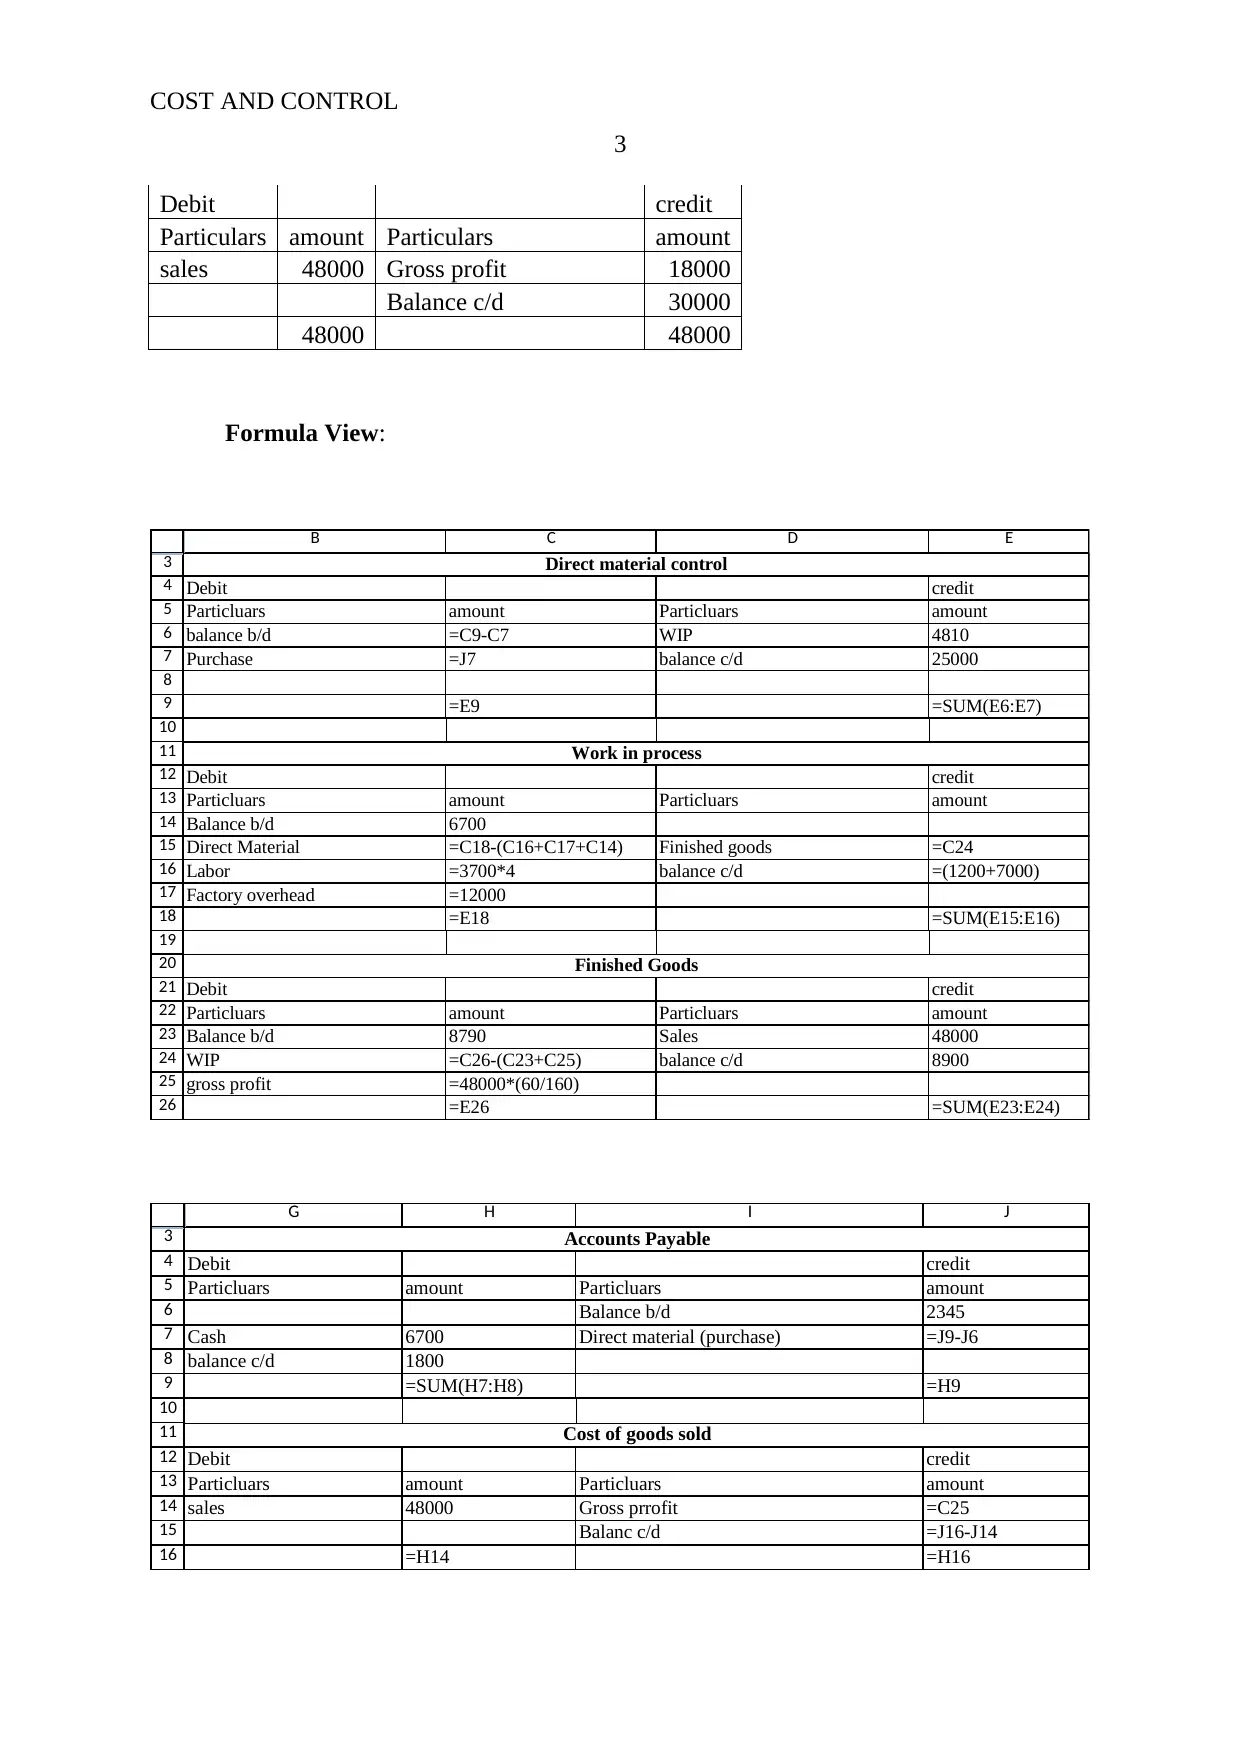
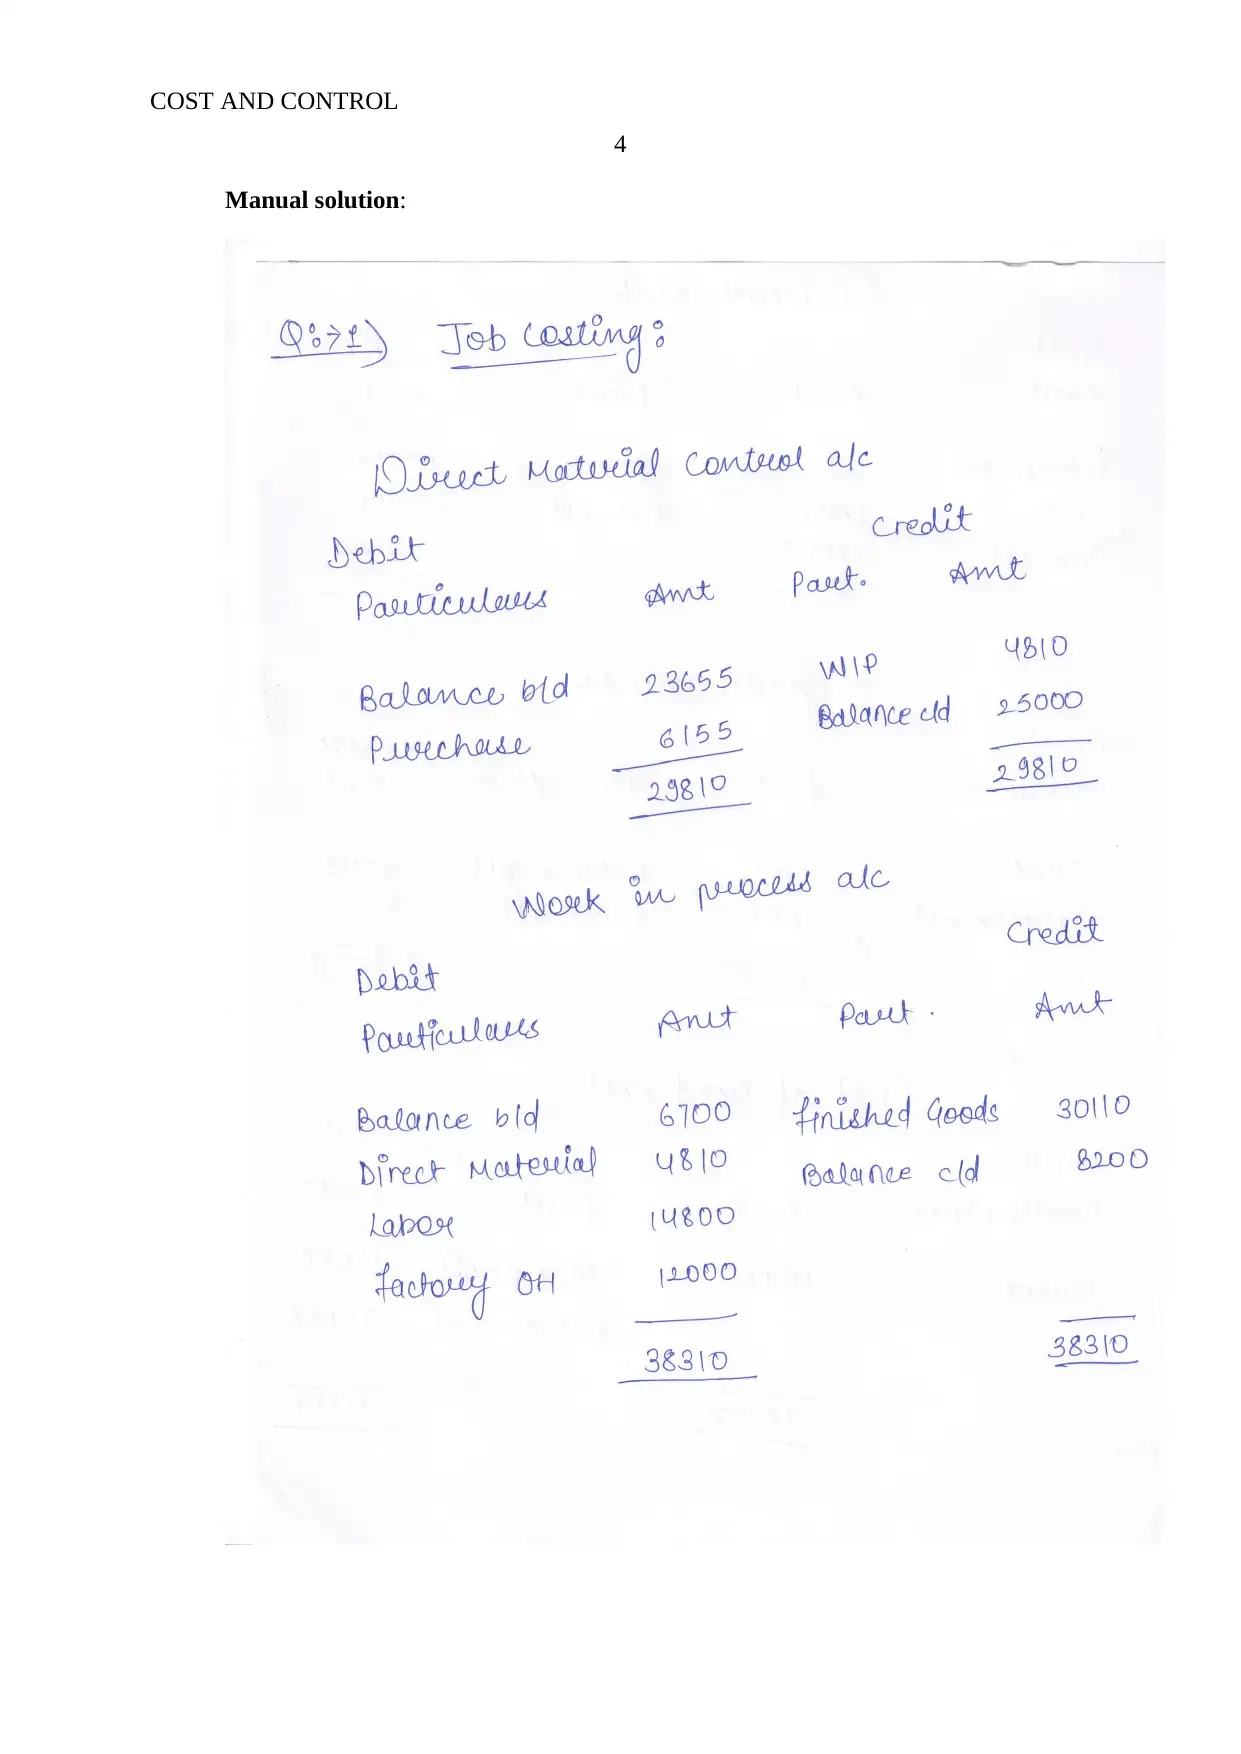
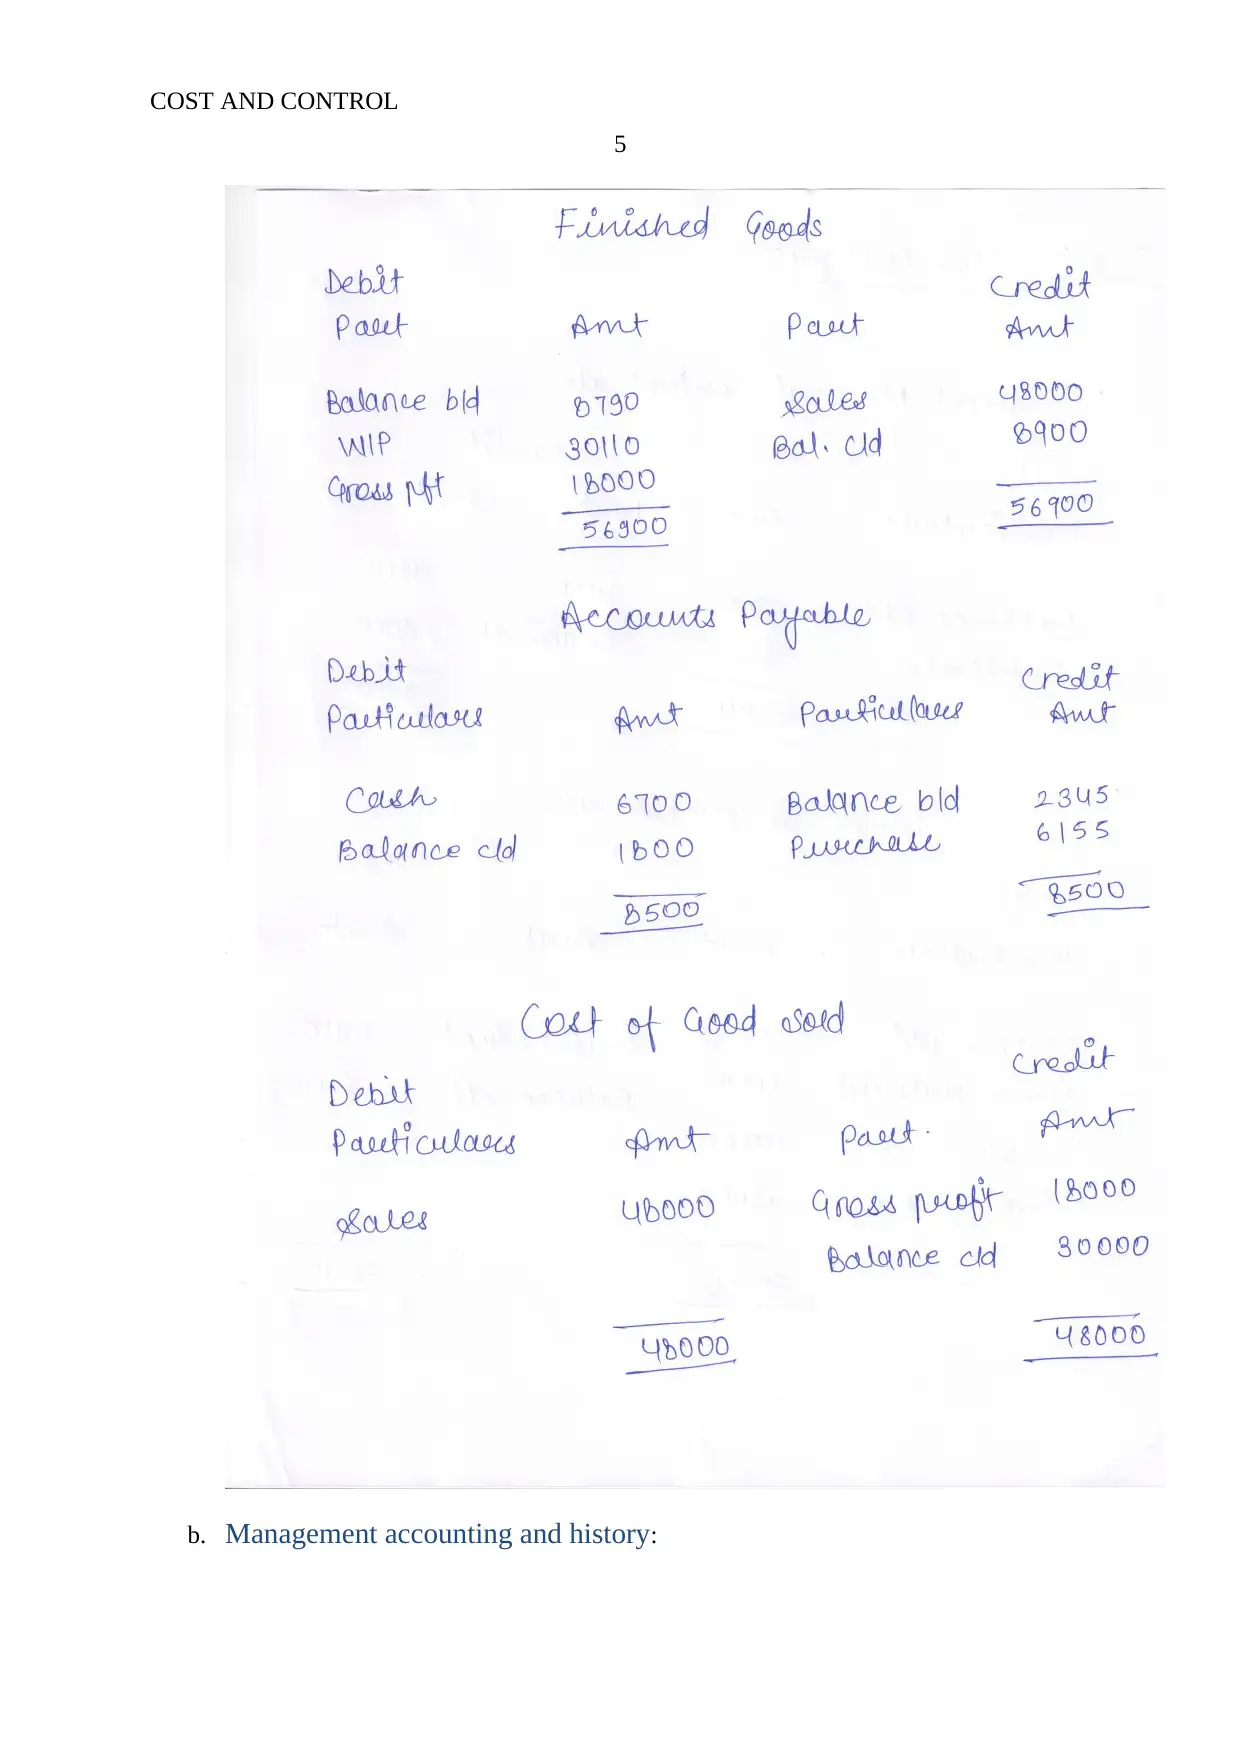
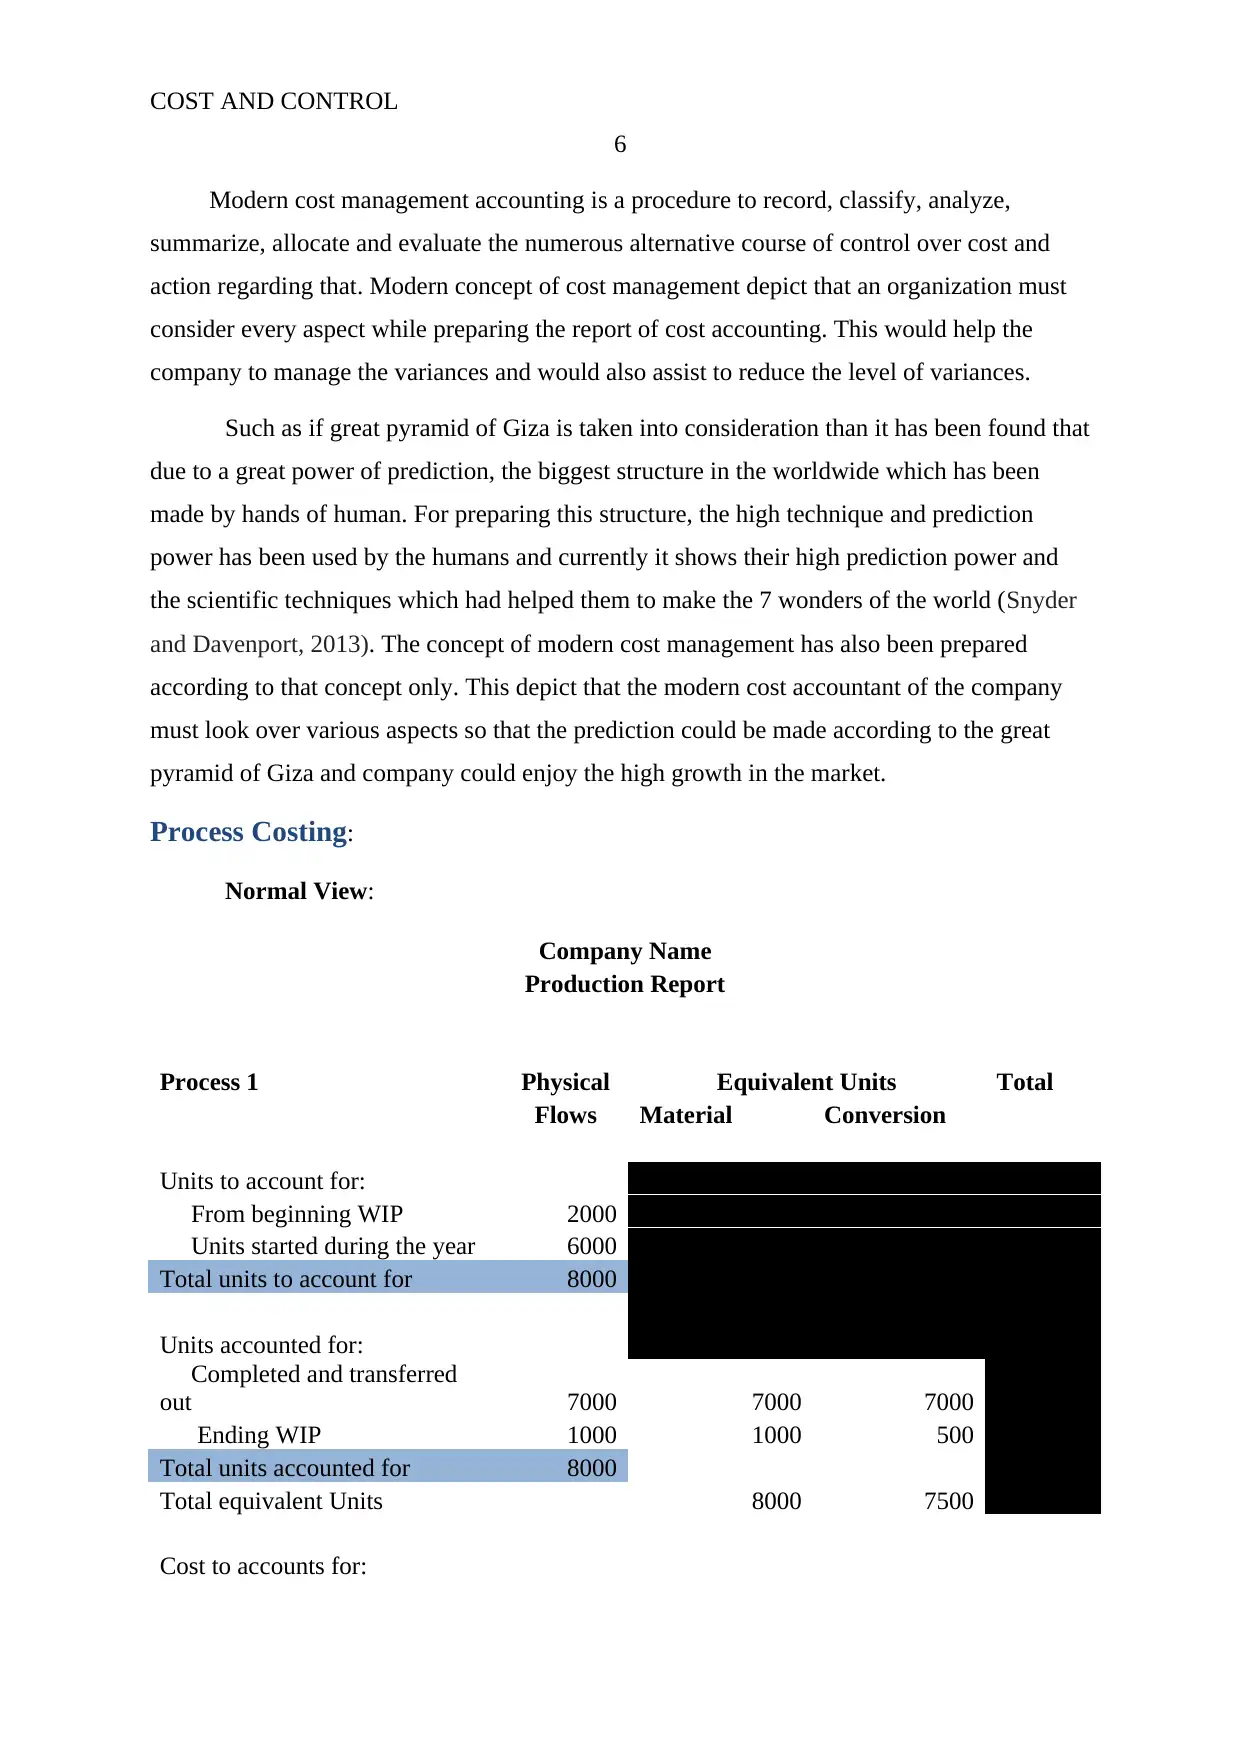
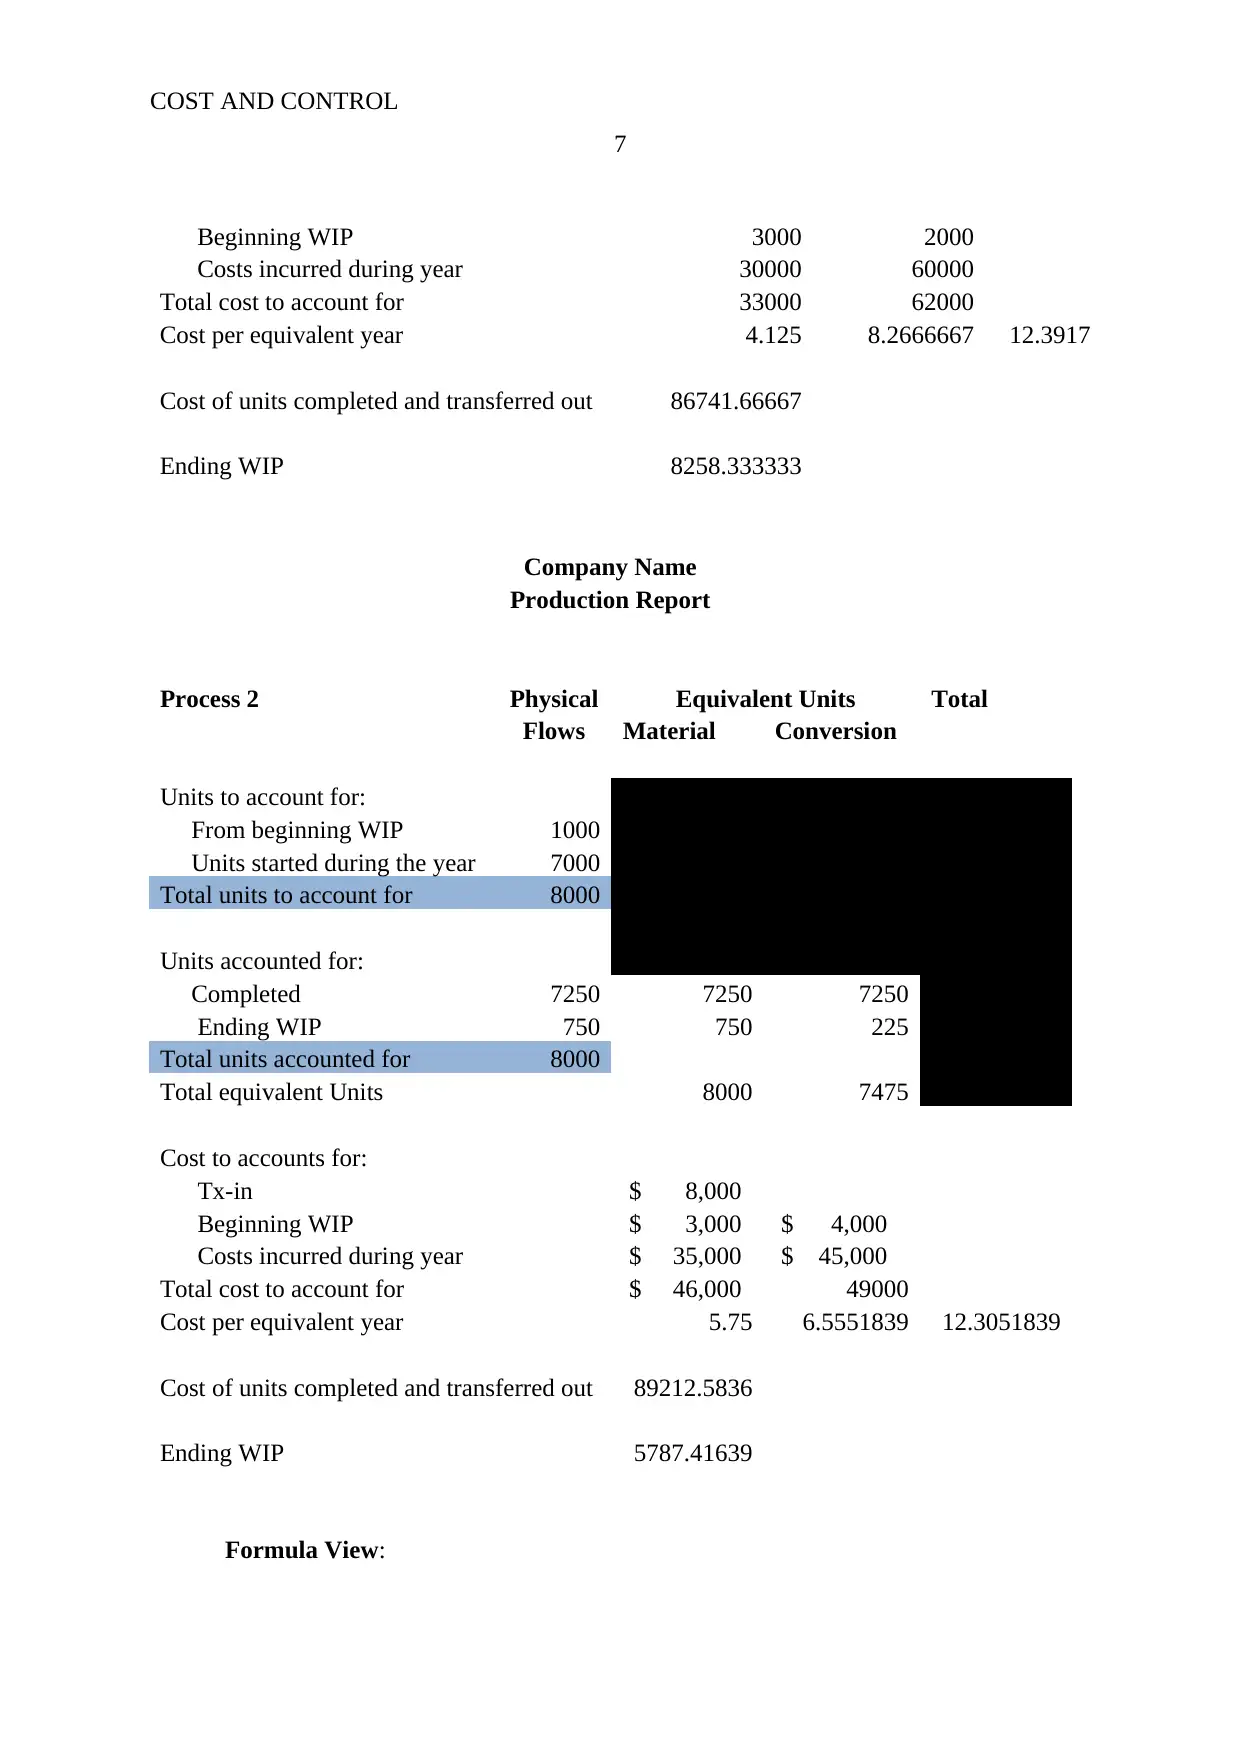
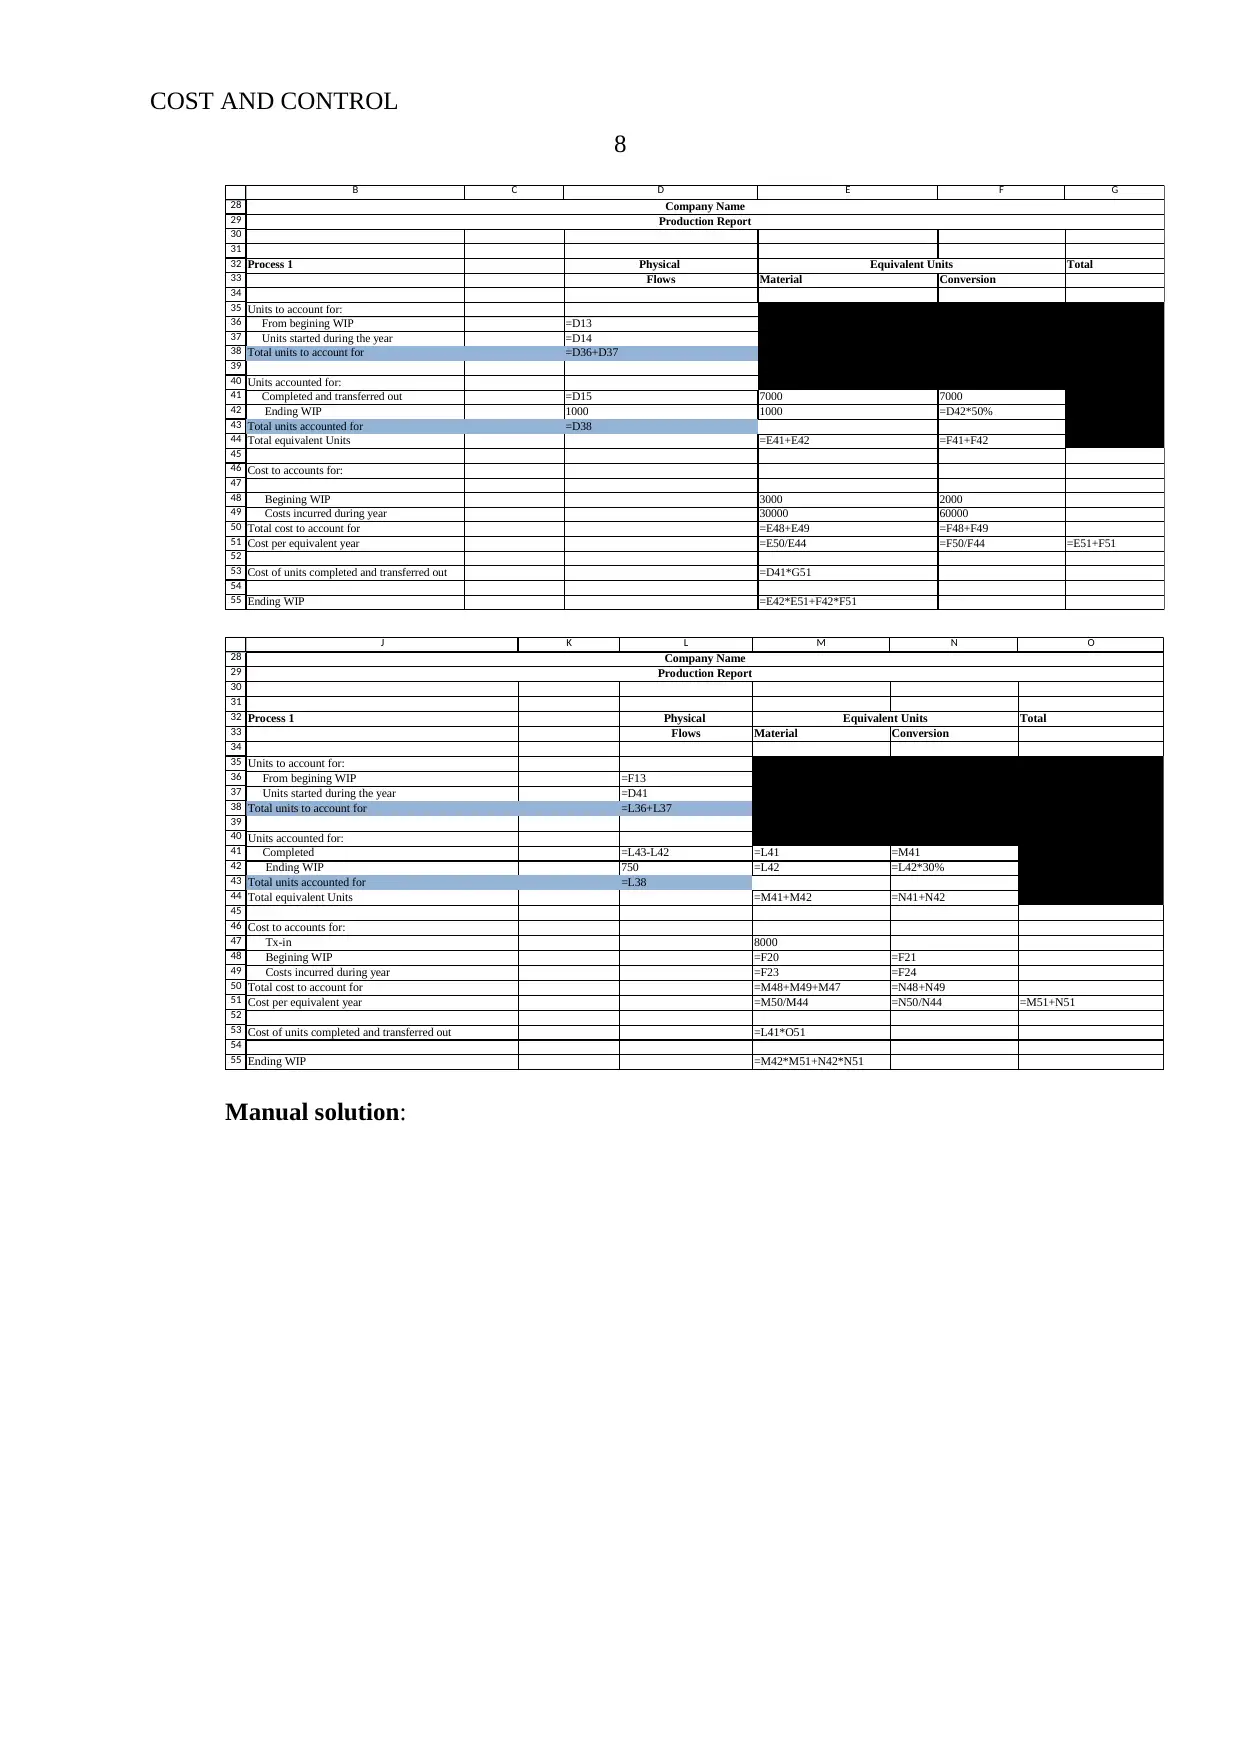
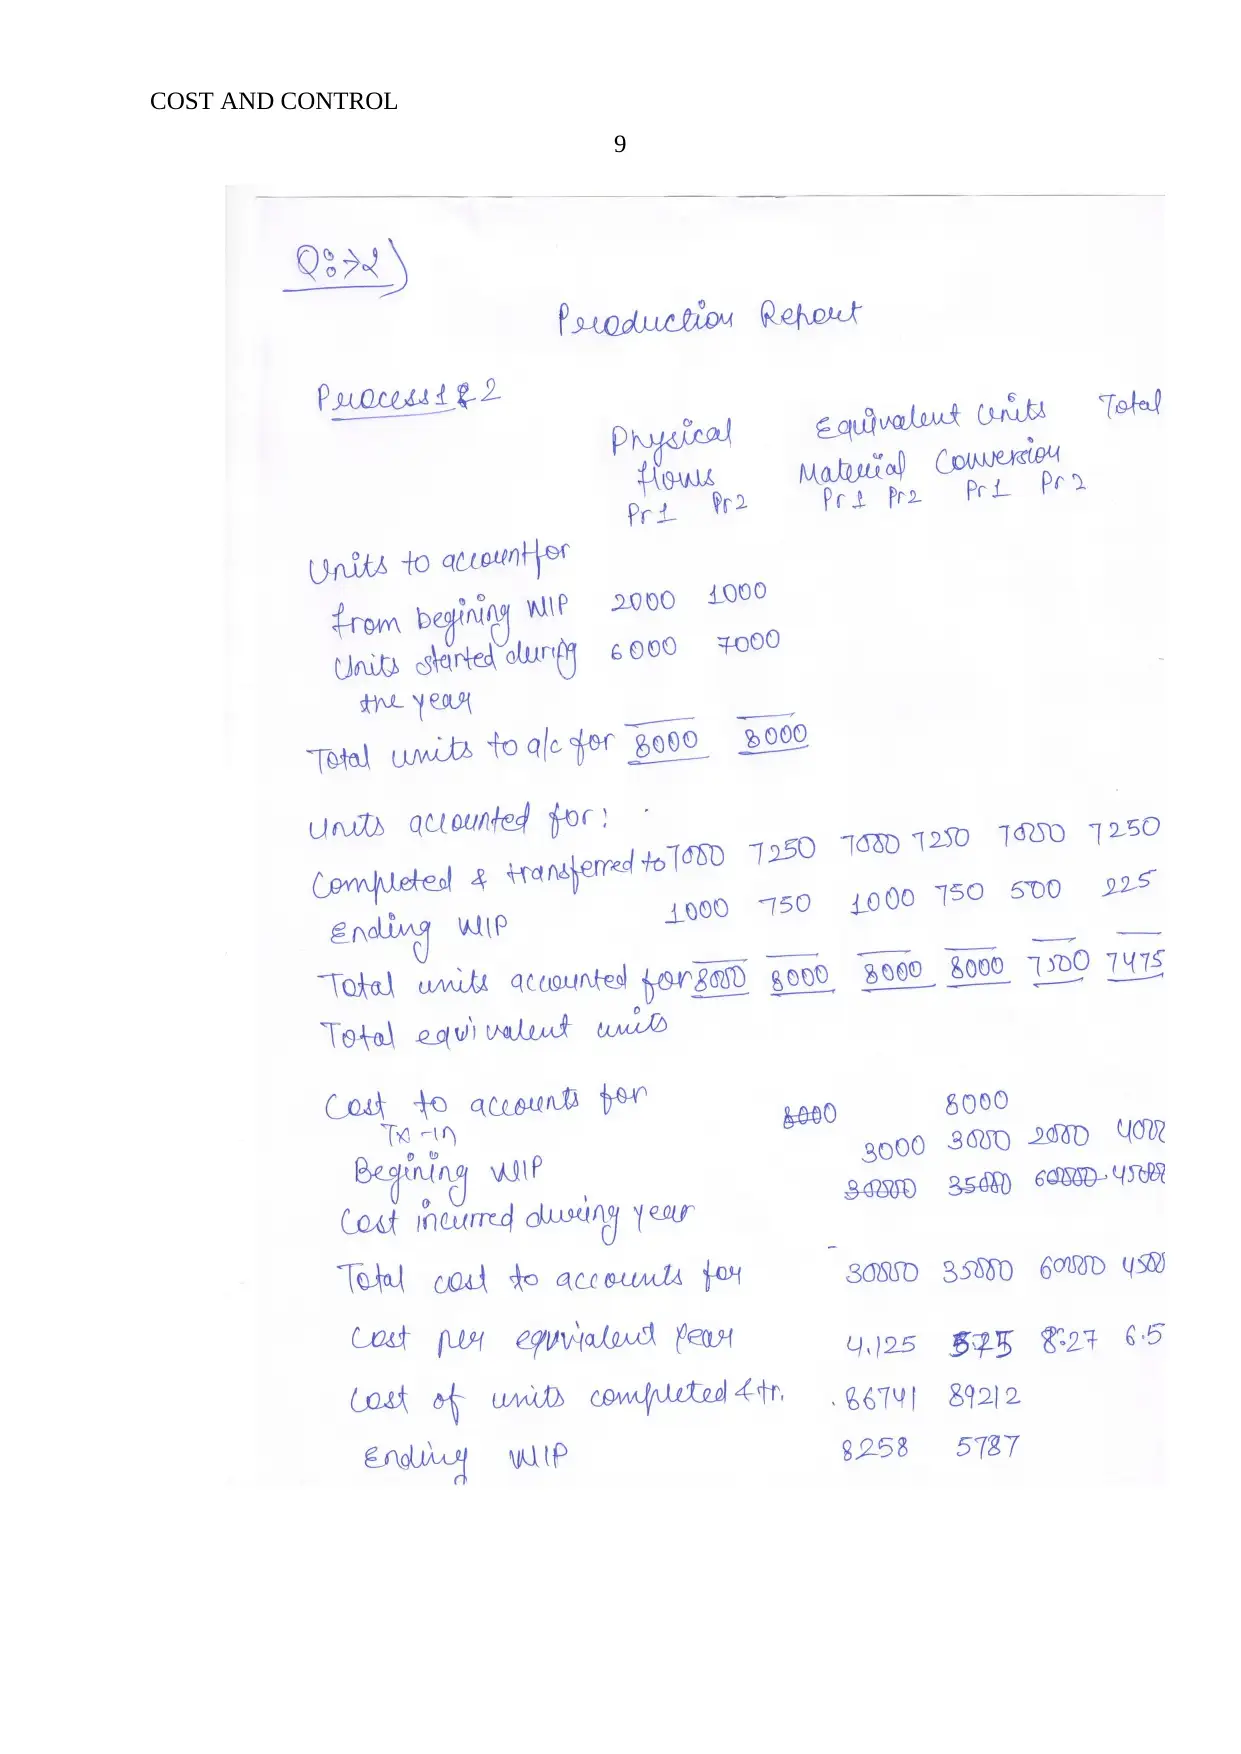
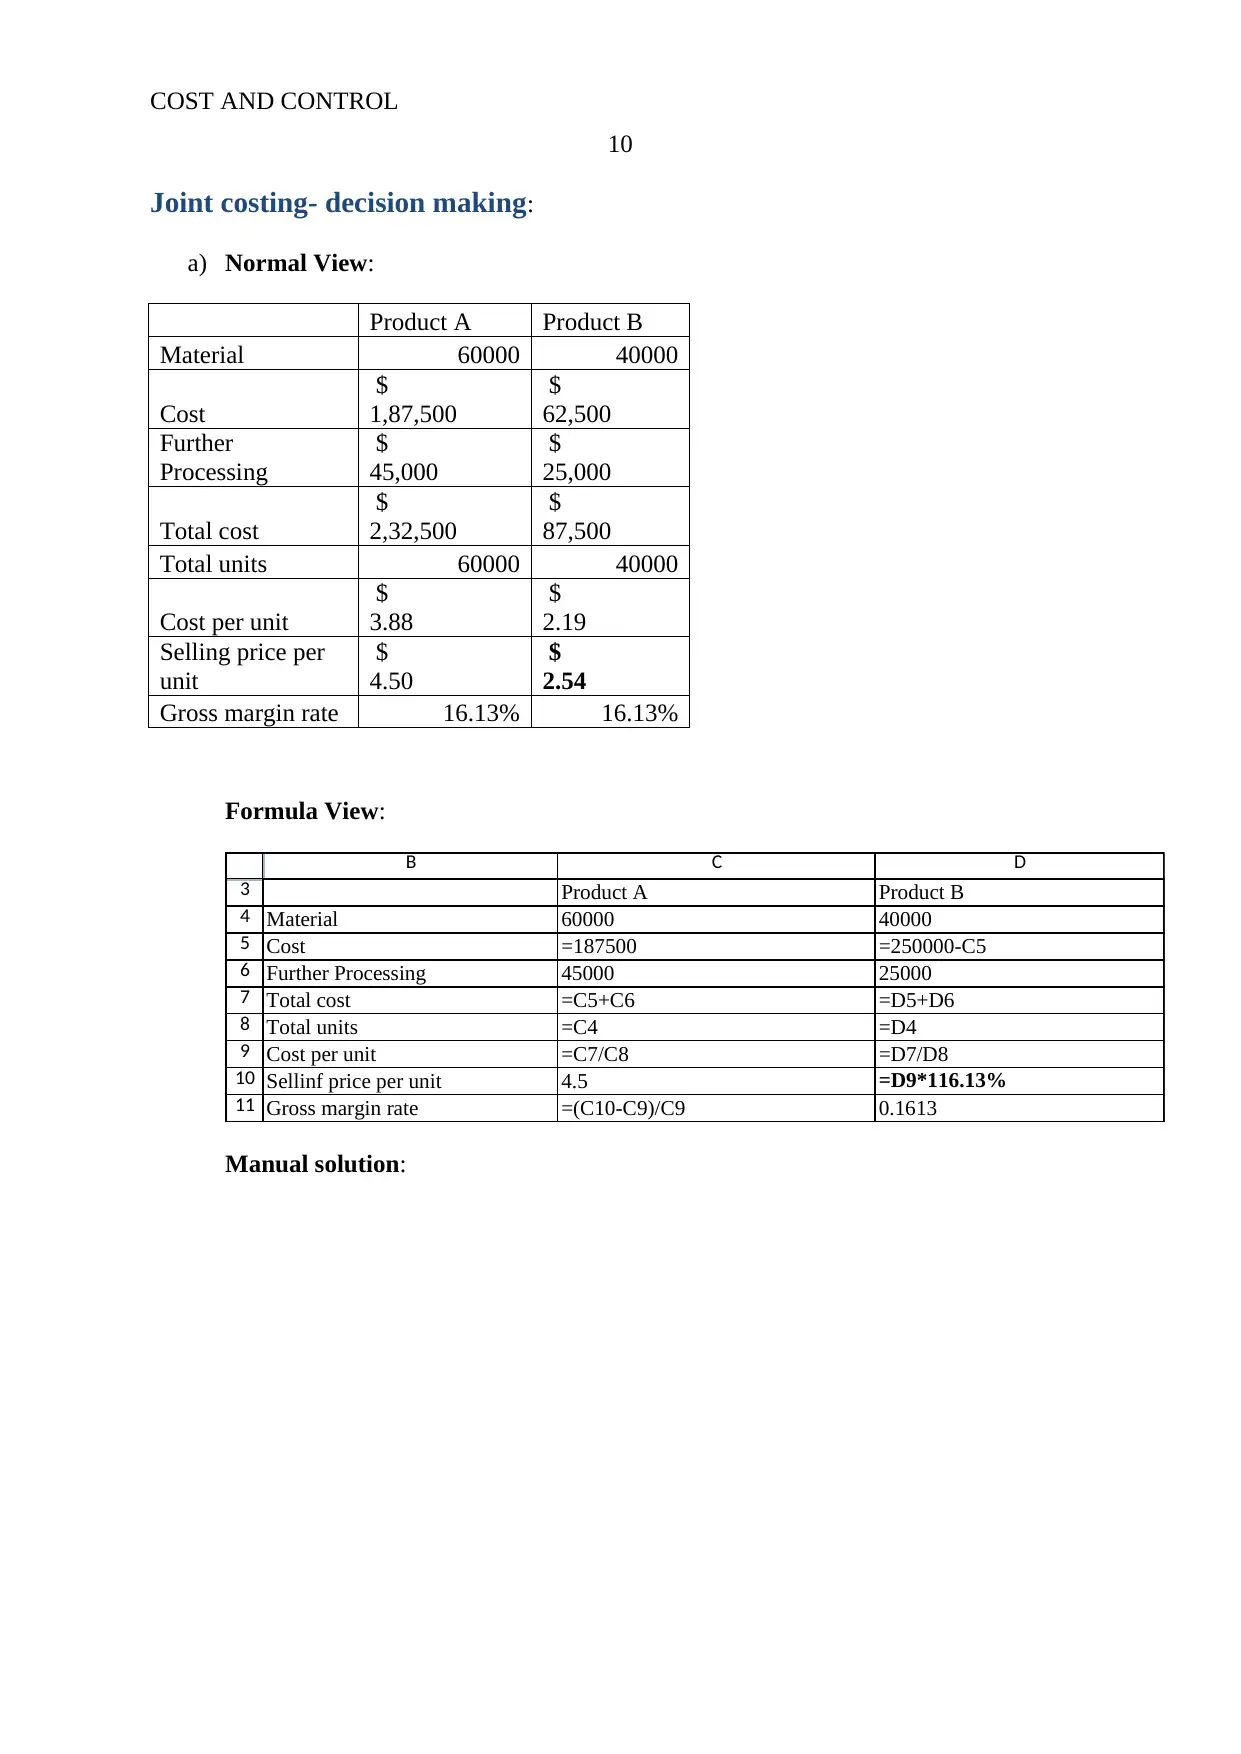
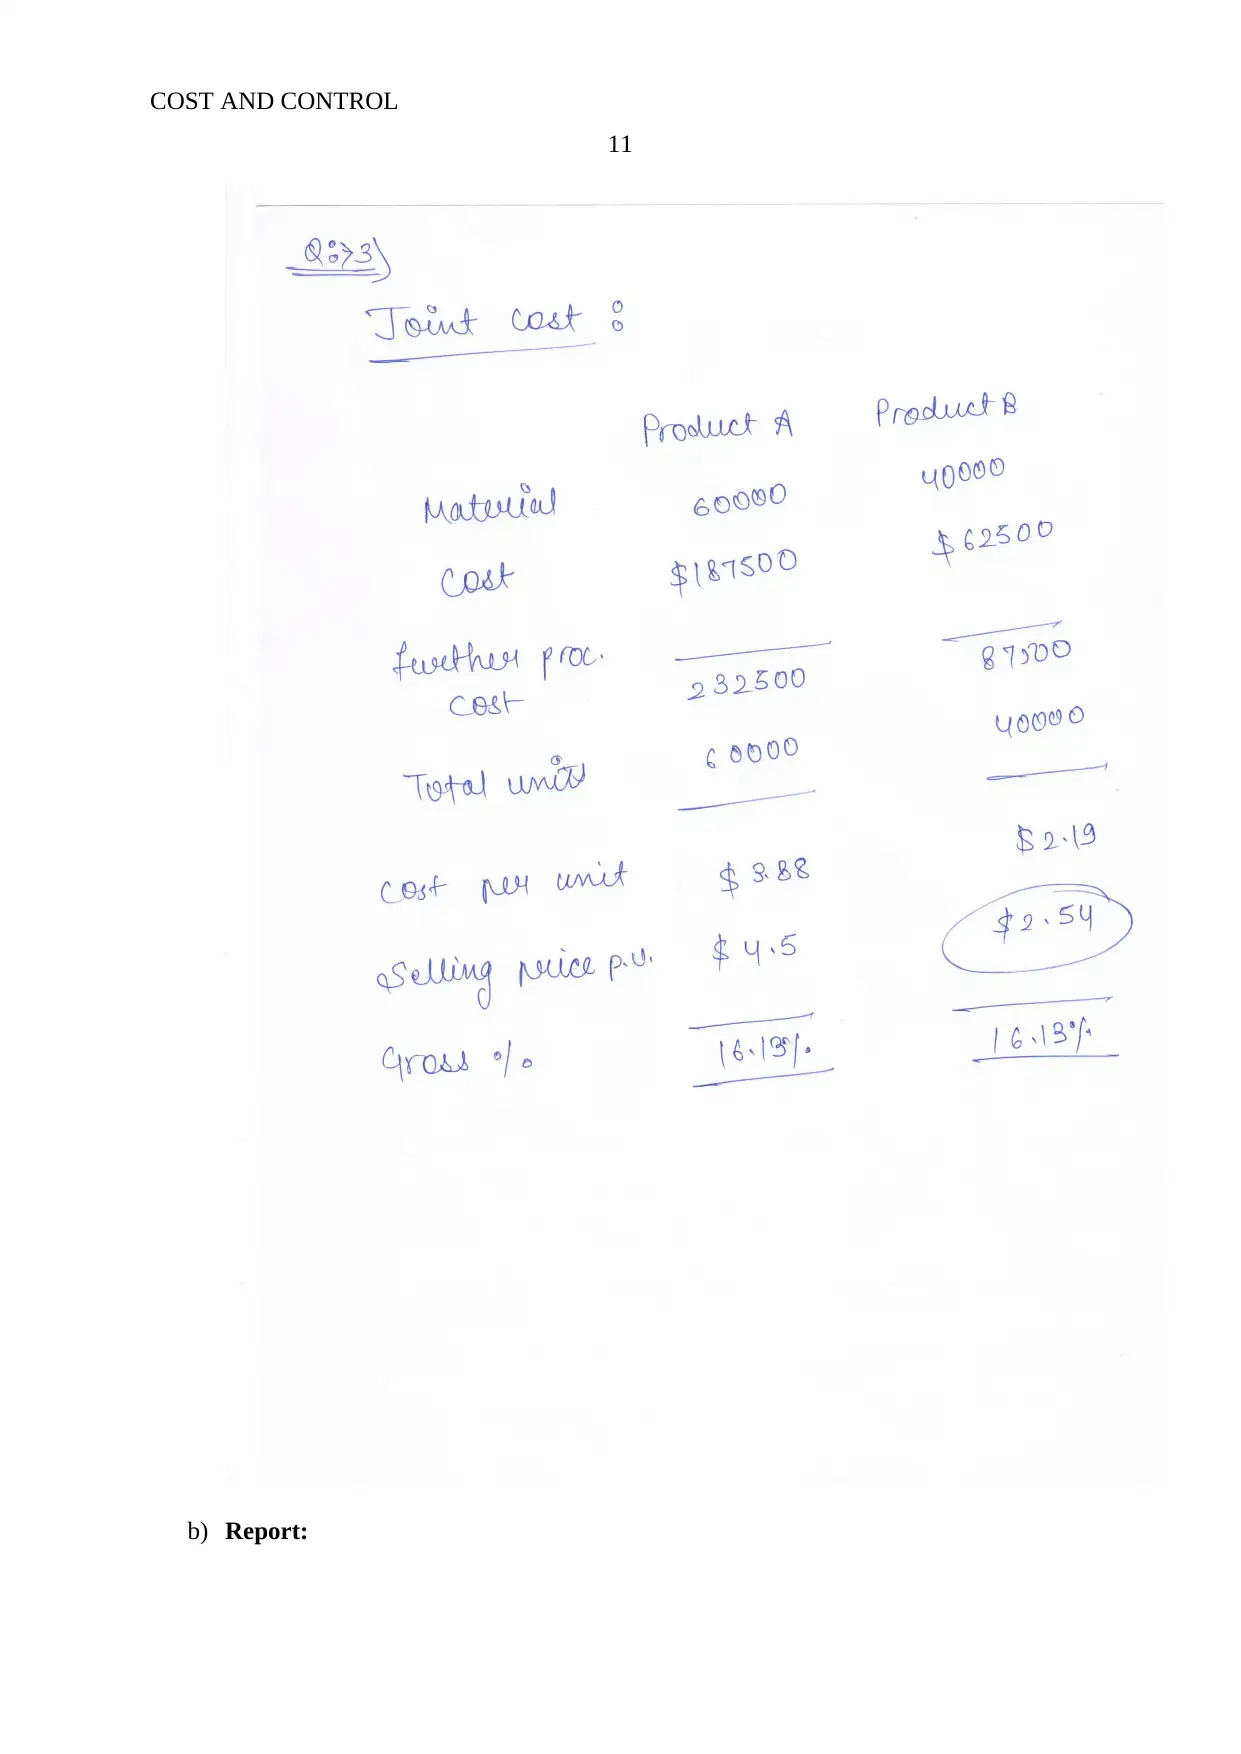
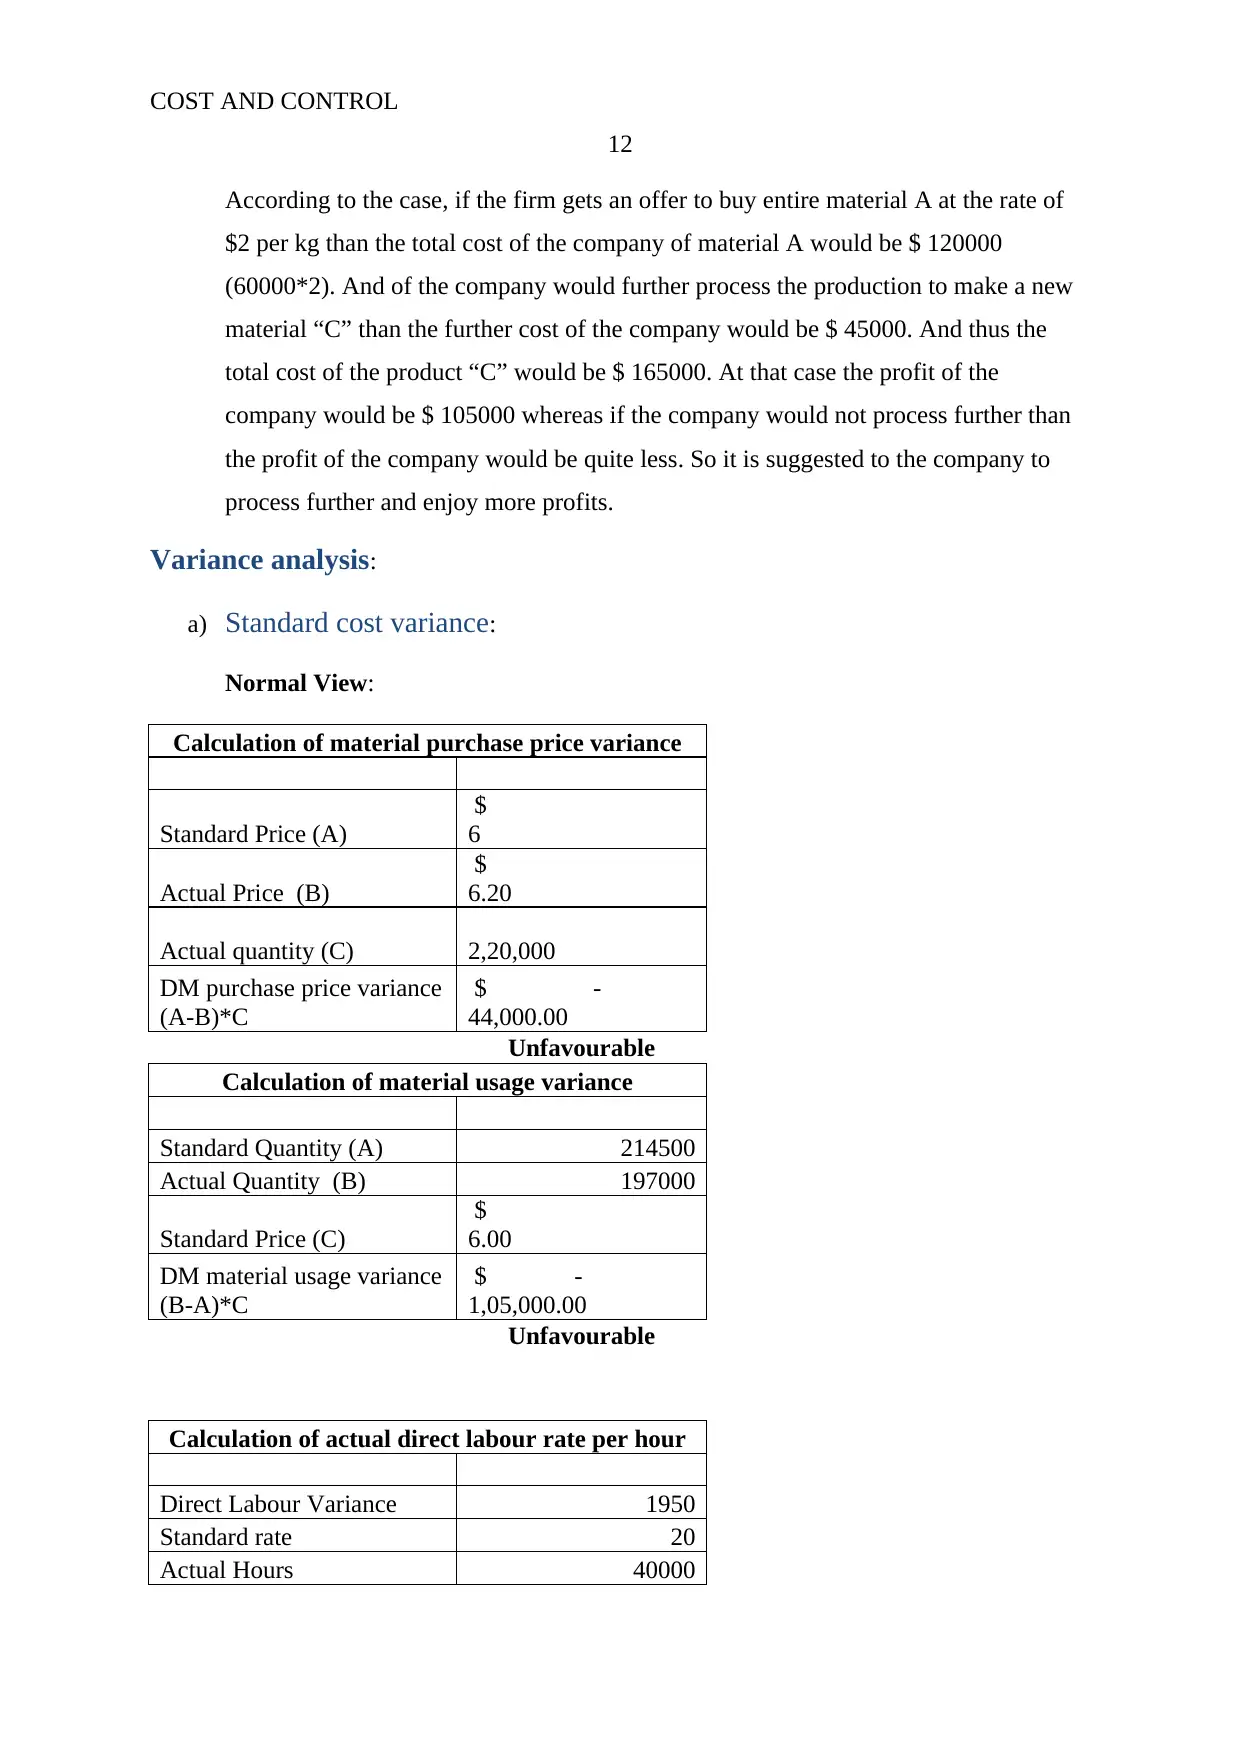
This project report provides a comprehensive analysis of cost and control principles, encompassing job costing, variance analysis, and budgeting techniques. The report begins with a detailed examination of job costing, including normal and formula views, along with manual solutions. It then delves into management accounting and its historical context, emphasizing modern cost management practices. The report further explores process costing, presenting production reports for two processes, complete with physical and equivalent units analysis, and cost calculations. Joint costing and decision-making are addressed, including normal views and formula views, along with a discussion of further processing decisions. The project also includes a thorough analysis of variance, covering material purchase price variance, material usage variance, and labor rate variance, along with journal entries. Finally, the report concludes with a financial model for forecasting income statements, providing a budgeting report for several years, including sales, cost of goods sold, and gross profit calculations.
tabler-icon-diamond-filled.svg

Contribute Materials

Your contribution can guide someone’s learning journey. Share your documents today.
Document Page
RUNNING HEAD: COST AND CONTROL
1
Project Report: Cost and control
tabler-icon-diamond-filled.svg

Secure Best Marks with AI Grader

Need help grading? Try our AI Grader for instant feedback on your assignments.
Document Page
COST AND CONTROL
2
Job costing:
a. Solution:
Normal View:
Direct material control
Debit credit
Particulars amount Particulars amount
balance b/d 23655 WIP 4810
Purchase 6155 balance c/d 25000
29810 29810
Work in process
Debit credit
Particulars amount Particulars amount
Balance b/d 6700
Direct Material 4810 Finished goods 30110
Labour 14800 balance c/d 8200
Factory overhead 12000
38310 38310
Finished Goods
Debit credit
Particulars amount Particulars amount
Balance b/d 8790 Sales 48000
WIP 30110 balance c/d 8900
gross profit 18000
56900 56900
Accounts Payable
Debit credit
Particulars amount Particulars amount
Balance b/d 2345
Cash 6700
Direct material
(purchase) 6155
balance
c/d 1800
8500 8500
Cost of goods sold
Document Page
COST AND CONTROL
3
Debit credit
Particulars amount Particulars amount
sales 48000 Gross profit 18000
Balance c/d 30000
48000 48000
Formula View:
3
4
5
6
7
8
9
10
11
12
13
14
15
16
17
18
19
20
21
22
23
24
25
26
B C D E
Debit credit
Particluars amount Particluars amount
balance b/d =C9-C7 WIP 4810
Purchase =J7 balance c/d 25000
=E9 =SUM(E6:E7)
Debit credit
Particluars amount Particluars amount
Balance b/d 6700
Direct Material =C18-(C16+C17+C14) Finished goods =C24
Labor =3700*4 balance c/d =(1200+7000)
Factory overhead =12000
=E18 =SUM(E15:E16)
Debit credit
Particluars amount Particluars amount
Balance b/d 8790 Sales 48000
WIP =C26-(C23+C25) balance c/d 8900
gross profit =48000*(60/160)
=E26 =SUM(E23:E24)
Direct material control
Work in process
Finished Goods
3
4
5
6
7
8
9
10
11
12
13
14
15
16
G H I J
Debit credit
Particluars amount Particluars amount
Balance b/d 2345
Cash 6700 Direct material (purchase) =J9-J6
balance c/d 1800
=SUM(H7:H8) =H9
Debit credit
Particluars amount Particluars amount
sales 48000 Gross prrofit =C25
Balanc c/d =J16-J14
=H14 =H16
Accounts Payable
Cost of goods sold
Document Page
COST AND CONTROL
4
Manual solution:
tabler-icon-diamond-filled.svg

Secure Best Marks with AI Grader

Need help grading? Try our AI Grader for instant feedback on your assignments.
Document Page
COST AND CONTROL
5
b. Management accounting and history:
Document Page
COST AND CONTROL
6
Modern cost management accounting is a procedure to record, classify, analyze,
summarize, allocate and evaluate the numerous alternative course of control over cost and
action regarding that. Modern concept of cost management depict that an organization must
consider every aspect while preparing the report of cost accounting. This would help the
company to manage the variances and would also assist to reduce the level of variances.
Such as if great pyramid of Giza is taken into consideration than it has been found that
due to a great power of prediction, the biggest structure in the worldwide which has been
made by hands of human. For preparing this structure, the high technique and prediction
power has been used by the humans and currently it shows their high prediction power and
the scientific techniques which had helped them to make the 7 wonders of the world (Snyder
and Davenport, 2013). The concept of modern cost management has also been prepared
according to that concept only. This depict that the modern cost accountant of the company
must look over various aspects so that the prediction could be made according to the great
pyramid of Giza and company could enjoy the high growth in the market.
Process Costing:
Normal View:
Company Name
Production Report
Process 1 Physical Equivalent Units Total
Flows Material Conversion
Units to account for:
From beginning WIP 2000 600 600
Units started during the year 6000 6000 6000
Total units to account for 8000
Units accounted for:
Completed and transferred
out 7000 7000 7000
Ending WIP 1000 1000 500
Total units accounted for 8000
Total equivalent Units 8000 7500
Cost to accounts for:
Document Page
COST AND CONTROL
7
Beginning WIP 3000 2000
Costs incurred during year 30000 60000
Total cost to account for 33000 62000
Cost per equivalent year 4.125 8.2666667 12.3917
Cost of units completed and transferred out 86741.66667
Ending WIP 8258.333333
Company Name
Production Report
Process 2 Physical Equivalent Units Total
Flows Material Conversion
Units to account for:
From beginning WIP 1000 300 300
Units started during the year 7000 6000 6000
Total units to account for 8000
Units accounted for:
Completed 7250 7250 7250
Ending WIP 750 750 225
Total units accounted for 8000
Total equivalent Units 8000 7475
Cost to accounts for:
Tx-in $ 8,000
Beginning WIP $ 3,000 $ 4,000
Costs incurred during year $ 35,000 $ 45,000
Total cost to account for $ 46,000 49000
Cost per equivalent year 5.75 6.5551839 12.3051839
Cost of units completed and transferred out 89212.5836
Ending WIP 5787.41639
Formula View:
tabler-icon-diamond-filled.svg

Paraphrase This Document

Need a fresh take? Get an instant paraphrase of this document with our AI Paraphraser
Document Page
COST AND CONTROL
8
28
29
30
31
32
33
34
35
36
37
38
39
40
41
42
43
44
45
46
47
48
49
50
51
52
53
54
55
B C D E F G
Process 1 Physical Total
Flows Material Conversion
Units to account for:
From begining WIP =D13 =D36*30% =D36*30%
Units started during the year =D14 6000 6000
Total units to account for =D36+D37
Units accounted for:
Completed and transferred out =D15 7000 7000
Ending WIP 1000 1000 =D42*50%
Total units accounted for =D38
Total equivalent Units =E41+E42 =F41+F42
Cost to accounts for:
Begining WIP 3000 2000
Costs incurred during year 30000 60000
Total cost to account for =E48+E49 =F48+F49
Cost per equivalent year =E50/E44 =F50/F44 =E51+F51
Cost of units completed and transferred out =D41*G51
Ending WIP =E42*E51+F42*F51
Equivalent Units
Company Name
Production Report
28
29
30
31
32
33
34
35
36
37
38
39
40
41
42
43
44
45
46
47
48
49
50
51
52
53
54
55
J K L M N O
Process 1 Physical Total
Flows Material Conversion
Units to account for:
From begining WIP =F13 =L36*30% =L36*30%
Units started during the year =D41 6000 6000
Total units to account for =L36+L37
Units accounted for:
Completed =L43-L42 =L41 =M41
Ending WIP 750 =L42 =L42*30%
Total units accounted for =L38
Total equivalent Units =M41+M42 =N41+N42
Cost to accounts for:
Tx-in 8000
Begining WIP =F20 =F21
Costs incurred during year =F23 =F24
Total cost to account for =M48+M49+M47 =N48+N49
Cost per equivalent year =M50/M44 =N50/N44 =M51+N51
Cost of units completed and transferred out =L41*O51
Ending WIP =M42*M51+N42*N51
Company Name
Production Report
Equivalent Units
Manual solution:
Document Page
COST AND CONTROL
9
Document Page
COST AND CONTROL
10
Joint costing- decision making:
a) Normal View:
Product A Product B
Material 60000 40000
Cost
$
1,87,500
$
62,500
Further
Processing
$
45,000
$
25,000
Total cost
$
2,32,500
$
87,500
Total units 60000 40000
Cost per unit
$
3.88
$
2.19
Selling price per
unit
$
4.50
$
2.54
Gross margin rate 16.13% 16.13%
Formula View:
3
4
5
6
7
8
9
10
11
B C D
Product A Product B
Material 60000 40000
Cost =187500 =250000-C5
Further Processing 45000 25000
Total cost =C5+C6 =D5+D6
Total units =C4 =D4
Cost per unit =C7/C8 =D7/D8
Sellinf price per unit 4.5 =D9*116.13%
Gross margin rate =(C10-C9)/C9 0.1613
Manual solution:
tabler-icon-diamond-filled.svg

Secure Best Marks with AI Grader

Need help grading? Try our AI Grader for instant feedback on your assignments.
Document Page
COST AND CONTROL
11
b) Report:
Document Page
COST AND CONTROL
12
According to the case, if the firm gets an offer to buy entire material A at the rate of
$2 per kg than the total cost of the company of material A would be $ 120000
(60000*2). And of the company would further process the production to make a new
material “C” than the further cost of the company would be $ 45000. And thus the
total cost of the product “C” would be $ 165000. At that case the profit of the
company would be $ 105000 whereas if the company would not process further than
the profit of the company would be quite less. So it is suggested to the company to
process further and enjoy more profits.
Variance analysis:
a) Standard cost variance:
Normal View:
Calculation of material purchase price variance
Standard Price (A)
$
6
Actual Price (B)
$
6.20
Actual quantity (C) 2,20,000
DM purchase price variance
(A-B)*C
$ -
44,000.00
Unfavourable
Calculation of material usage variance
Standard Quantity (A) 214500
Actual Quantity (B) 197000
Standard Price (C)
$
6.00
DM material usage variance
(B-A)*C
$ -
1,05,000.00
Unfavourable
Calculation of actual direct labour rate per hour
Direct Labour Variance 1950
Standard rate 20
Actual Hours 40000
Document Page
COST AND CONTROL
13
Actual direct labour rate per
hour 20.05
Books of KLINGTON limited
Journal Entries
Raw material $ 13,64,000
Accounts Payable
$
13,64,000
Direct Labour a/c 801950
Cash 801950
Formula View:
23
24
25
26
27
28
29
30
31
32
33
34
35
36
37
38
39
40
41
42
43
44
B C
Standrad Price (A) 6
Actual Price (B) =C18/C17
Auctual quantity (C) =C17
DM purchase price varinace (A-B)*C =(C25-C26)*C27
=IF(C28>=0, "Favorable", "Unfavourable")
Standrad Quantity (A) =19500*11
Actual Quantity (B) 197000
Standard Price (C) =C25
DM material usge varinace (B-A)*C =(C34-C33)*C35
=IF(C36>=0, "Favorable", "Unfavourable")
Direct Labour Variance 1950
Standrad rate 20
Actual Hours 40000
Actual direct labour rate per hour =((C43*C42)+C41)/40000
Calculation of material purchase price varinace
Calculation of material usage varinace
Calculation of actual direct labor rate per hour
tabler-icon-diamond-filled.svg

Paraphrase This Document

Need a fresh take? Get an instant paraphrase of this document with our AI Paraphraser
Document Page
COST AND CONTROL
14
48
49
50
51
52
53
54
55
56
B C D
Raw material =C18
Accounts Payable =C51
Direct Labour a/c =C43*C44
Cash =C54
Books of KLINGTON limited
Journal Entries
Manual solution:
Document Page
COST AND CONTROL
15
Document Page
COST AND CONTROL
16
b) Report:
tabler-icon-diamond-filled.svg

Secure Best Marks with AI Grader

Need help grading? Try our AI Grader for instant feedback on your assignments.
Document Page
COST AND CONTROL
17
Variances analysis is an examination over the actual and budgeted data. This study
depict the user about the various quantitative investigations such as differences in budgeted
quantity and actual quantity used, differences in actual price of a product and budgeted price
of a product etc. mainly, this investigations are done to maintain the control over the cost of a
business. It is an important study. The main assistance of variance analysis depends upon the
structure of the business. Such as in a manufacturing company, it helps the company to
manage the cost, in a company of project management, variance analysis helps the company
to maintain the control over the expenses of the project through monitoring the budgeted
versus actual cost of the company.
Further, there are various aspects in which variance analysis study helps an
organization to manage and maintain the control over the time, cost, quantity etc and make a
better decision about the operations and profitability of the company. Such as variance
analysis helps the business in managing the relationship among various related aspects such
as enhancement into the sales of one product directly enhance the sales of other product. For
instance, pen and ink are the best example (Stratton, SAS Institute Inc., 2009). Variance
analysis also helps the business t forecast the future performance of the business. It becomes
easy for the company to make the budgeting report through analyzing the variance analysis of
last year. Variance analysis depict about the lose point of the company which could be
improved to manage the performance of the company.
Variance analysis are of various type such as material price variance, material usage
variance, labour rate variance, labour hour variance, Overhead variance etc. every variance
analysis is useful for the company in different manner but the common aim of every variance
analysis to maintain the control over the cost of the business. And it also assists the company
to make better budgeting report in near future (Garrison et al, 2013).
Overhead variance analysis has been studied further. Overhead could be defined as
the average of indirect labour cost, material cost and expenses. Overhead cost variance could
be explained as difference between the standard cost and actual overhead cost occurred.
Following are the formulas of overhead variance
Document Page
COST AND CONTROL
18
Overhead variance analysis are mainly used by the companies to make a control over
all the indirect expenses such as indirect material cost which are indirectly helpful for the
production, indirect labour cost which is not directly imposed into the production and other
indirect expenses. Through this report, it has been analyzed that the overhead variances are
very helpful for the company to maintain the expenses and make a control over the expenses
to reduce the level of the expenses. Favourable overhead variance analysis depict that the
performance of the company is positive and company is occurring less cost which has been
estimated whereas the unfavourable overhead variance analysis depict that the performance
of the company is negative and company is occurring more cost than the estimated cost.
Budgeting:
a) Financial model to forecast Income Statements:
Normal View:
Budgeting report
20X1 20X2 20X3 20X4 20X5 20X6
Sales 30000 32400 34992 37791.4 40000 40000
Unit Selling price 6.5 6.63 6.968 7.384 8.127 8.775
Sales Price 195000 214812 243824 279051 325080 351000
Less: cost of goods sold 150000 165240 187557 214655 240800 260000
Gross Profit 45000 49572 56267.1 64396.5 84280 91000
Less:
General and administrative
expenses 27300 30073.7 34135.4 39067.2 45511.2 49140
Dividend 6972.73 7681.16 8718.56 9978.2 15272.6 16490.3
Profit 10727.3 11817.2 13413.2 15351.1 23496.2 25369.7
Document Page
COST AND CONTROL
19
Less: Tax 4290.91 4726.87 5365.27 6140.43 9398.5 10147.9
Net Profit 6436.36 7090.3 8047.91 9210.65 14097.7 15221.8
Formula View:
2
3
4
5
6
7
8
9
10
11
12
13
14
15
16
17
18
B C D E F G H
20X1 20X2 20X3 20X4 20X5 20X6
Sales 30000 =C6*108% =D6*108% =E6*108% 40000 40000
Unit Seling price =5*130% =5.1*130% =5.36*130% =5.68*130% =6.02*135% =6.5*135%
Sales Price =C6*C7 =D6*D7 =E6*E7 =F6*F7 =G6*G7 =H6*H7
Less: cost of goods sold =C6*5 =D6*5.1 =E6*5.36 =F6*5.68 =G6*6.02 =H6*6.5
Gross Profit =C8-C9 =D8-D9 =E8-E9 =F8-F9 =G8-G9 =H8-H9
Less:
General and administratuve expenses =C8*14% =D8*14% =E8*14% =F8*14% =G8*14% =H8*14%
Dividend =(C10-C13)*65/165 =(D10-D13)*65/165 =(E10-E13)*65/165 =(F10-F13)*65/165 =(G10-G13)*65/165 =(H10-H13)*65/165
Profit =C10-(C13+C14) =D10-(D13+D14) =E10-(E13+E14) =F10-(F13+F14) =G10-(G13+G14) =H10-(H13+H14)
Less: Tax =C15*40% =D15*40% =E15*40% =F15*40% =G15*40% =H15*40%
Net Profit =C15-C17 =D15-D17 =E15-E17 =F15-F17 =G15-G17 =H15-H17
Budgeting report
Manual solution:
tabler-icon-diamond-filled.svg

Paraphrase This Document

Need a fresh take? Get an instant paraphrase of this document with our AI Paraphraser
Document Page
COST AND CONTROL
20
b) Political process:
Document Page
COST AND CONTROL
21
Budgeting is a process in which estimation is prepared about the future
expenses and the revenue of the company. These budgeting plans are prepared by an
organization to maintain the performance and to determine the future prediction of the
company.
The below carton picture of budgeting depict about the American budget. In
this cartoon, it has been depicted that the government of America has made various
changes into the budgeting process of the state. According to this, the budgeting
amount has been cut to enhance the budget amount of various other aspects. This
depict that the budget reports are prepared after predicting the future of the America
and according to that the new budget reports have been prepared so that the issues
could be resolved by the country easily (Weygandt, Kimmel & Kieso, 2015).
Document Page
COST AND CONTROL
22
References:
Weygandt, J. J., Kimmel, P. D., & Kieso, D. E. (2015). Financial & Managerial Accounting.
John Wiley & Sons.
Stratton, A.J., SAS Institute Inc., (2009). Systems and methods for costing reciprocal
relationships. U.S. Patent 7,634,431.
Snyder, H. and Davenport, E., (2013). What does it really cost? Allocating indirect
costs. Asian Libraries.
Garrison, R. H., Noreen, E. W., Brewer, P. C., & McGowan, A. (2010). Managerial
accounting. Issues in Accounting Education, 25(4), 792-793.
chevron_up_icon
1 out of 22
circle_padding
hide_on_mobile
zoom_out_icon
logo.png

Your All-in-One AI-Powered Toolkit for Academic Success.

Available 24*7 on WhatsApp / Email

[object Object]