Management Accounting for Cost and Control Assignment - Analysis
VerifiedAdded on 2022/09/26
|18
|2138
|19
Homework Assignment
AI Summary
This assignment analyzes the application of management accounting principles for cost and control within the context of Farm Organic Ltd, a business providing organic drenches. The solution begins with a value chain analysis, identifying opportunities for the company and discussing the importance of collaboration and market orientation. It then proceeds to prepare a cost of goods manufactured statement, calculate cost of sales and gross profit, and discuss the limitations of such statements for decision-making. The assignment further explores overhead allocation methods (direct, step-down, and reciprocal), calculates overhead allocation rates, and performs journal entries. Finally, it examines different costing methods (weighted average and FIFO) for inventory valuation, and provides journal entries for production costs, explaining the differences between the methods. The assignment uses realistic data to illustrate the application of these concepts in a practical business scenario.
Running head: MANAGEMENT ACCOUNTING FOR COST AND CONTROL
Management Accounting for Cost and Control
Name of the Student:
Name of the University:
Authors Note:
Management Accounting for Cost and Control
Name of the Student:
Name of the University:
Authors Note:
Paraphrase This Document
Need a fresh take? Get an instant paraphrase of this document with our AI Paraphraser
MANAGEMENT ACCOUNTING FOR COST AND CONTROL
Table of Contents
Question 1:.................................................................................................................................3
Introduction:...............................................................................................................................3
Discussion:.................................................................................................................................3
Conclusion:................................................................................................................................4
Question 2:.................................................................................................................................5
1. Preparing the cost of goods manufactured statement for the month ended 31 July 2019:.....5
2. Depicting company’s cost of sales for the month ended 31 July 2019:.................................5
3. Depicting company’s gross profit for the month ended 31 July 2019:..................................6
4. Explaining David about the limitations of a cost of goods manufactured statement for
decision making:........................................................................................................................6
Question 3:.................................................................................................................................7
1. Allocating the support department costs to the operating departments using the direct
method:.......................................................................................................................................7
2. Allocating the support department costs to the operating departments using the step-down
method:.......................................................................................................................................7
3. Allocating the support department costs to the operating departments using the reciprocal
method:.......................................................................................................................................8
Question 4:.................................................................................................................................9
1. Estimated overhead allocation rate:.......................................................................................9
2. Total overhead allocated to job Gargantua:...........................................................................9
3. Unit cost for this job:..............................................................................................................9
MANAGEMENT ACCOUNTING FOR COST AND CONTROL
4. Actual overhead for the Gargantua job:.................................................................................9
5. Journal entries to record the allocation:...............................................................................10
6. Total profit and the profit per unit:......................................................................................10
Question 5:...............................................................................................................................10
1. Depicting the cost:................................................................................................................10
2. Journal entries to record the production costs for February:................................................14
3. Explaining the difference between the costs calculated using the weighted average cost
method and the FIFO method:.................................................................................................15
References and Bibliography:..................................................................................................16
⊘ This is a preview!⊘
Do you want full access?
Subscribe today to unlock all pages.
Trusted by 1+ million students worldwide
MANAGEMENT ACCOUNTING FOR COST AND CONTROL
Question 1:
Introduction:
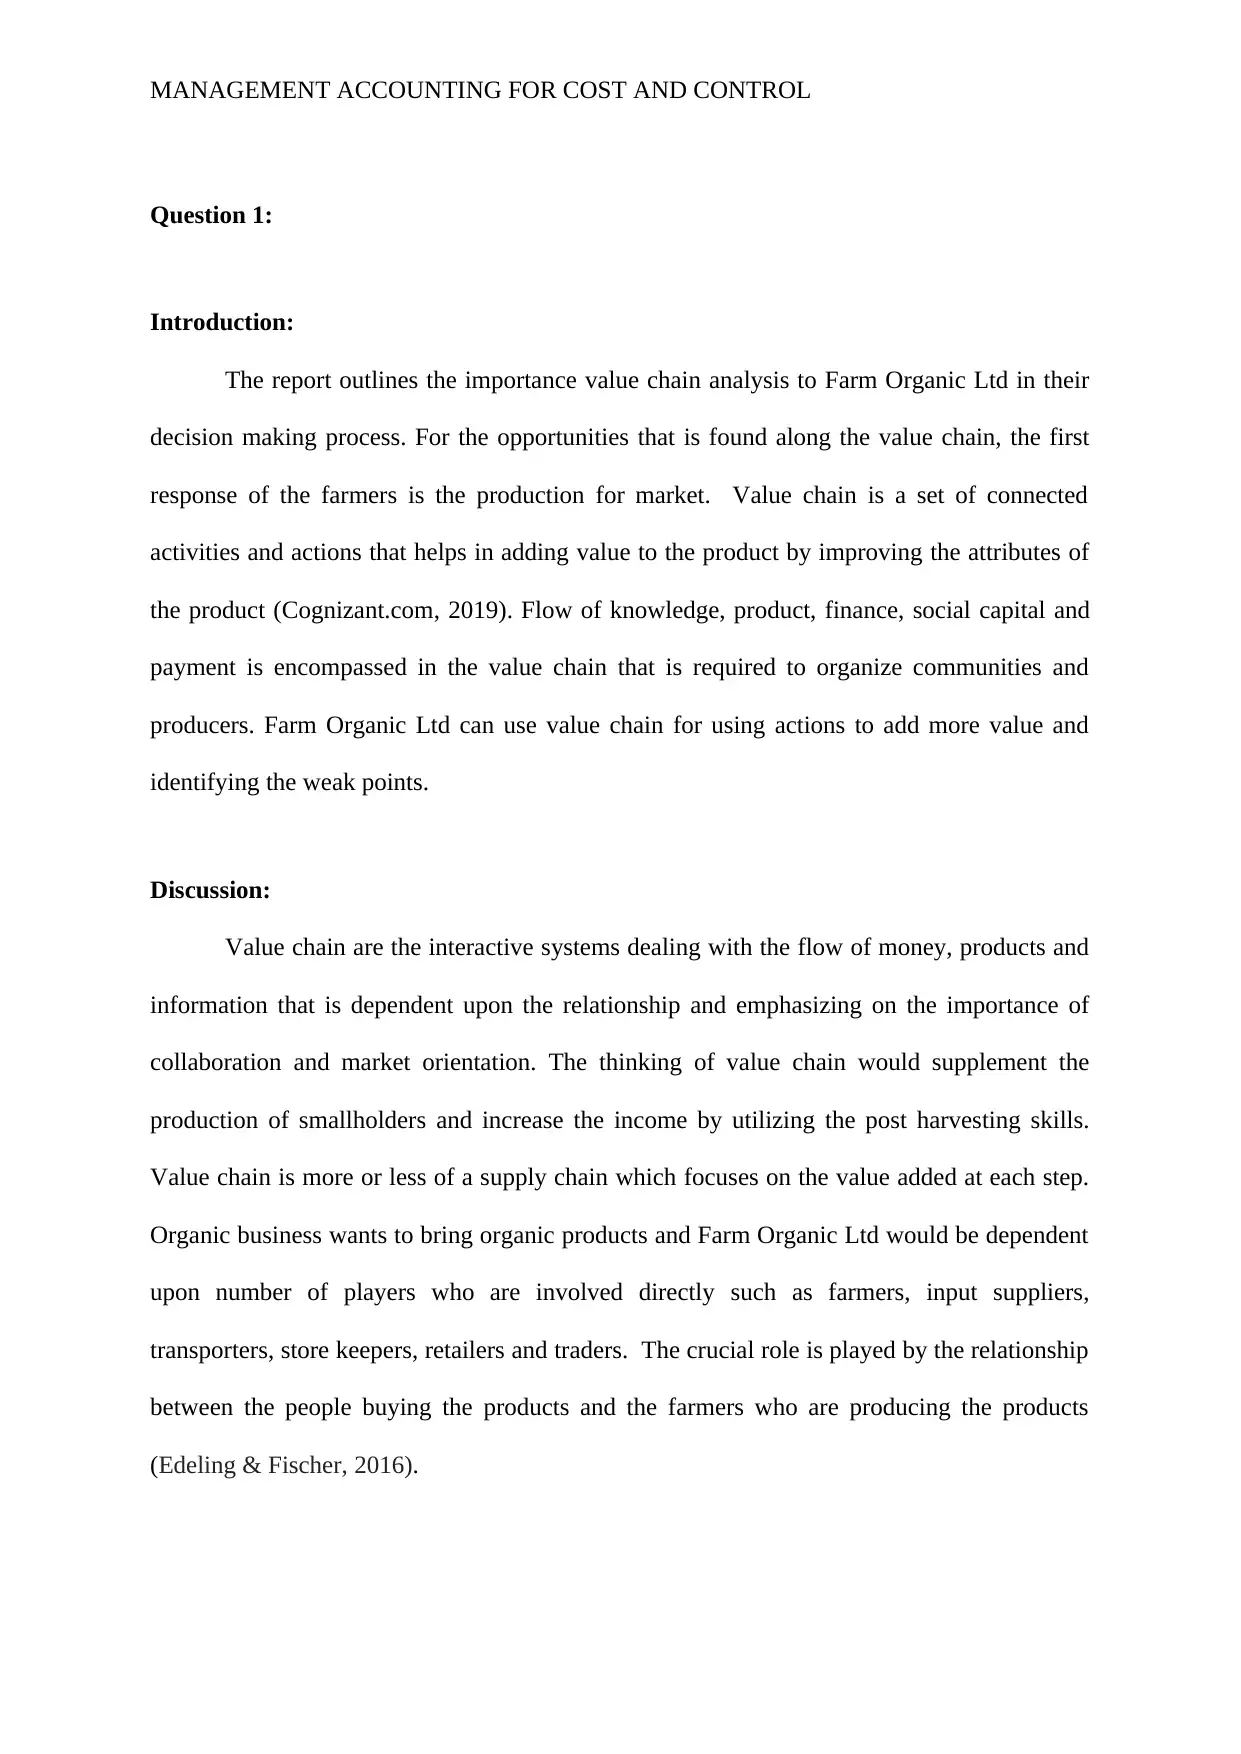
The report outlines the importance value chain analysis to Farm Organic Ltd in their
decision making process. For the opportunities that is found along the value chain, the first
response of the farmers is the production for market. Value chain is a set of connected
activities and actions that helps in adding value to the product by improving the attributes of
the product (Cognizant.com, 2019). Flow of knowledge, product, finance, social capital and
payment is encompassed in the value chain that is required to organize communities and
producers. Farm Organic Ltd can use value chain for using actions to add more value and
identifying the weak points.
Discussion:
Value chain are the interactive systems dealing with the flow of money, products and
information that is dependent upon the relationship and emphasizing on the importance of
collaboration and market orientation. The thinking of value chain would supplement the
production of smallholders and increase the income by utilizing the post harvesting skills.
Value chain is more or less of a supply chain which focuses on the value added at each step.
Organic business wants to bring organic products and Farm Organic Ltd would be dependent
upon number of players who are involved directly such as farmers, input suppliers,
transporters, store keepers, retailers and traders. The crucial role is played by the relationship
between the people buying the products and the farmers who are producing the products
(Edeling & Fischer, 2016).
Question 1:
Introduction:
The report outlines the importance value chain analysis to Farm Organic Ltd in their
decision making process. For the opportunities that is found along the value chain, the first
response of the farmers is the production for market. Value chain is a set of connected
activities and actions that helps in adding value to the product by improving the attributes of
the product (Cognizant.com, 2019). Flow of knowledge, product, finance, social capital and
payment is encompassed in the value chain that is required to organize communities and
producers. Farm Organic Ltd can use value chain for using actions to add more value and
identifying the weak points.
Discussion:
Value chain are the interactive systems dealing with the flow of money, products and
information that is dependent upon the relationship and emphasizing on the importance of
collaboration and market orientation. The thinking of value chain would supplement the
production of smallholders and increase the income by utilizing the post harvesting skills.
Value chain is more or less of a supply chain which focuses on the value added at each step.
Organic business wants to bring organic products and Farm Organic Ltd would be dependent
upon number of players who are involved directly such as farmers, input suppliers,
transporters, store keepers, retailers and traders. The crucial role is played by the relationship
between the people buying the products and the farmers who are producing the products
(Edeling & Fischer, 2016).
Paraphrase This Document
Need a fresh take? Get an instant paraphrase of this document with our AI Paraphraser
MANAGEMENT ACCOUNTING FOR COST AND CONTROL
Farm Organic limited can capture the value with the help of value chain by buying
into the value added enterprise and integrating with such value added facts. This involve pre-
production enterprises, post-harvest processing of products and post-harvest handling of
products. A value adding possibility is represented by each of these activities and the value
added by the value chain has shown to be remarkably adaptive to the evolving demands of
customer. The increase in the popularity of organic food would require the business to
manage the complex and increasingly global environment (Hu et al., 2018). Value chain will
help retailers in collaborating with others that helps in fulfillment of needs of customers
through the joint efforts for the operation of warehouse such as fulfillment, management of
inventory, providing home delivery and operating and creating online stores. The existing
model of supply chain is restructured by involving local organic farmers in the planning of
the delivery network of value chain. In addition to all these, the value chain helps in the
integration of the end customers with the perspective of supply chain and make a contribution
to the framework of consumer behavior (Ey.com, 2019). The competitive position of the
organic farmers in the value chain can be improved through the collective organic marketing.
Conclusion:
Organic products producers are struggling to optimize the scale of their operations
and at the same time for maintaining profitability. It is so because producers such as Farm
Organic Ltd faces challenges in terms of increasing input cost, challenges pertaining to
certification and elongated conversion period. Therefore, the development of comprehensive
value chain would make organic market more profitable and scalable by bringing down cost
of cultivation.
MANAGEMENT ACCOUNTING FOR COST AND CONTROL
Question 2:
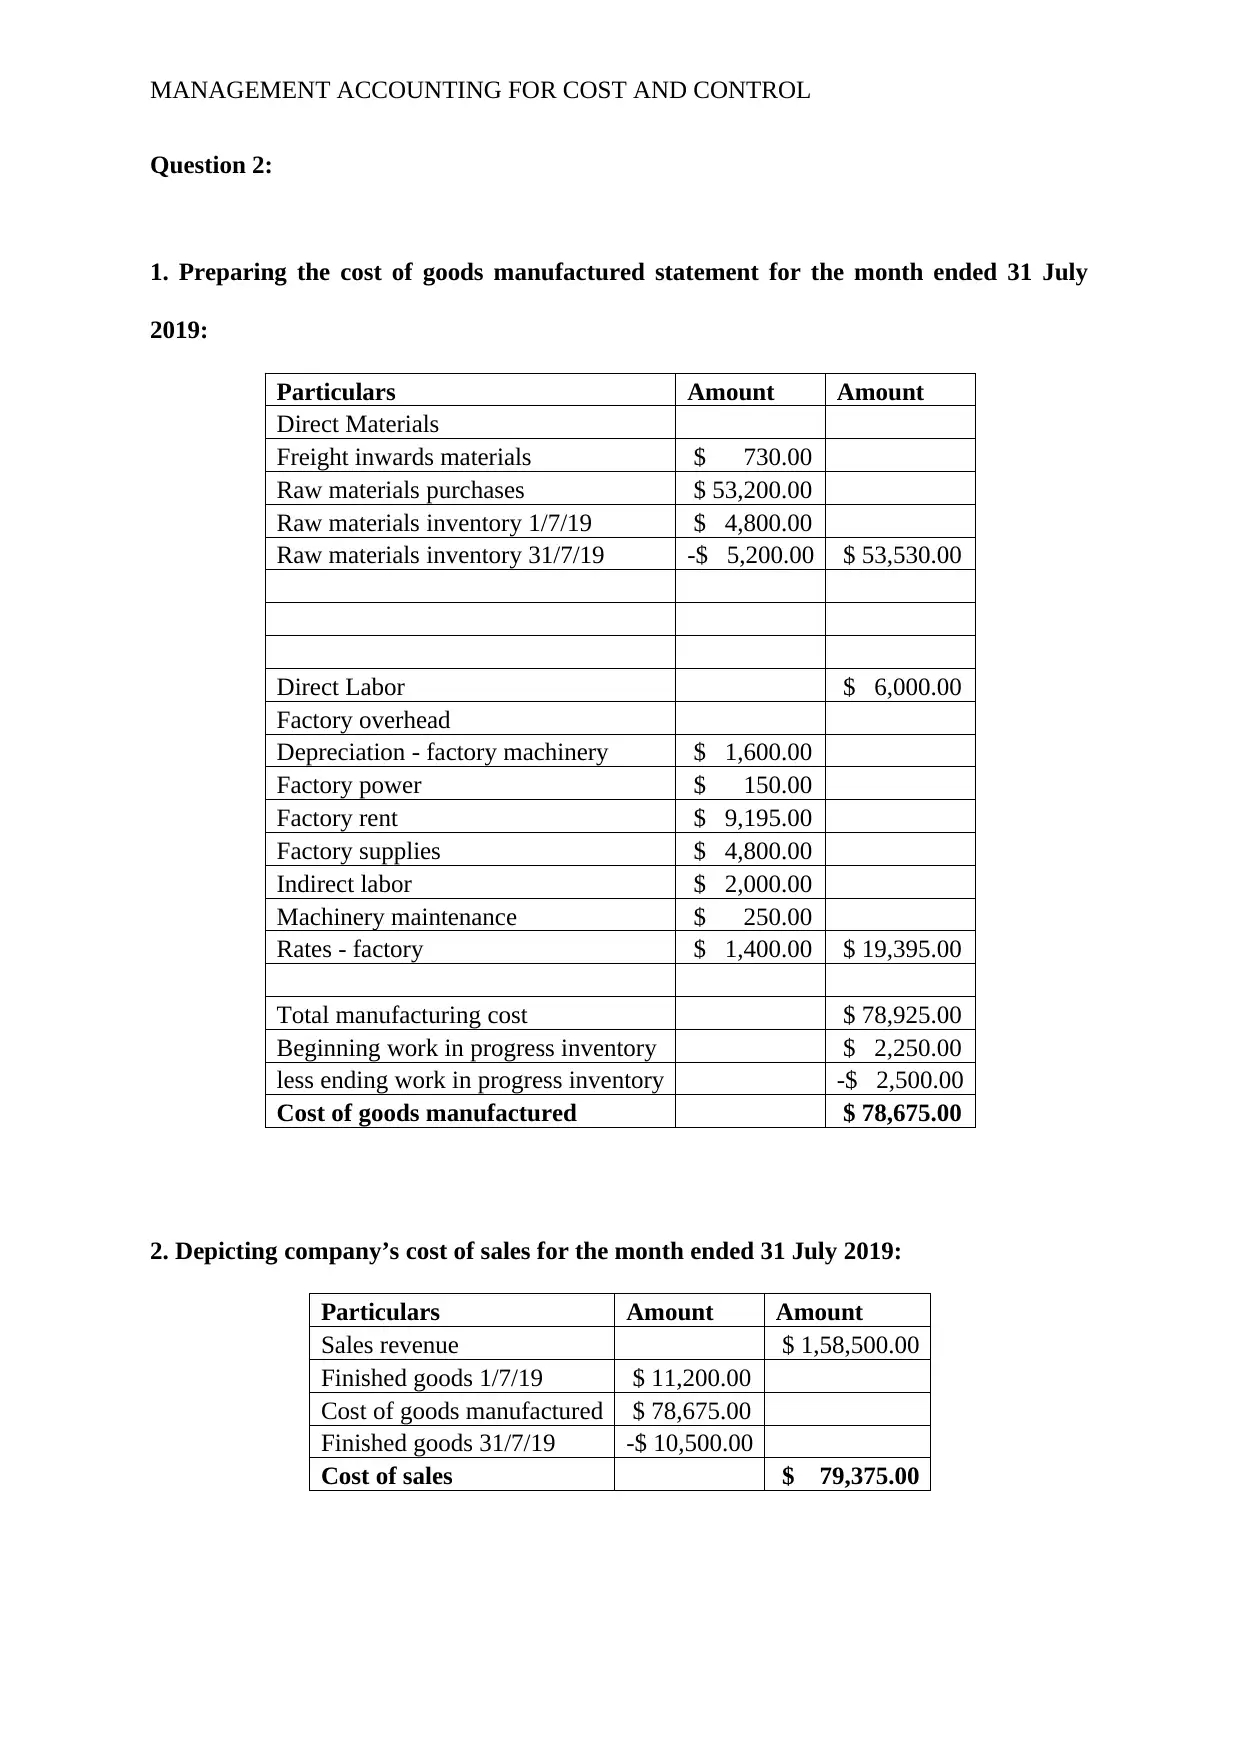
1. Preparing the cost of goods manufactured statement for the month ended 31 July
2019:
Particulars Amount Amount
Direct Materials
Freight inwards materials $ 730.00
Raw materials purchases $ 53,200.00
Raw materials inventory 1/7/19 $ 4,800.00
Raw materials inventory 31/7/19 -$ 5,200.00 $ 53,530.00
Direct Labor $ 6,000.00
Factory overhead
Depreciation - factory machinery $ 1,600.00
Factory power $ 150.00
Factory rent $ 9,195.00
Factory supplies $ 4,800.00
Indirect labor $ 2,000.00
Machinery maintenance $ 250.00
Rates - factory $ 1,400.00 $ 19,395.00
Total manufacturing cost $ 78,925.00
Beginning work in progress inventory $ 2,250.00
less ending work in progress inventory -$ 2,500.00
Cost of goods manufactured $ 78,675.00
2. Depicting company’s cost of sales for the month ended 31 July 2019:
Particulars Amount Amount
Sales revenue $ 1,58,500.00
Finished goods 1/7/19 $ 11,200.00
Cost of goods manufactured $ 78,675.00
Finished goods 31/7/19 -$ 10,500.00
Cost of sales $ 79,375.00
Question 2:
1. Preparing the cost of goods manufactured statement for the month ended 31 July
2019:
Particulars Amount Amount
Direct Materials
Freight inwards materials $ 730.00
Raw materials purchases $ 53,200.00
Raw materials inventory 1/7/19 $ 4,800.00
Raw materials inventory 31/7/19 -$ 5,200.00 $ 53,530.00
Direct Labor $ 6,000.00
Factory overhead
Depreciation - factory machinery $ 1,600.00
Factory power $ 150.00
Factory rent $ 9,195.00
Factory supplies $ 4,800.00
Indirect labor $ 2,000.00
Machinery maintenance $ 250.00
Rates - factory $ 1,400.00 $ 19,395.00
Total manufacturing cost $ 78,925.00
Beginning work in progress inventory $ 2,250.00
less ending work in progress inventory -$ 2,500.00
Cost of goods manufactured $ 78,675.00
2. Depicting company’s cost of sales for the month ended 31 July 2019:
Particulars Amount Amount
Sales revenue $ 1,58,500.00
Finished goods 1/7/19 $ 11,200.00
Cost of goods manufactured $ 78,675.00
Finished goods 31/7/19 -$ 10,500.00
Cost of sales $ 79,375.00
⊘ This is a preview!⊘
Do you want full access?
Subscribe today to unlock all pages.
Trusted by 1+ million students worldwide
MANAGEMENT ACCOUNTING FOR COST AND CONTROL
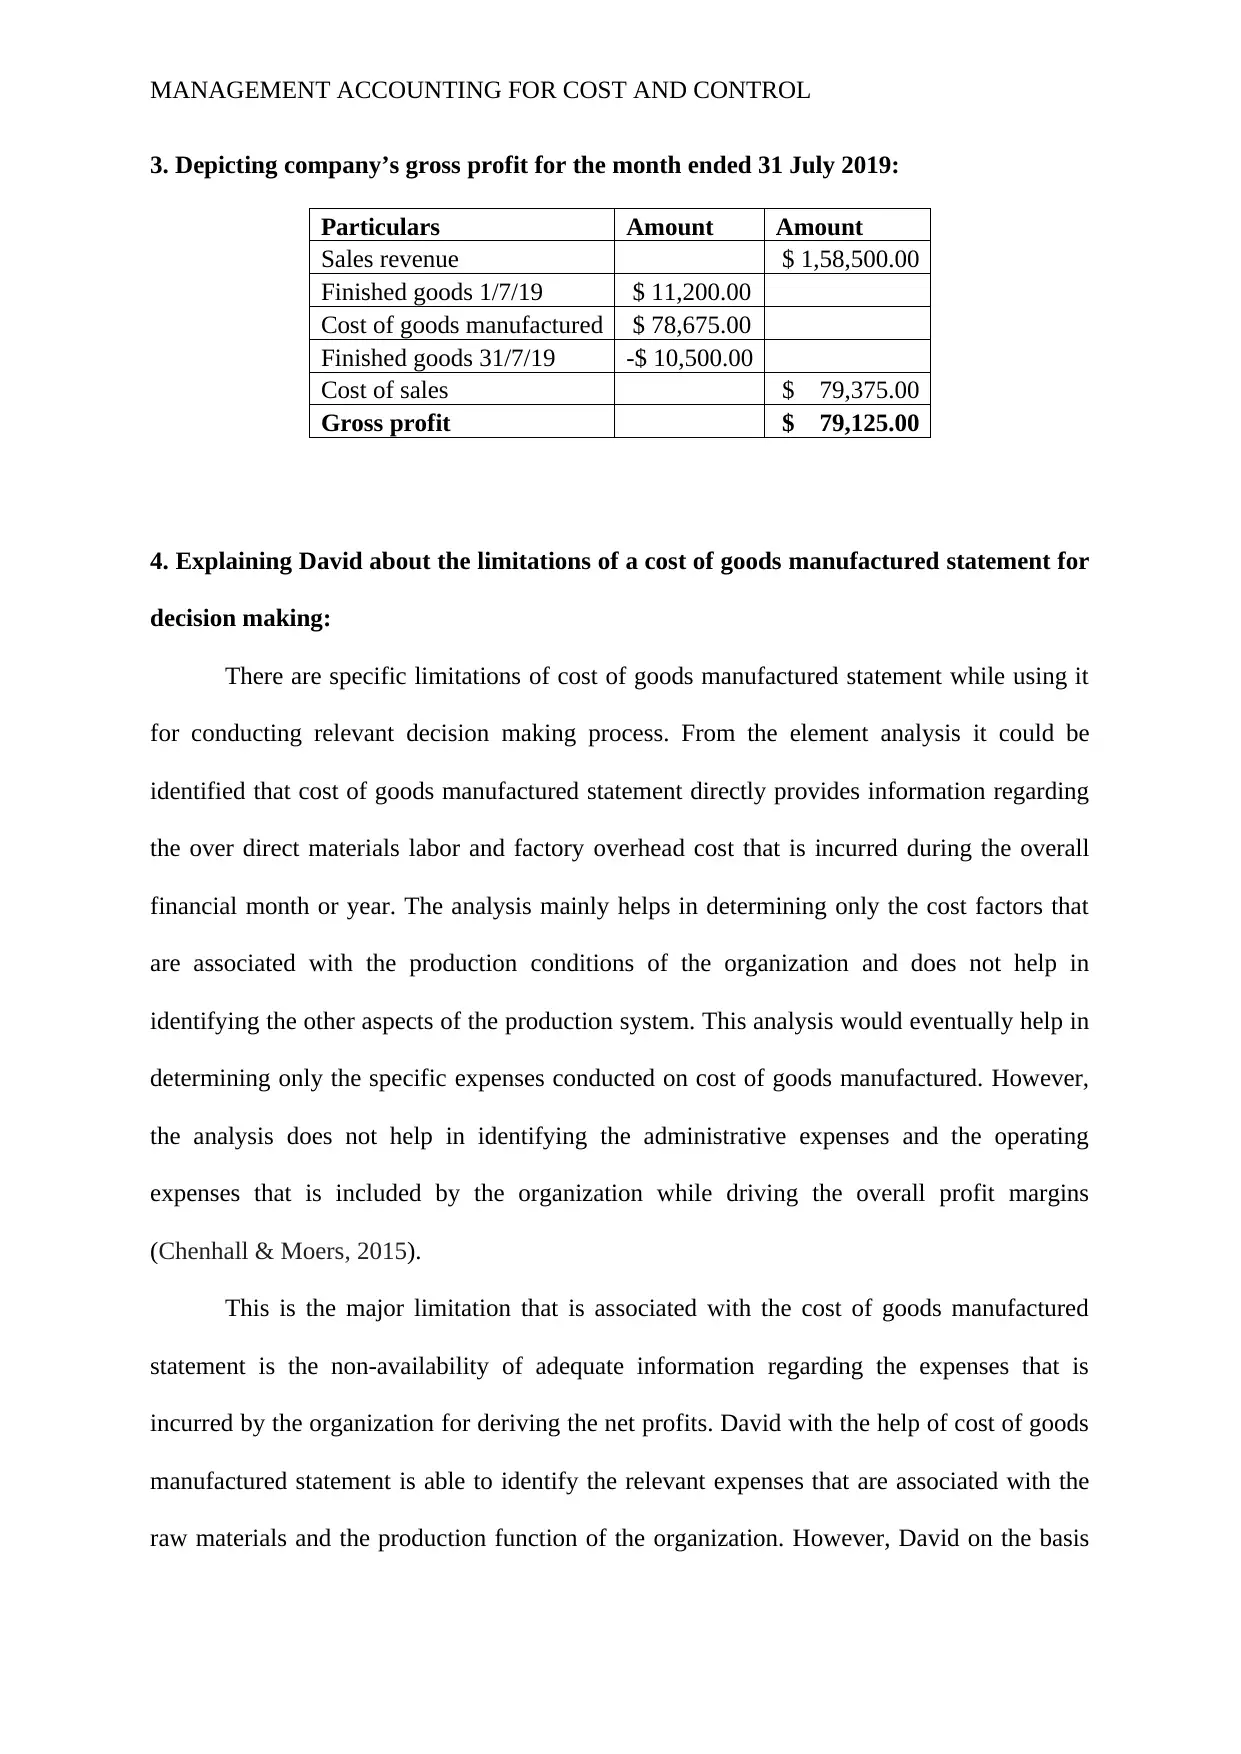
3. Depicting company’s gross profit for the month ended 31 July 2019:
Particulars Amount Amount
Sales revenue $ 1,58,500.00
Finished goods 1/7/19 $ 11,200.00
Cost of goods manufactured $ 78,675.00
Finished goods 31/7/19 -$ 10,500.00
Cost of sales $ 79,375.00
Gross profit $ 79,125.00
4. Explaining David about the limitations of a cost of goods manufactured statement for
decision making:
There are specific limitations of cost of goods manufactured statement while using it
for conducting relevant decision making process. From the element analysis it could be
identified that cost of goods manufactured statement directly provides information regarding
the over direct materials labor and factory overhead cost that is incurred during the overall
financial month or year. The analysis mainly helps in determining only the cost factors that
are associated with the production conditions of the organization and does not help in
identifying the other aspects of the production system. This analysis would eventually help in
determining only the specific expenses conducted on cost of goods manufactured. However,
the analysis does not help in identifying the administrative expenses and the operating
expenses that is included by the organization while driving the overall profit margins
(Chenhall & Moers, 2015).
This is the major limitation that is associated with the cost of goods manufactured
statement is the non-availability of adequate information regarding the expenses that is
incurred by the organization for deriving the net profits. David with the help of cost of goods
manufactured statement is able to identify the relevant expenses that are associated with the
raw materials and the production function of the organization. However, David on the basis
Paraphrase This Document
Need a fresh take? Get an instant paraphrase of this document with our AI Paraphraser
MANAGEMENT ACCOUNTING FOR COST AND CONTROL
of only cost of goods manufactured is not able to identify the relevant increment in sales in
future and make adjustments to budget for supporting future production needs. Hence, it
could be identified that with the help of cost of goods manufactured only expenses incurred
in the process can be identified, which cannot be used for the decision making process.
Furthermore, it cannot support the company to increase its profits in the long run by
addressing the continuous change in demand from customers and the price change.
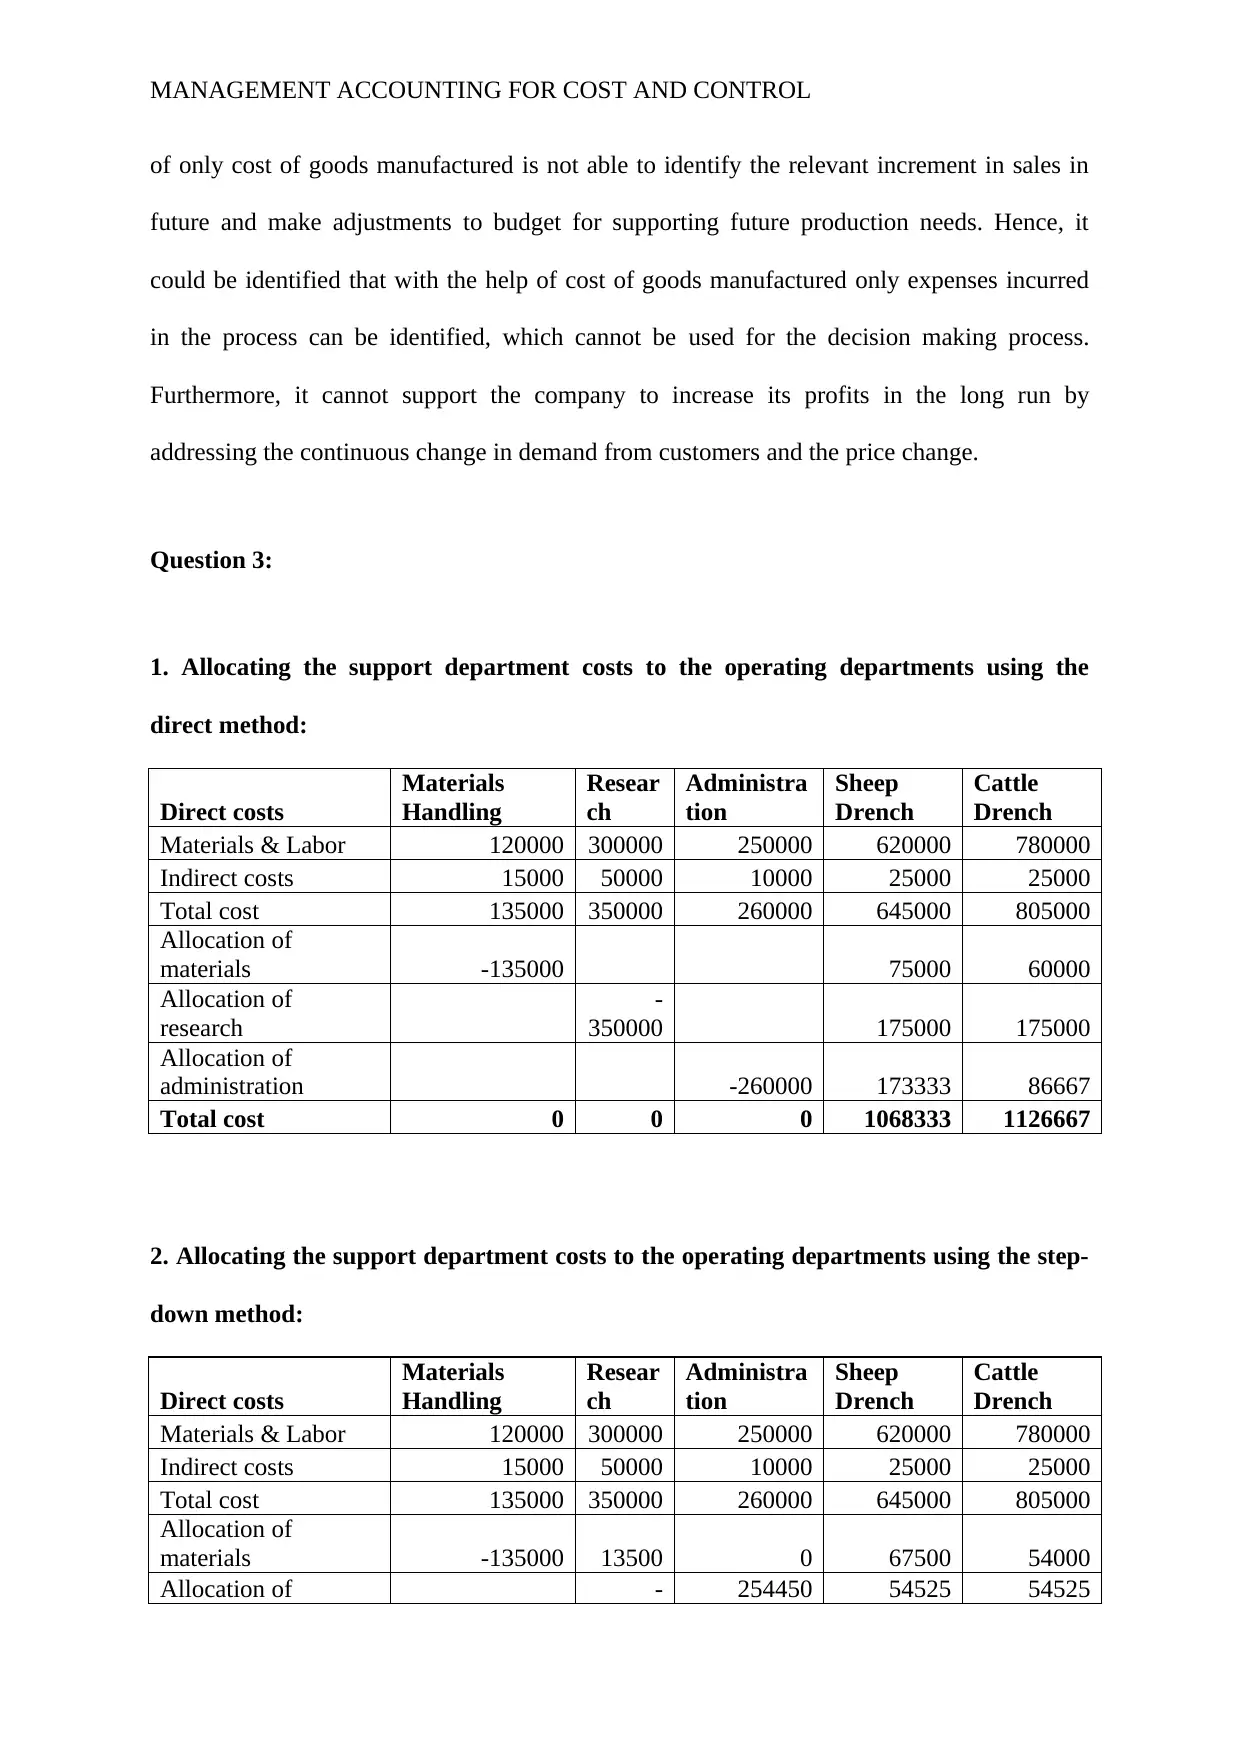
Question 3:
1. Allocating the support department costs to the operating departments using the
direct method:
Direct costs
Materials
Handling
Resear
ch
Administra
tion
Sheep
Drench
Cattle
Drench
Materials & Labor 120000 300000 250000 620000 780000
Indirect costs 15000 50000 10000 25000 25000
Total cost 135000 350000 260000 645000 805000
Allocation of
materials -135000 75000 60000
Allocation of
research
-
350000 175000 175000
Allocation of
administration -260000 173333 86667
Total cost 0 0 0 1068333 1126667
2. Allocating the support department costs to the operating departments using the step-
down method:
Direct costs
Materials
Handling
Resear
ch
Administra
tion
Sheep
Drench
Cattle
Drench
Materials & Labor 120000 300000 250000 620000 780000
Indirect costs 15000 50000 10000 25000 25000
Total cost 135000 350000 260000 645000 805000
Allocation of
materials -135000 13500 0 67500 54000
Allocation of - 254450 54525 54525
of only cost of goods manufactured is not able to identify the relevant increment in sales in
future and make adjustments to budget for supporting future production needs. Hence, it
could be identified that with the help of cost of goods manufactured only expenses incurred
in the process can be identified, which cannot be used for the decision making process.
Furthermore, it cannot support the company to increase its profits in the long run by
addressing the continuous change in demand from customers and the price change.
Question 3:
1. Allocating the support department costs to the operating departments using the
direct method:
Direct costs
Materials
Handling
Resear
ch
Administra
tion
Sheep
Drench
Cattle
Drench
Materials & Labor 120000 300000 250000 620000 780000
Indirect costs 15000 50000 10000 25000 25000
Total cost 135000 350000 260000 645000 805000
Allocation of
materials -135000 75000 60000
Allocation of
research
-
350000 175000 175000
Allocation of
administration -260000 173333 86667
Total cost 0 0 0 1068333 1126667
2. Allocating the support department costs to the operating departments using the step-
down method:
Direct costs
Materials
Handling
Resear
ch
Administra
tion
Sheep
Drench
Cattle
Drench
Materials & Labor 120000 300000 250000 620000 780000
Indirect costs 15000 50000 10000 25000 25000
Total cost 135000 350000 260000 645000 805000
Allocation of
materials -135000 13500 0 67500 54000
Allocation of - 254450 54525 54525
MANAGEMENT ACCOUNTING FOR COST AND CONTROL
research 363500
Allocation of
administration -514450 342967 171483
Total cost 0 0 0 1109992 1085008
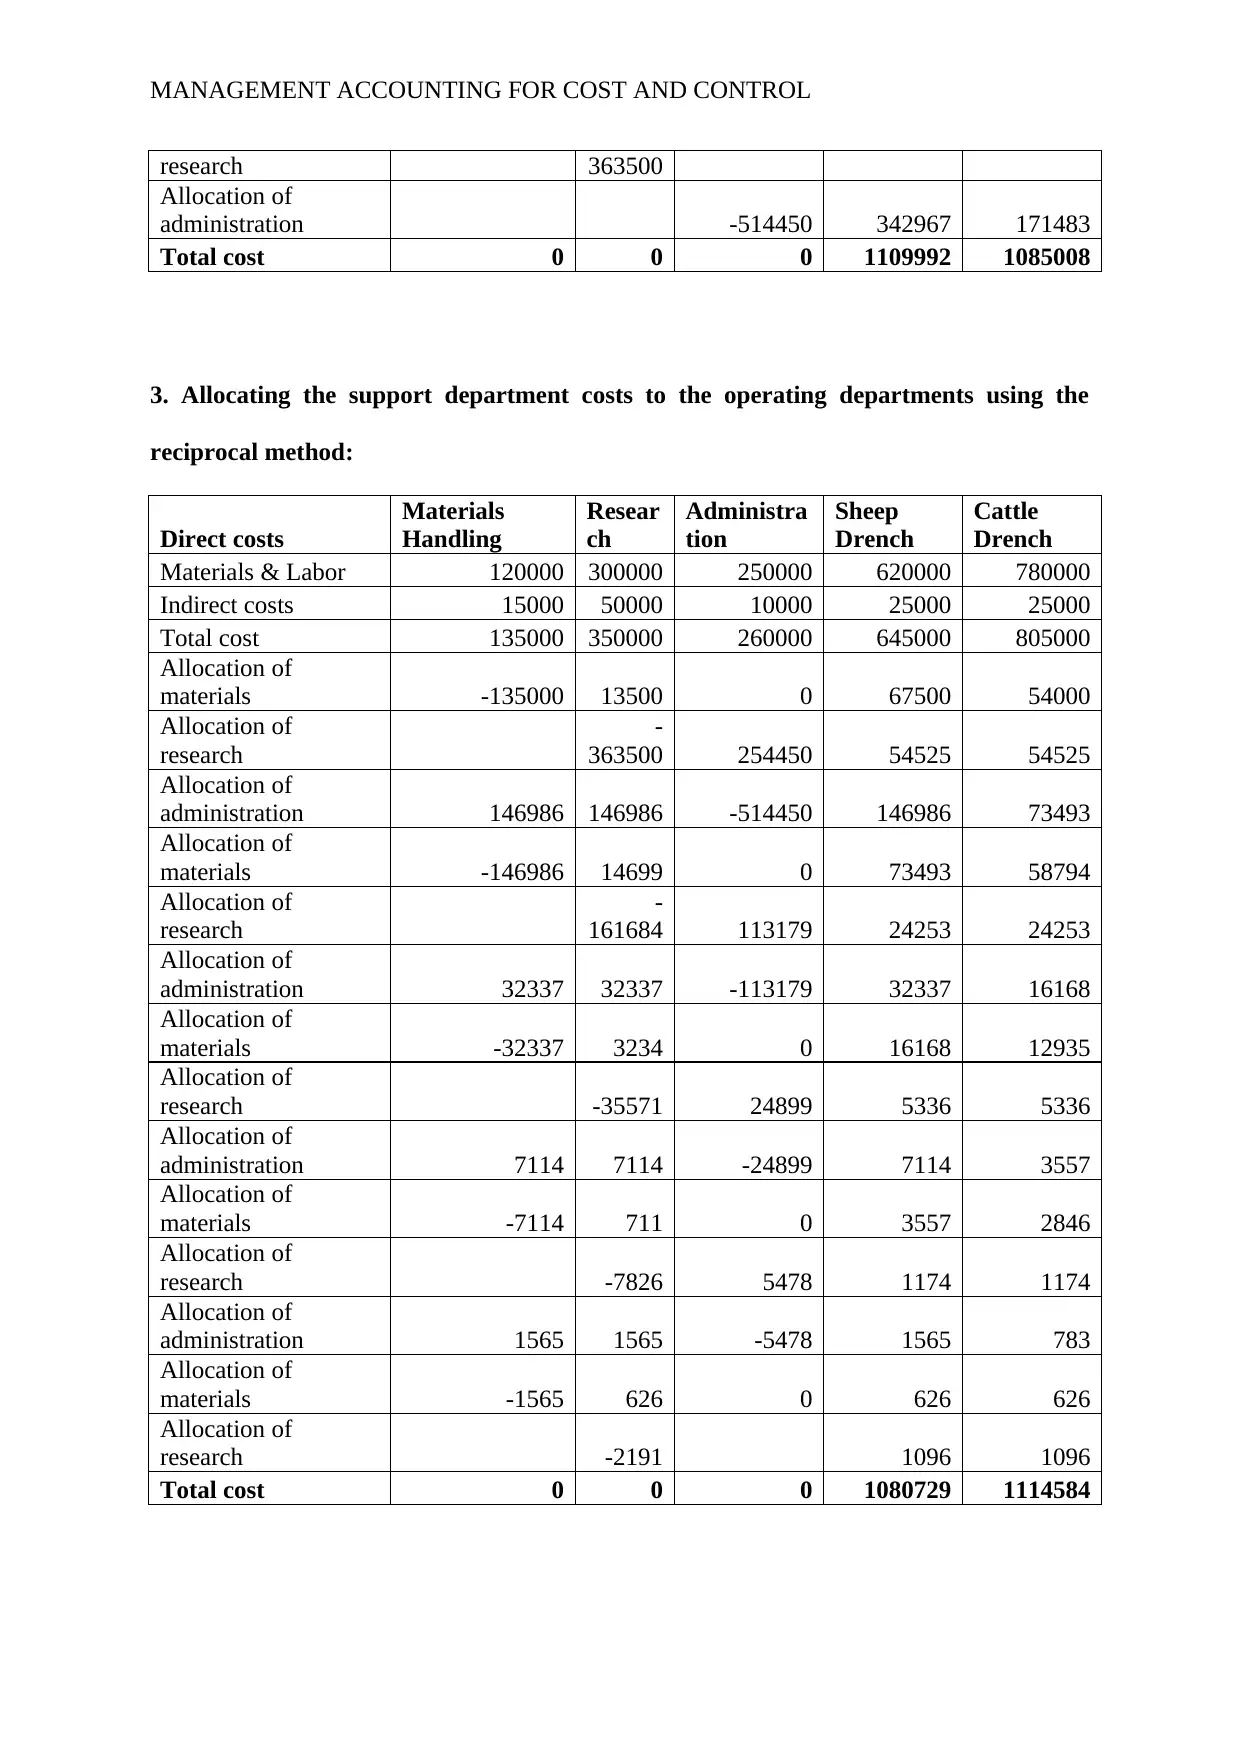
3. Allocating the support department costs to the operating departments using the
reciprocal method:
Direct costs
Materials
Handling
Resear
ch
Administra
tion
Sheep
Drench
Cattle
Drench
Materials & Labor 120000 300000 250000 620000 780000
Indirect costs 15000 50000 10000 25000 25000
Total cost 135000 350000 260000 645000 805000
Allocation of
materials -135000 13500 0 67500 54000
Allocation of
research
-
363500 254450 54525 54525
Allocation of
administration 146986 146986 -514450 146986 73493
Allocation of
materials -146986 14699 0 73493 58794
Allocation of
research
-
161684 113179 24253 24253
Allocation of
administration 32337 32337 -113179 32337 16168
Allocation of
materials -32337 3234 0 16168 12935
Allocation of
research -35571 24899 5336 5336
Allocation of
administration 7114 7114 -24899 7114 3557
Allocation of
materials -7114 711 0 3557 2846
Allocation of
research -7826 5478 1174 1174
Allocation of
administration 1565 1565 -5478 1565 783
Allocation of
materials -1565 626 0 626 626
Allocation of
research -2191 1096 1096
Total cost 0 0 0 1080729 1114584
research 363500
Allocation of
administration -514450 342967 171483
Total cost 0 0 0 1109992 1085008
3. Allocating the support department costs to the operating departments using the
reciprocal method:
Direct costs
Materials
Handling
Resear
ch
Administra
tion
Sheep
Drench
Cattle
Drench
Materials & Labor 120000 300000 250000 620000 780000
Indirect costs 15000 50000 10000 25000 25000
Total cost 135000 350000 260000 645000 805000
Allocation of
materials -135000 13500 0 67500 54000
Allocation of
research
-
363500 254450 54525 54525
Allocation of
administration 146986 146986 -514450 146986 73493
Allocation of
materials -146986 14699 0 73493 58794
Allocation of
research
-
161684 113179 24253 24253
Allocation of
administration 32337 32337 -113179 32337 16168
Allocation of
materials -32337 3234 0 16168 12935
Allocation of
research -35571 24899 5336 5336
Allocation of
administration 7114 7114 -24899 7114 3557
Allocation of
materials -7114 711 0 3557 2846
Allocation of
research -7826 5478 1174 1174
Allocation of
administration 1565 1565 -5478 1565 783
Allocation of
materials -1565 626 0 626 626
Allocation of
research -2191 1096 1096
Total cost 0 0 0 1080729 1114584
⊘ This is a preview!⊘
Do you want full access?
Subscribe today to unlock all pages.
Trusted by 1+ million students worldwide
MANAGEMENT ACCOUNTING FOR COST AND CONTROL
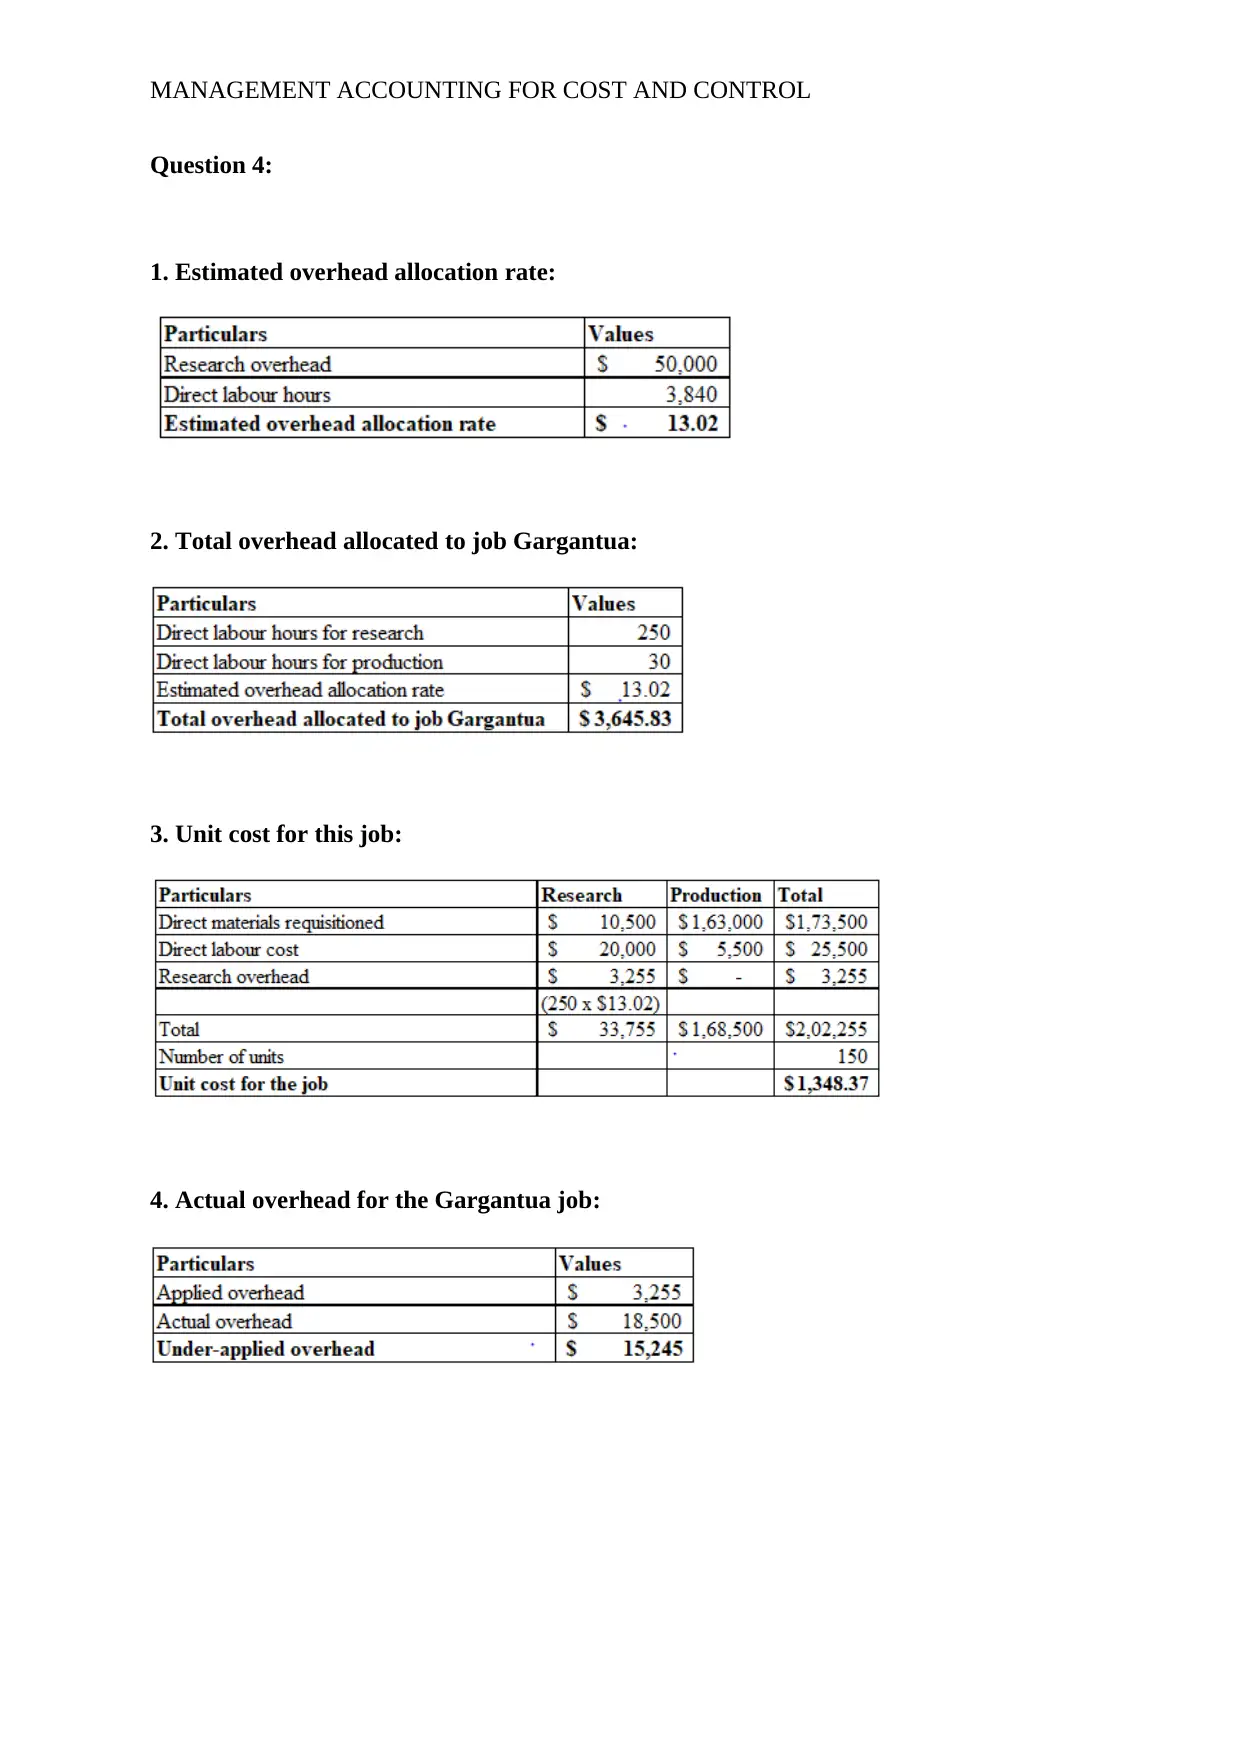
Question 4:
1. Estimated overhead allocation rate:
2. Total overhead allocated to job Gargantua:
3. Unit cost for this job:
4. Actual overhead for the Gargantua job:
Question 4:
1. Estimated overhead allocation rate:
2. Total overhead allocated to job Gargantua:
3. Unit cost for this job:
4. Actual overhead for the Gargantua job:
Paraphrase This Document
Need a fresh take? Get an instant paraphrase of this document with our AI Paraphraser
MANAGEMENT ACCOUNTING FOR COST AND CONTROL
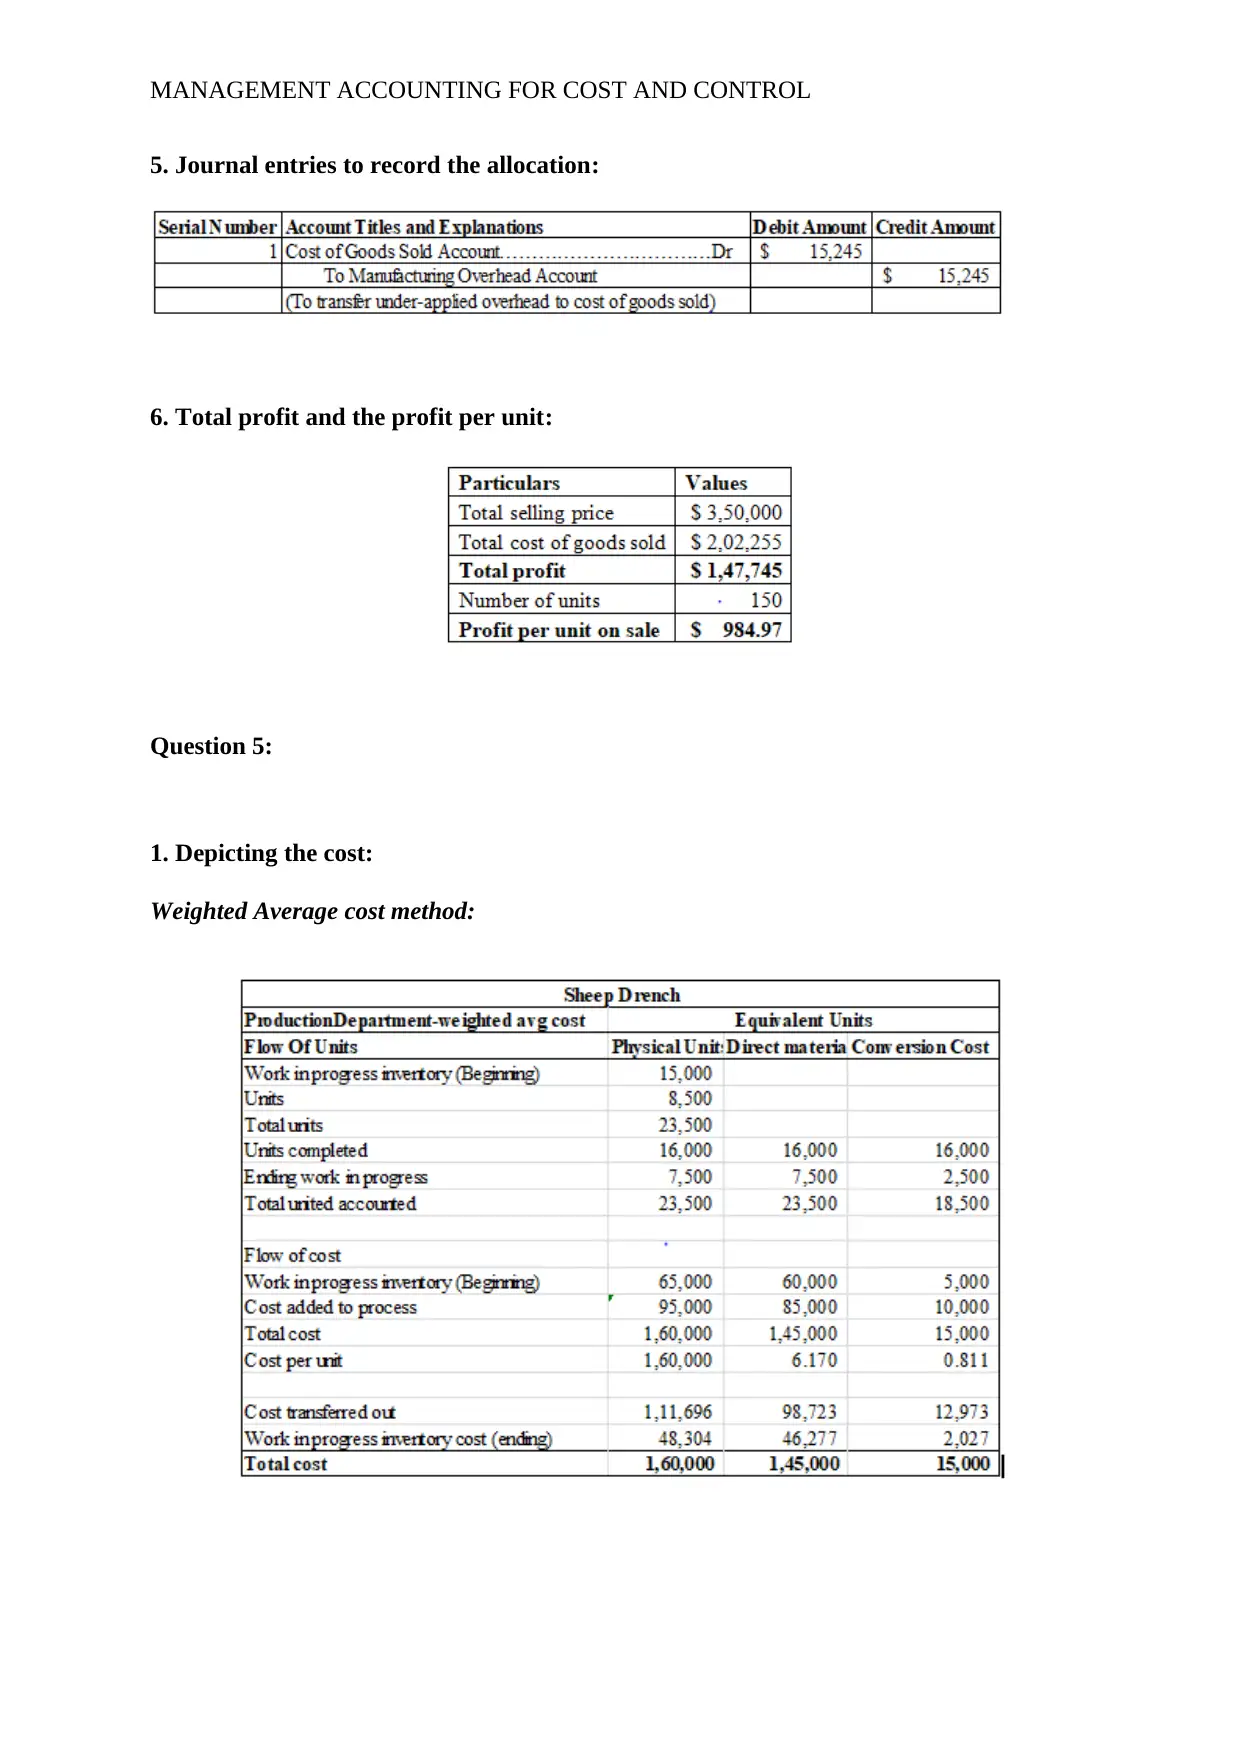
5. Journal entries to record the allocation:
6. Total profit and the profit per unit:
Question 5:
1. Depicting the cost:
Weighted Average cost method:
5. Journal entries to record the allocation:
6. Total profit and the profit per unit:
Question 5:
1. Depicting the cost:
Weighted Average cost method:
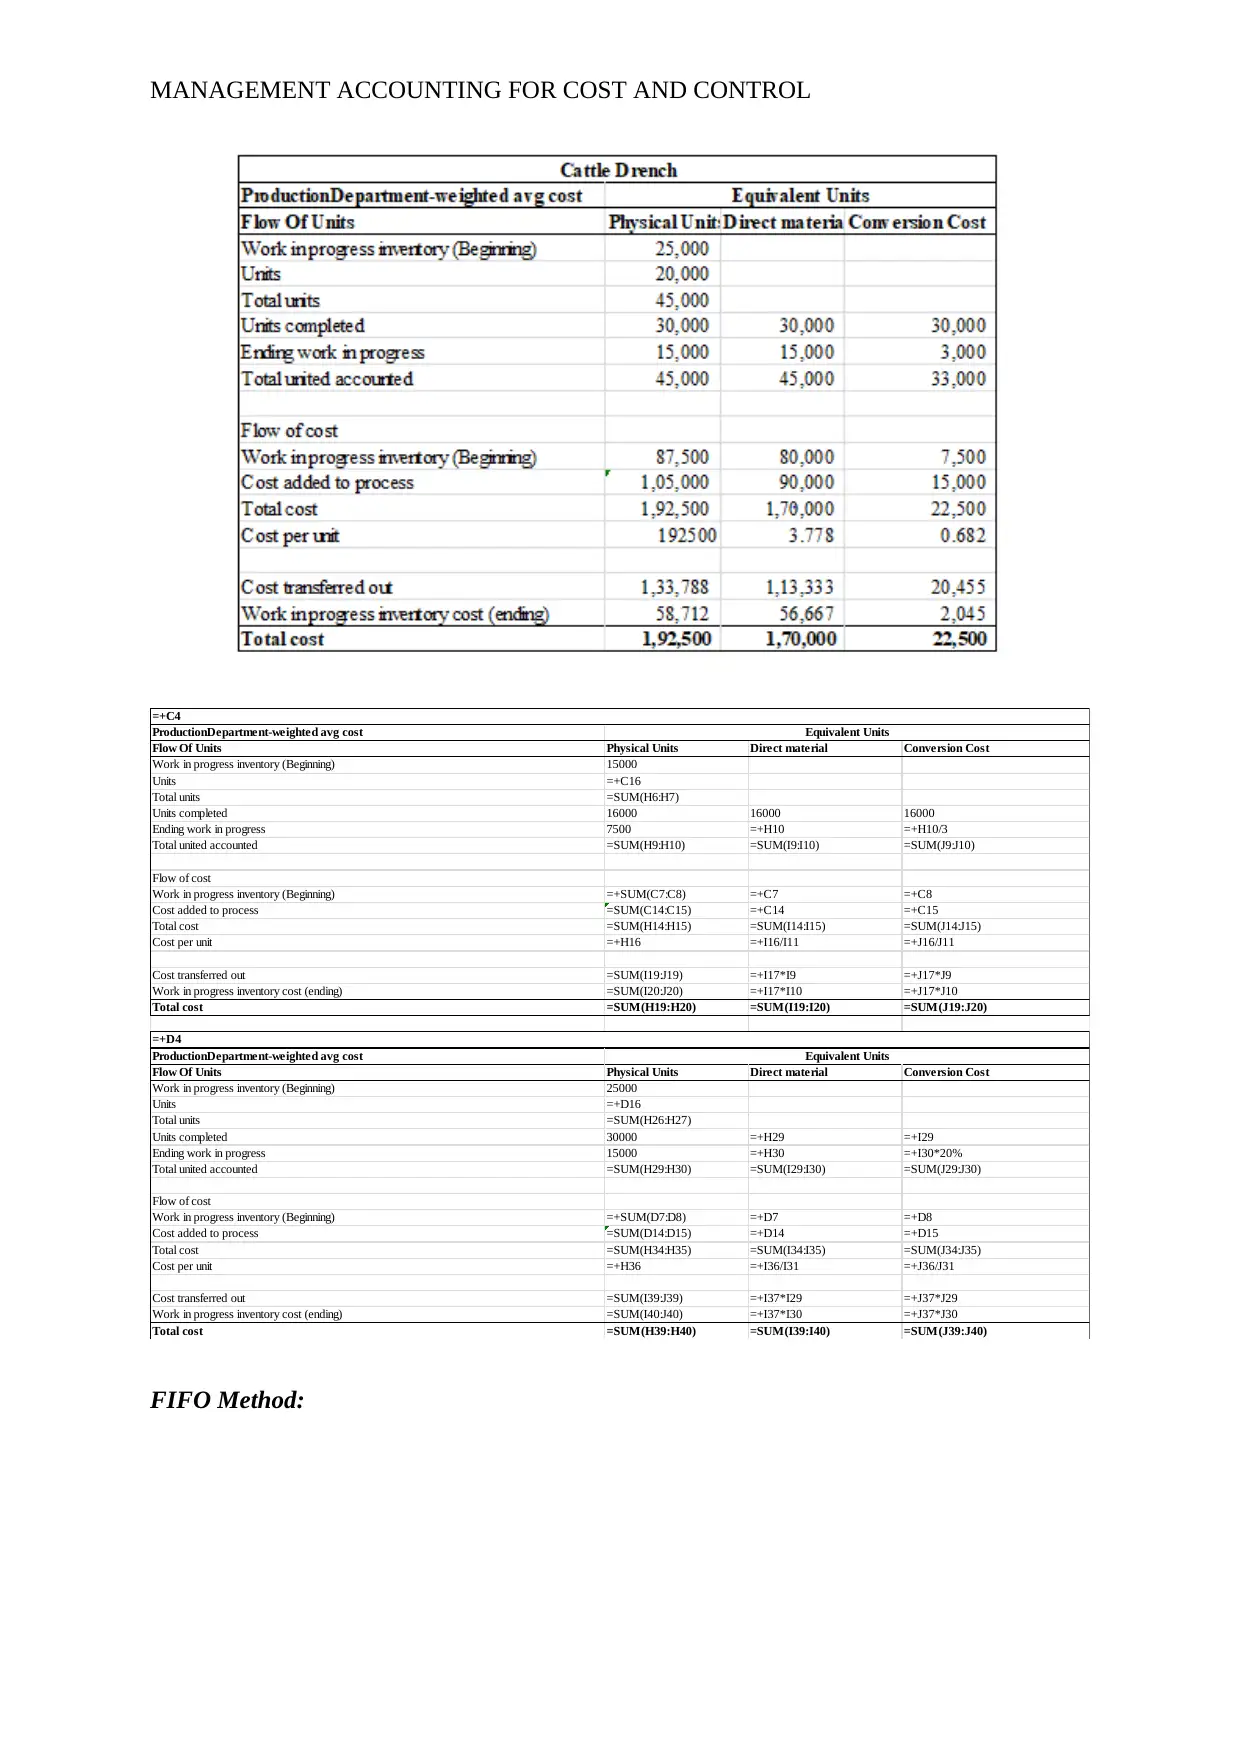
MANAGEMENT ACCOUNTING FOR COST AND CONTROL
ProductionDepartment-weighted avg cost
Flow Of Units Physical Units Direct material Conversion Cost
Work in progress inventory (Beginning) 15000
Units =+C16
Total units =SUM(H6:H7)
Units completed 16000 16000 16000
Ending work in progress 7500 =+H10 =+H10/3
Total united accounted =SUM(H9:H10) =SUM(I9:I10) =SUM(J9:J10)
Flow of cost
Work in progress inventory (Beginning) =+SUM(C7:C8) =+C7 =+C8
Cost added to process =SUM(C14:C15) =+C14 =+C15
Total cost =SUM(H14:H15) =SUM(I14:I15) =SUM(J14:J15)
Cost per unit =+H16 =+I16/I11 =+J16/J11
Cost transferred out =SUM(I19:J19) =+I17*I9 =+J17*J9
Work in progress inventory cost (ending) =SUM(I20:J20) =+I17*I10 =+J17*J10
Total cost =SUM(H19:H20) =SUM(I19:I20) =SUM(J19:J20)
ProductionDepartment-weighted avg cost
Flow Of Units Physical Units Direct material Conversion Cost
Work in progress inventory (Beginning) 25000
Units =+D16
Total units =SUM(H26:H27)
Units completed 30000 =+H29 =+I29
Ending work in progress 15000 =+H30 =+I30*20%
Total united accounted =SUM(H29:H30) =SUM(I29:I30) =SUM(J29:J30)
Flow of cost
Work in progress inventory (Beginning) =+SUM(D7:D8) =+D7 =+D8
Cost added to process =SUM(D14:D15) =+D14 =+D15
Total cost =SUM(H34:H35) =SUM(I34:I35) =SUM(J34:J35)
Cost per unit =+H36 =+I36/I31 =+J36/J31
Cost transferred out =SUM(I39:J39) =+I37*I29 =+J37*J29
Work in progress inventory cost (ending) =SUM(I40:J40) =+I37*I30 =+J37*J30
Total cost =SUM(H39:H40) =SUM(I39:I40) =SUM(J39:J40)
=+D4
Equivalent Units
=+C4
Equivalent Units
FIFO Method:
ProductionDepartment-weighted avg cost
Flow Of Units Physical Units Direct material Conversion Cost
Work in progress inventory (Beginning) 15000
Units =+C16
Total units =SUM(H6:H7)
Units completed 16000 16000 16000
Ending work in progress 7500 =+H10 =+H10/3
Total united accounted =SUM(H9:H10) =SUM(I9:I10) =SUM(J9:J10)
Flow of cost
Work in progress inventory (Beginning) =+SUM(C7:C8) =+C7 =+C8
Cost added to process =SUM(C14:C15) =+C14 =+C15
Total cost =SUM(H14:H15) =SUM(I14:I15) =SUM(J14:J15)
Cost per unit =+H16 =+I16/I11 =+J16/J11
Cost transferred out =SUM(I19:J19) =+I17*I9 =+J17*J9
Work in progress inventory cost (ending) =SUM(I20:J20) =+I17*I10 =+J17*J10
Total cost =SUM(H19:H20) =SUM(I19:I20) =SUM(J19:J20)
ProductionDepartment-weighted avg cost
Flow Of Units Physical Units Direct material Conversion Cost
Work in progress inventory (Beginning) 25000
Units =+D16
Total units =SUM(H26:H27)
Units completed 30000 =+H29 =+I29
Ending work in progress 15000 =+H30 =+I30*20%
Total united accounted =SUM(H29:H30) =SUM(I29:I30) =SUM(J29:J30)
Flow of cost
Work in progress inventory (Beginning) =+SUM(D7:D8) =+D7 =+D8
Cost added to process =SUM(D14:D15) =+D14 =+D15
Total cost =SUM(H34:H35) =SUM(I34:I35) =SUM(J34:J35)
Cost per unit =+H36 =+I36/I31 =+J36/J31
Cost transferred out =SUM(I39:J39) =+I37*I29 =+J37*J29
Work in progress inventory cost (ending) =SUM(I40:J40) =+I37*I30 =+J37*J30
Total cost =SUM(H39:H40) =SUM(I39:I40) =SUM(J39:J40)
=+D4
Equivalent Units
=+C4
Equivalent Units
FIFO Method:
⊘ This is a preview!⊘
Do you want full access?
Subscribe today to unlock all pages.
Trusted by 1+ million students worldwide
1 out of 18
Related Documents


Your All-in-One AI-Powered Toolkit for Academic Success.
+13062052269
info@desklib.com
Available 24*7 on WhatsApp / Email
![[object Object]](/_next/static/media/star-bottom.7253800d.svg)
Unlock your academic potential
Copyright © 2020–2026 A2Z Services. All Rights Reserved. Developed and managed by ZUCOL.