Cost and Performance Management in Tourism and Hospitality Industry
VerifiedAdded on 2023/06/11
|11
|2425
|449
Report
AI Summary
This report provides an analysis of cost and revenue management within the hospitality industry, focusing on cost drivers, strategic pricing, revenue management, cost control techniques, and analytical reasoning. Using the case study of 'Event Hospitality & Entertainment Limited,' the report identifies fixed and variable costs, performs a vertical analysis of the income statement, and offers recommendations for increasing sales by reducing costs. Key findings highlight the significance of housekeeping expenses and propose strategies to optimize resource allocation based on occupancy rates, ultimately aiming to improve gross margins and profitability. This document is available on Desklib, a platform offering a wide range of academic resources and study tools for students.
Running head: COST AND PERFORMANCE MANAGEMENT IN TOURISM AND
HOSPITALITY
Cost and Performance Management in Tourism and Hospitality
Name of Student:
Name of University:
Author’s Note:
HOSPITALITY
Cost and Performance Management in Tourism and Hospitality
Name of Student:
Name of University:
Author’s Note:
Paraphrase This Document
Need a fresh take? Get an instant paraphrase of this document with our AI Paraphraser
1COST AND PERFORMANCE MANAGEMENT IN TOURISM AND HOSPITALITY
Table of Contents
Introduction......................................................................................................................................2
Cost Driver and Cost Behaviour......................................................................................................2
Vertical analysis...............................................................................................................................0
Marketing proposal implementation................................................................................................0
Conclusion.......................................................................................................................................2
References........................................................................................................................................3
2COST AND PERFORMANCE MANAGEMENT IN TOURISM AND HOSPITALITY
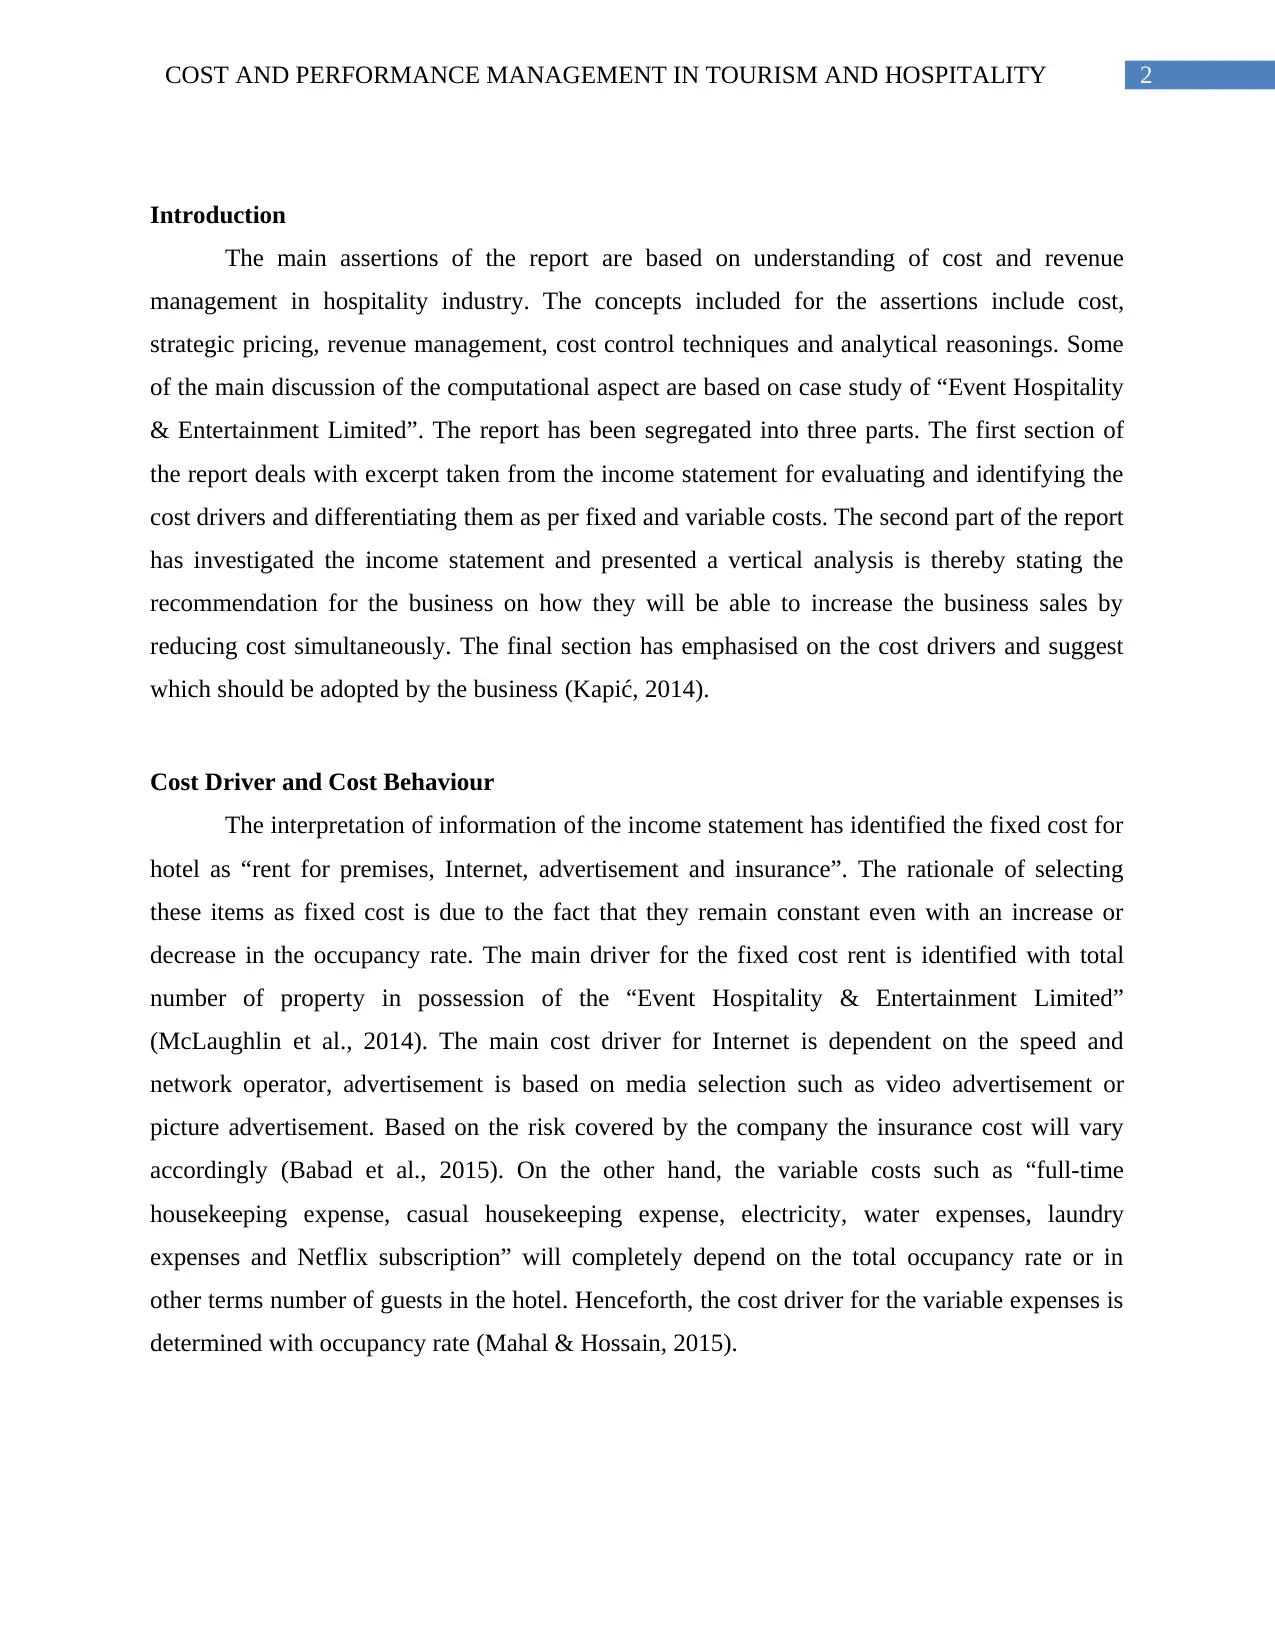
Introduction
The main assertions of the report are based on understanding of cost and revenue
management in hospitality industry. The concepts included for the assertions include cost,
strategic pricing, revenue management, cost control techniques and analytical reasonings. Some
of the main discussion of the computational aspect are based on case study of “Event Hospitality
& Entertainment Limited”. The report has been segregated into three parts. The first section of
the report deals with excerpt taken from the income statement for evaluating and identifying the
cost drivers and differentiating them as per fixed and variable costs. The second part of the report
has investigated the income statement and presented a vertical analysis is thereby stating the
recommendation for the business on how they will be able to increase the business sales by
reducing cost simultaneously. The final section has emphasised on the cost drivers and suggest
which should be adopted by the business (Kapić, 2014).
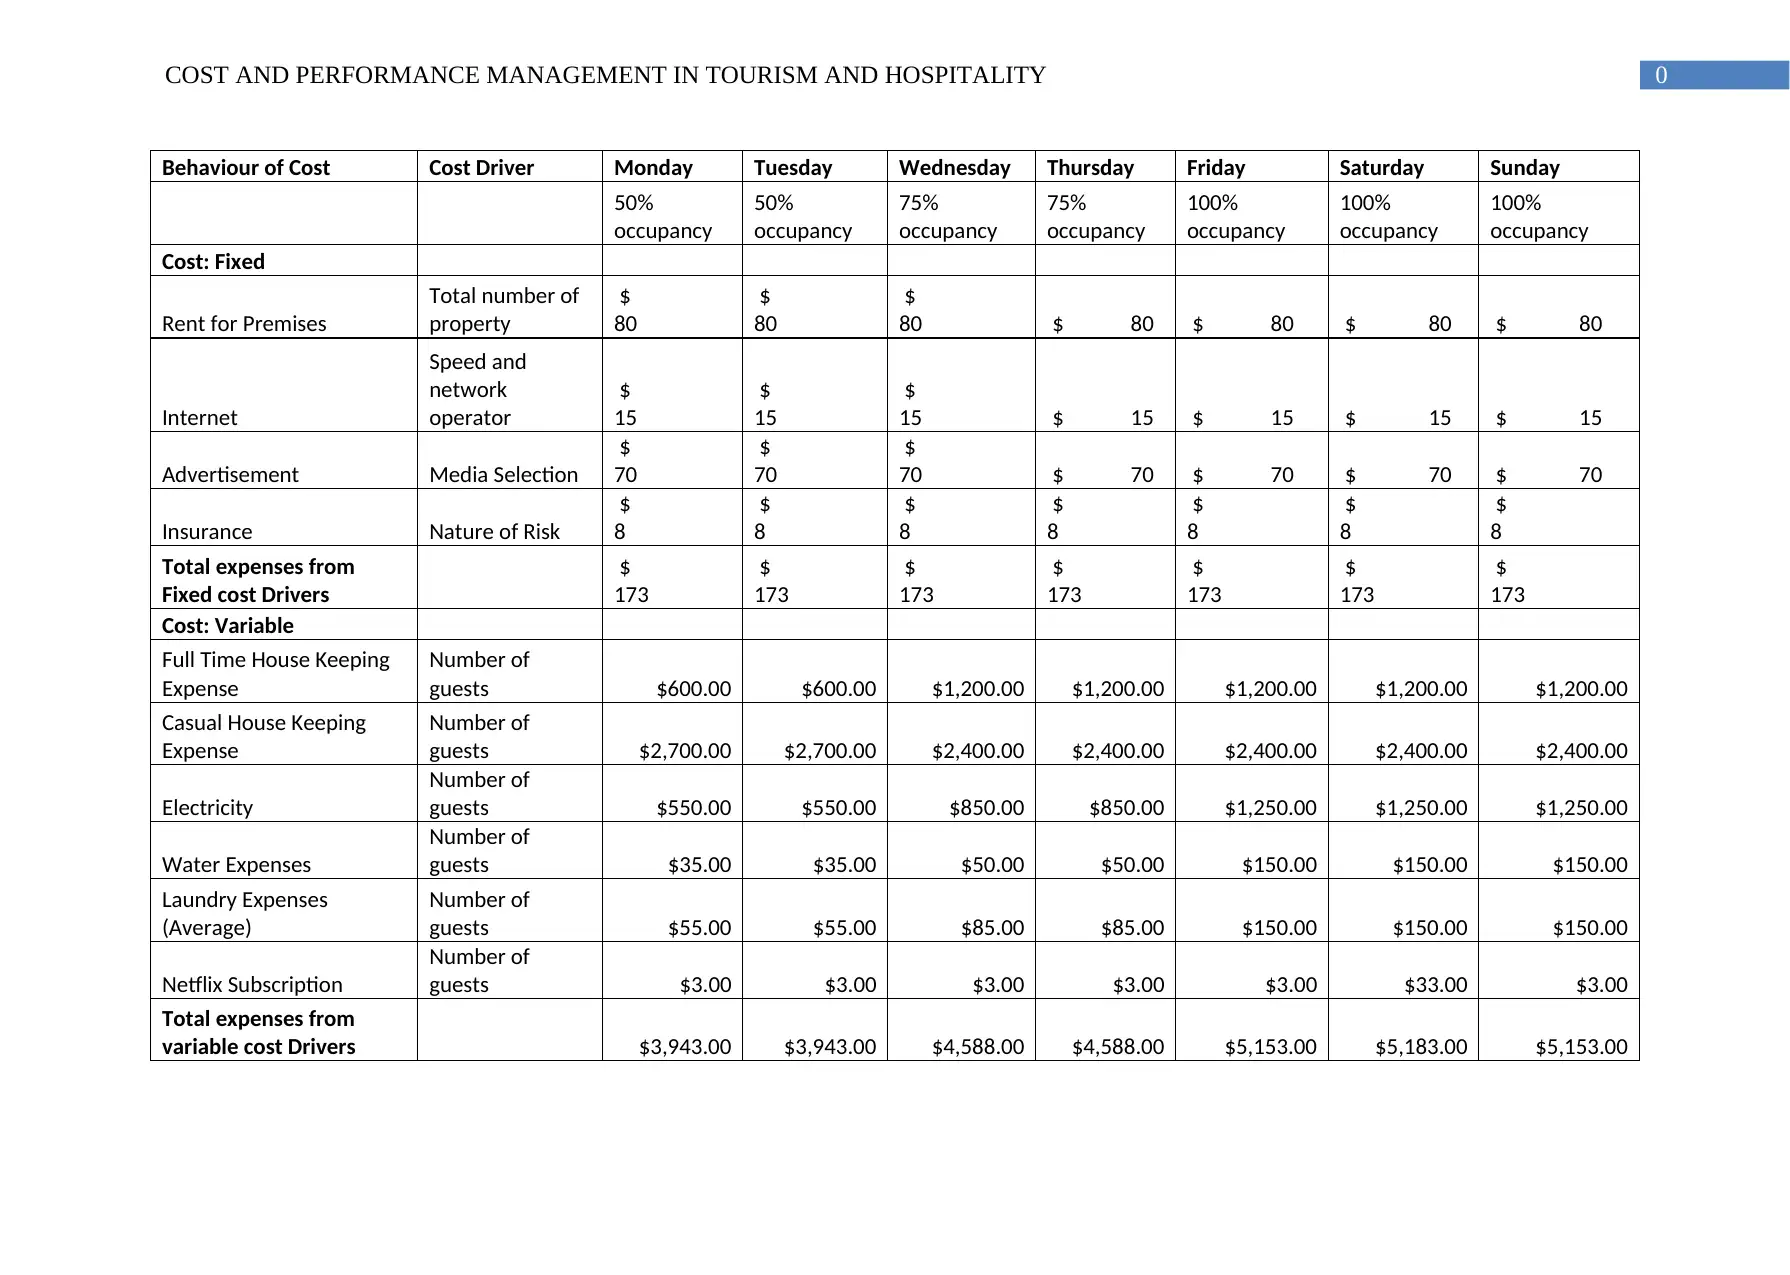
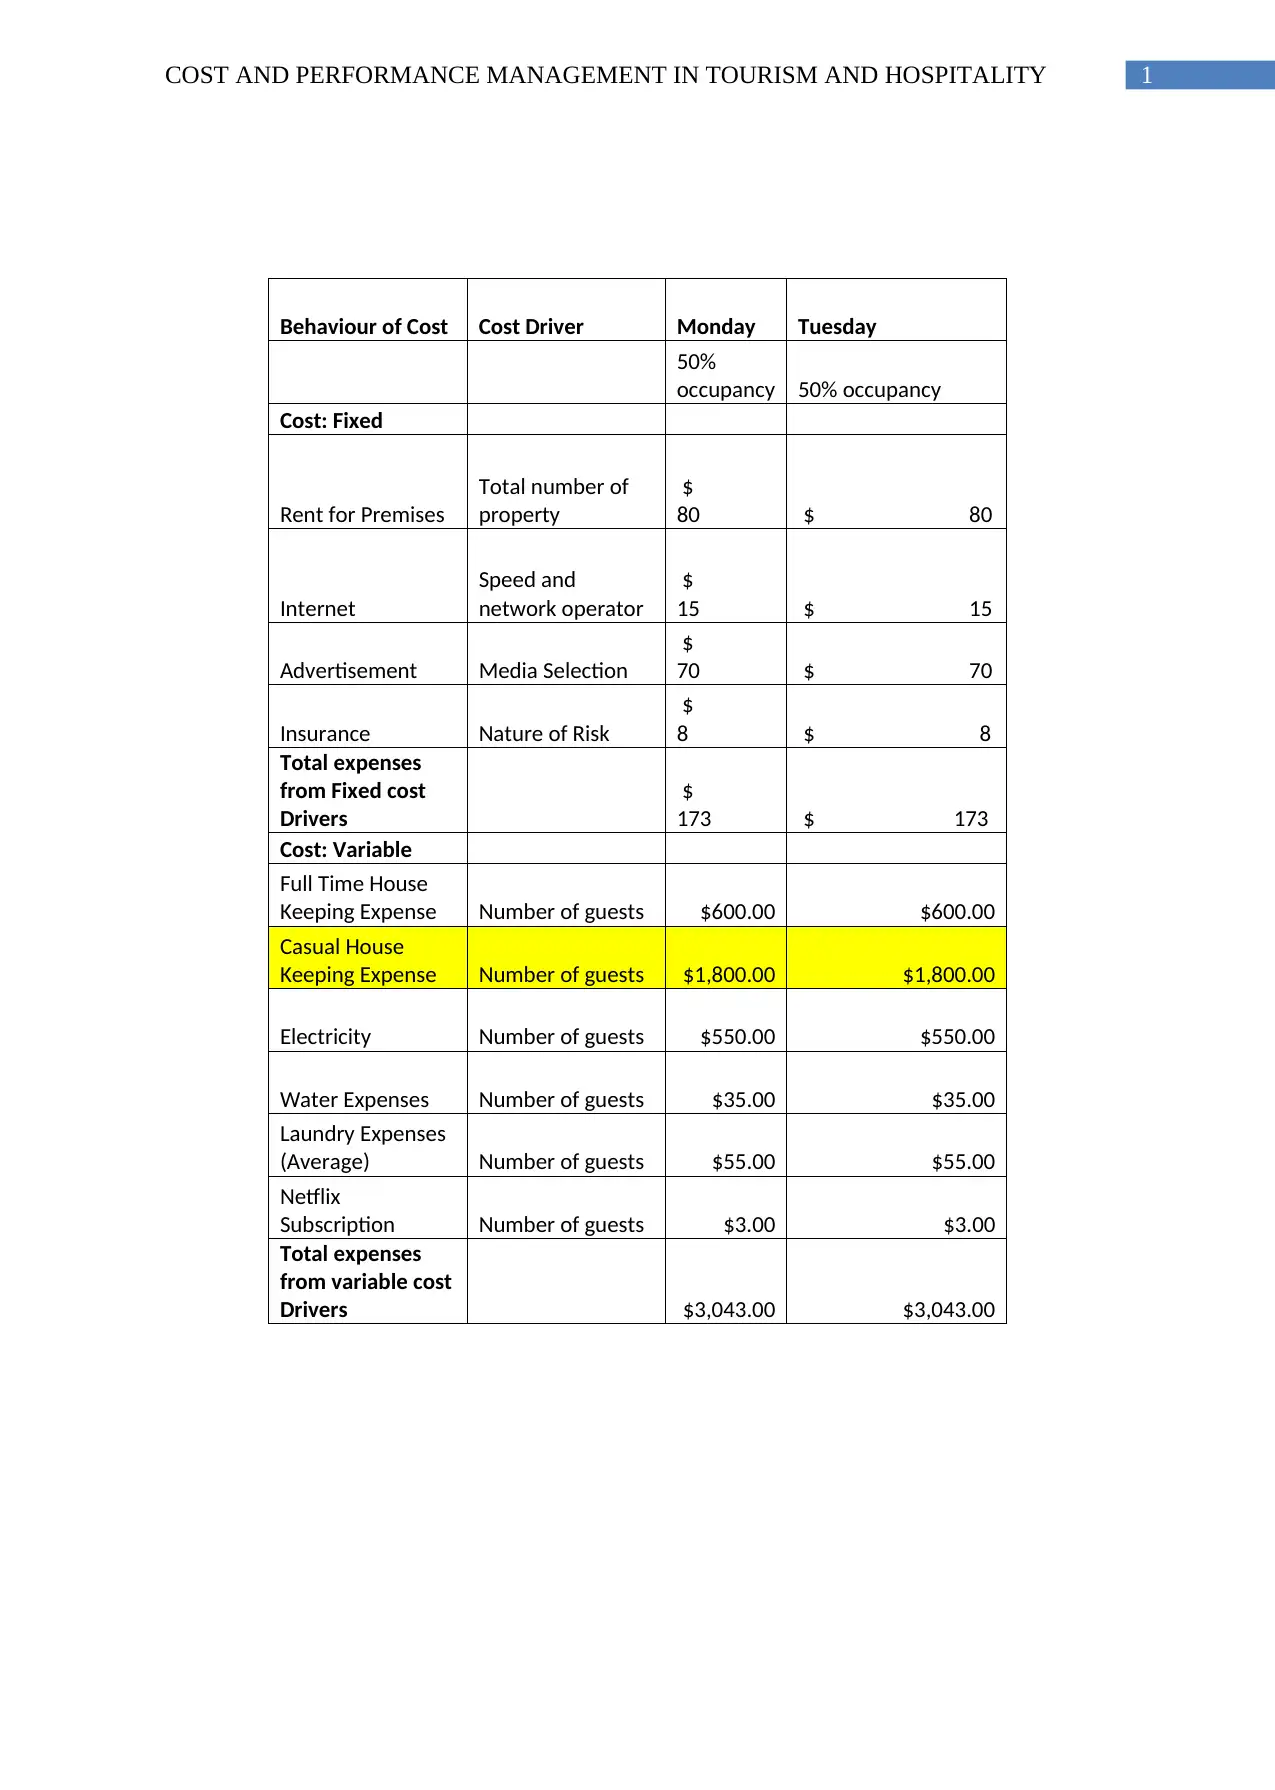
Cost Driver and Cost Behaviour
The interpretation of information of the income statement has identified the fixed cost for
hotel as “rent for premises, Internet, advertisement and insurance”. The rationale of selecting
these items as fixed cost is due to the fact that they remain constant even with an increase or
decrease in the occupancy rate. The main driver for the fixed cost rent is identified with total
number of property in possession of the “Event Hospitality & Entertainment Limited”
(McLaughlin et al., 2014). The main cost driver for Internet is dependent on the speed and
network operator, advertisement is based on media selection such as video advertisement or
picture advertisement. Based on the risk covered by the company the insurance cost will vary
accordingly (Babad et al., 2015). On the other hand, the variable costs such as “full-time
housekeeping expense, casual housekeeping expense, electricity, water expenses, laundry
expenses and Netflix subscription” will completely depend on the total occupancy rate or in
other terms number of guests in the hotel. Henceforth, the cost driver for the variable expenses is
determined with occupancy rate (Mahal & Hossain, 2015).
Introduction
The main assertions of the report are based on understanding of cost and revenue
management in hospitality industry. The concepts included for the assertions include cost,
strategic pricing, revenue management, cost control techniques and analytical reasonings. Some
of the main discussion of the computational aspect are based on case study of “Event Hospitality
& Entertainment Limited”. The report has been segregated into three parts. The first section of
the report deals with excerpt taken from the income statement for evaluating and identifying the
cost drivers and differentiating them as per fixed and variable costs. The second part of the report
has investigated the income statement and presented a vertical analysis is thereby stating the
recommendation for the business on how they will be able to increase the business sales by
reducing cost simultaneously. The final section has emphasised on the cost drivers and suggest
which should be adopted by the business (Kapić, 2014).
Cost Driver and Cost Behaviour
The interpretation of information of the income statement has identified the fixed cost for
hotel as “rent for premises, Internet, advertisement and insurance”. The rationale of selecting
these items as fixed cost is due to the fact that they remain constant even with an increase or
decrease in the occupancy rate. The main driver for the fixed cost rent is identified with total
number of property in possession of the “Event Hospitality & Entertainment Limited”
(McLaughlin et al., 2014). The main cost driver for Internet is dependent on the speed and
network operator, advertisement is based on media selection such as video advertisement or
picture advertisement. Based on the risk covered by the company the insurance cost will vary
accordingly (Babad et al., 2015). On the other hand, the variable costs such as “full-time
housekeeping expense, casual housekeeping expense, electricity, water expenses, laundry
expenses and Netflix subscription” will completely depend on the total occupancy rate or in
other terms number of guests in the hotel. Henceforth, the cost driver for the variable expenses is
determined with occupancy rate (Mahal & Hossain, 2015).
⊘ This is a preview!⊘
Do you want full access?
Subscribe today to unlock all pages.
Trusted by 1+ million students worldwide
0COST AND PERFORMANCE MANAGEMENT IN TOURISM AND HOSPITALITY
Behaviour of Cost Cost Driver Monday Tuesday Wednesday Thursday Friday Saturday Sunday
50%
occupancy
50%
occupancy
75%
occupancy
75%
occupancy
100%
occupancy
100%
occupancy
100%
occupancy
Cost: Fixed
Rent for Premises
Total number of
property
$
80
$
80
$
80 $ 80 $ 80 $ 80 $ 80
Internet
Speed and
network
operator
$
15
$
15
$
15 $ 15 $ 15 $ 15 $ 15
Advertisement Media Selection
$
70
$
70
$
70 $ 70 $ 70 $ 70 $ 70
Insurance Nature of Risk
$
8
$
8
$
8
$
8
$
8
$
8
$
8
Total expenses from
Fixed cost Drivers
$
173
$
173
$
173
$
173
$
173
$
173
$
173
Cost: Variable
Full Time House Keeping
Expense
Number of
guests $600.00 $600.00 $1,200.00 $1,200.00 $1,200.00 $1,200.00 $1,200.00
Casual House Keeping
Expense
Number of
guests $2,700.00 $2,700.00 $2,400.00 $2,400.00 $2,400.00 $2,400.00 $2,400.00
Electricity
Number of
guests $550.00 $550.00 $850.00 $850.00 $1,250.00 $1,250.00 $1,250.00
Water Expenses
Number of
guests $35.00 $35.00 $50.00 $50.00 $150.00 $150.00 $150.00
Laundry Expenses
(Average)
Number of
guests $55.00 $55.00 $85.00 $85.00 $150.00 $150.00 $150.00
Netflix Subscription
Number of
guests $3.00 $3.00 $3.00 $3.00 $3.00 $33.00 $3.00
Total expenses from
variable cost Drivers $3,943.00 $3,943.00 $4,588.00 $4,588.00 $5,153.00 $5,183.00 $5,153.00
Paraphrase This Document
Need a fresh take? Get an instant paraphrase of this document with our AI Paraphraser
0COST AND PERFORMANCE MANAGEMENT IN TOURISM AND HOSPITALITY
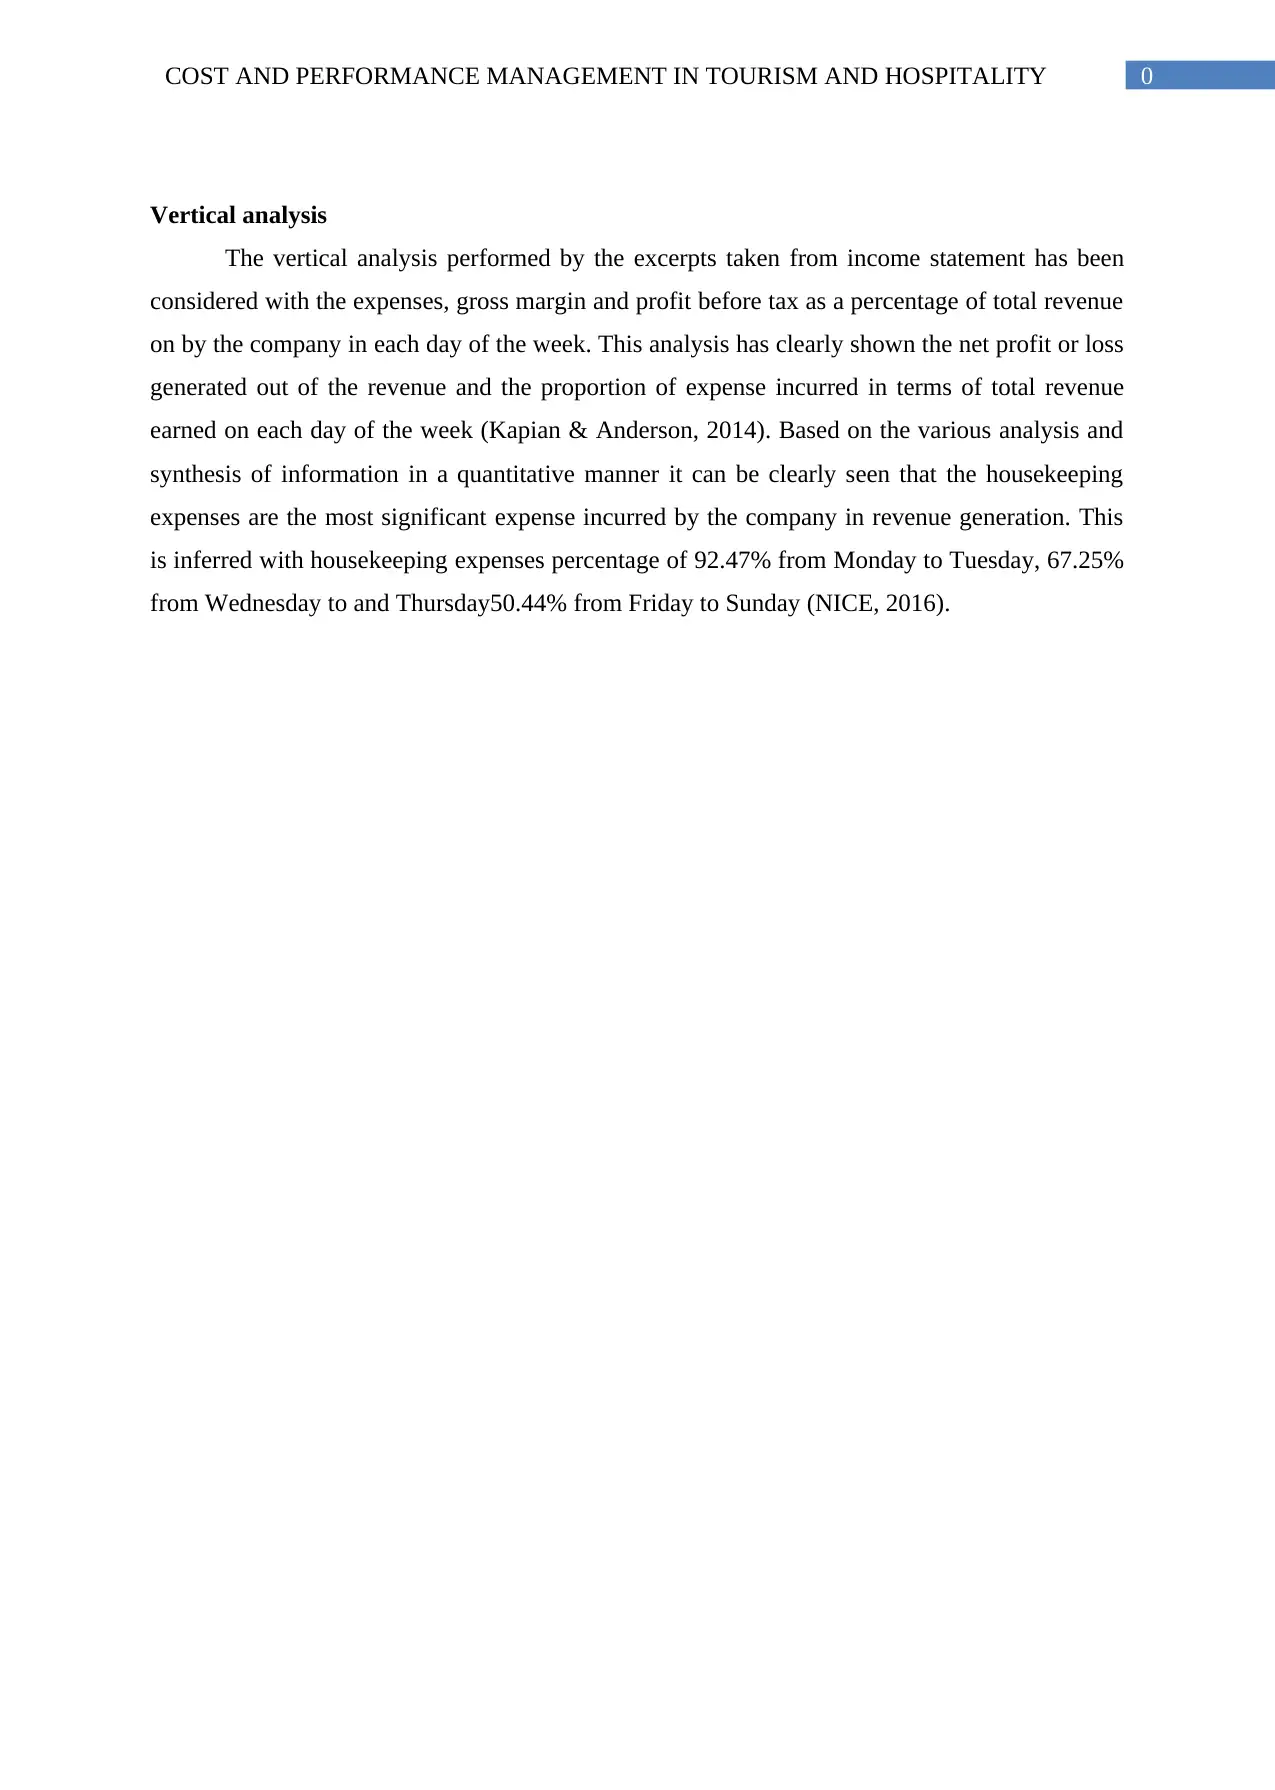
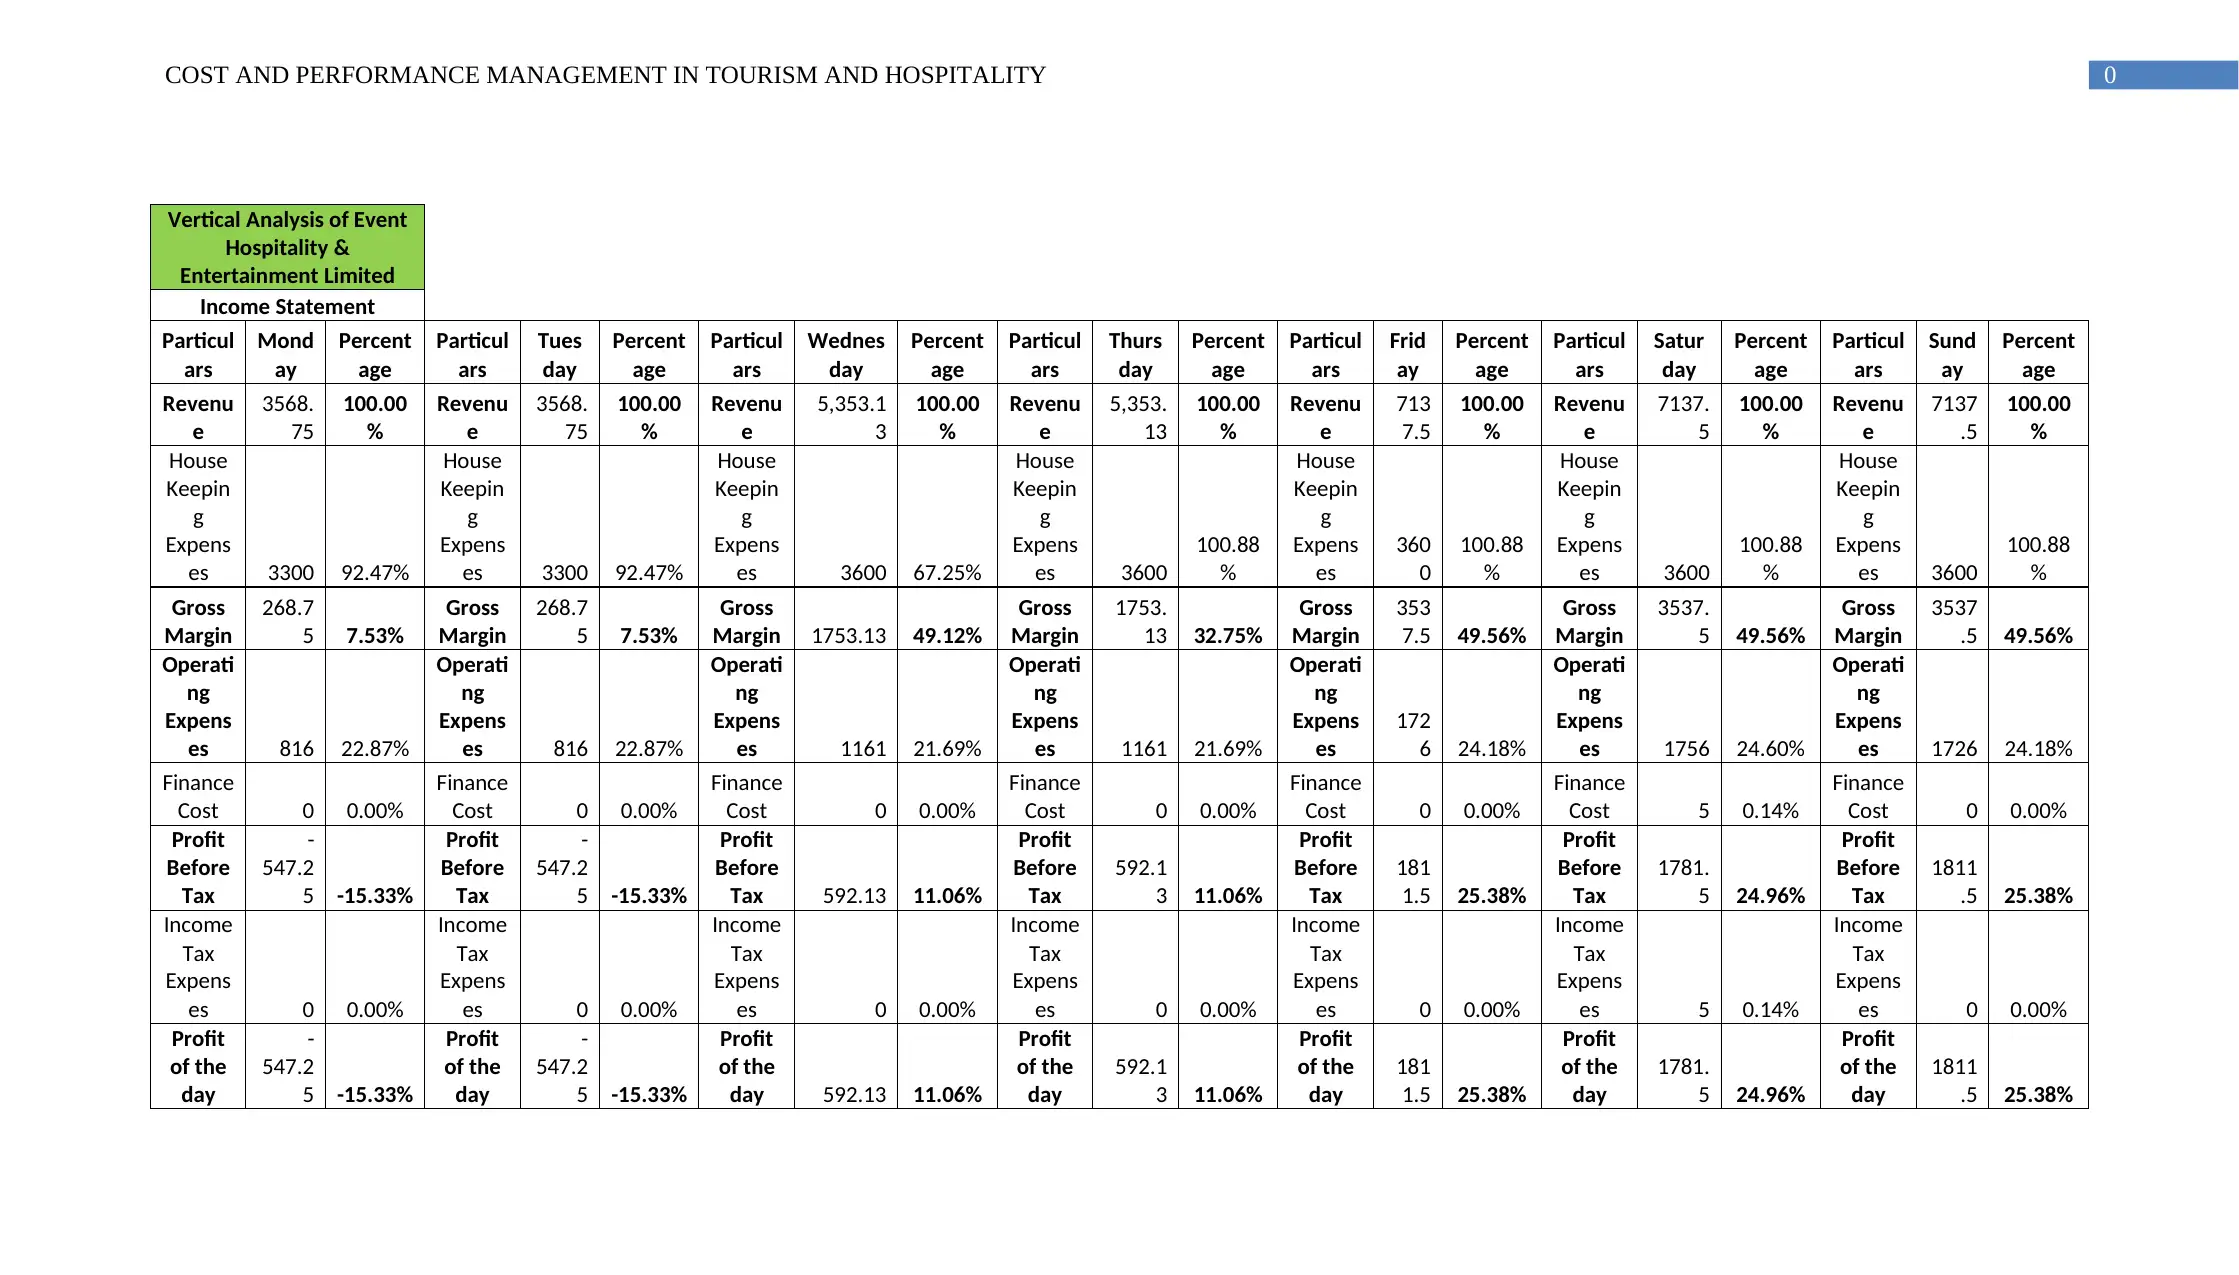
Vertical analysis
The vertical analysis performed by the excerpts taken from income statement has been
considered with the expenses, gross margin and profit before tax as a percentage of total revenue
on by the company in each day of the week. This analysis has clearly shown the net profit or loss
generated out of the revenue and the proportion of expense incurred in terms of total revenue
earned on each day of the week (Kapian & Anderson, 2014). Based on the various analysis and
synthesis of information in a quantitative manner it can be clearly seen that the housekeeping
expenses are the most significant expense incurred by the company in revenue generation. This
is inferred with housekeeping expenses percentage of 92.47% from Monday to Tuesday, 67.25%
from Wednesday to and Thursday50.44% from Friday to Sunday (NICE, 2016).
0COST AND PERFORMANCE MANAGEMENT IN TOURISM AND HOSPITALITY
Vertical Analysis of Event
Hospitality &
Entertainment Limited
Income Statement
Particul
ars
Mond
ay
Percent
age
Particul
ars
Tues
day
Percent
age
Particul
ars
Wednes
day
Percent
age
Particul
ars
Thurs
day
Percent
age
Particul
ars
Frid
ay
Percent
age
Particul
ars
Satur
day
Percent
age
Particul
ars
Sund
ay
Percent
age
Revenu
e
3568.
75
100.00
%
Revenu
e
3568.
75
100.00
%
Revenu
e
5,353.1
3
100.00
%
Revenu
e
5,353.
13
100.00
%
Revenu
e
713
7.5
100.00
%
Revenu
e
7137.
5
100.00
%
Revenu
e
7137
.5
100.00
%
House
Keepin
g
Expens
es 3300 92.47%
House
Keepin
g
Expens
es 3300 92.47%
House
Keepin
g
Expens
es 3600 67.25%
House
Keepin
g
Expens
es 3600
100.88
%
House
Keepin
g
Expens
es
360
0
100.88
%
House
Keepin
g
Expens
es 3600
100.88
%
House
Keepin
g
Expens
es 3600
100.88
%
Gross
Margin
268.7
5 7.53%
Gross
Margin
268.7
5 7.53%
Gross
Margin 1753.13 49.12%
Gross
Margin
1753.
13 32.75%
Gross
Margin
353
7.5 49.56%
Gross
Margin
3537.
5 49.56%
Gross
Margin
3537
.5 49.56%
Operati
ng
Expens
es 816 22.87%
Operati
ng
Expens
es 816 22.87%
Operati
ng
Expens
es 1161 21.69%
Operati
ng
Expens
es 1161 21.69%
Operati
ng
Expens
es
172
6 24.18%
Operati
ng
Expens
es 1756 24.60%
Operati
ng
Expens
es 1726 24.18%
Finance
Cost 0 0.00%
Finance
Cost 0 0.00%
Finance
Cost 0 0.00%
Finance
Cost 0 0.00%
Finance
Cost 0 0.00%
Finance
Cost 5 0.14%
Finance
Cost 0 0.00%
Profit
Before
Tax
-
547.2
5 -15.33%
Profit
Before
Tax
-
547.2
5 -15.33%
Profit
Before
Tax 592.13 11.06%
Profit
Before
Tax
592.1
3 11.06%
Profit
Before
Tax
181
1.5 25.38%
Profit
Before
Tax
1781.
5 24.96%
Profit
Before
Tax
1811
.5 25.38%
Income
Tax
Expens
es 0 0.00%
Income
Tax
Expens
es 0 0.00%
Income
Tax
Expens
es 0 0.00%
Income
Tax
Expens
es 0 0.00%
Income
Tax
Expens
es 0 0.00%
Income
Tax
Expens
es 5 0.14%
Income
Tax
Expens
es 0 0.00%
Profit
of the
day
-
547.2
5 -15.33%
Profit
of the
day
-
547.2
5 -15.33%
Profit
of the
day 592.13 11.06%
Profit
of the
day
592.1
3 11.06%
Profit
of the
day
181
1.5 25.38%
Profit
of the
day
1781.
5 24.96%
Profit
of the
day
1811
.5 25.38%
⊘ This is a preview!⊘
Do you want full access?
Subscribe today to unlock all pages.
Trusted by 1+ million students worldwide
0COST AND PERFORMANCE MANAGEMENT IN TOURISM AND HOSPITALITY
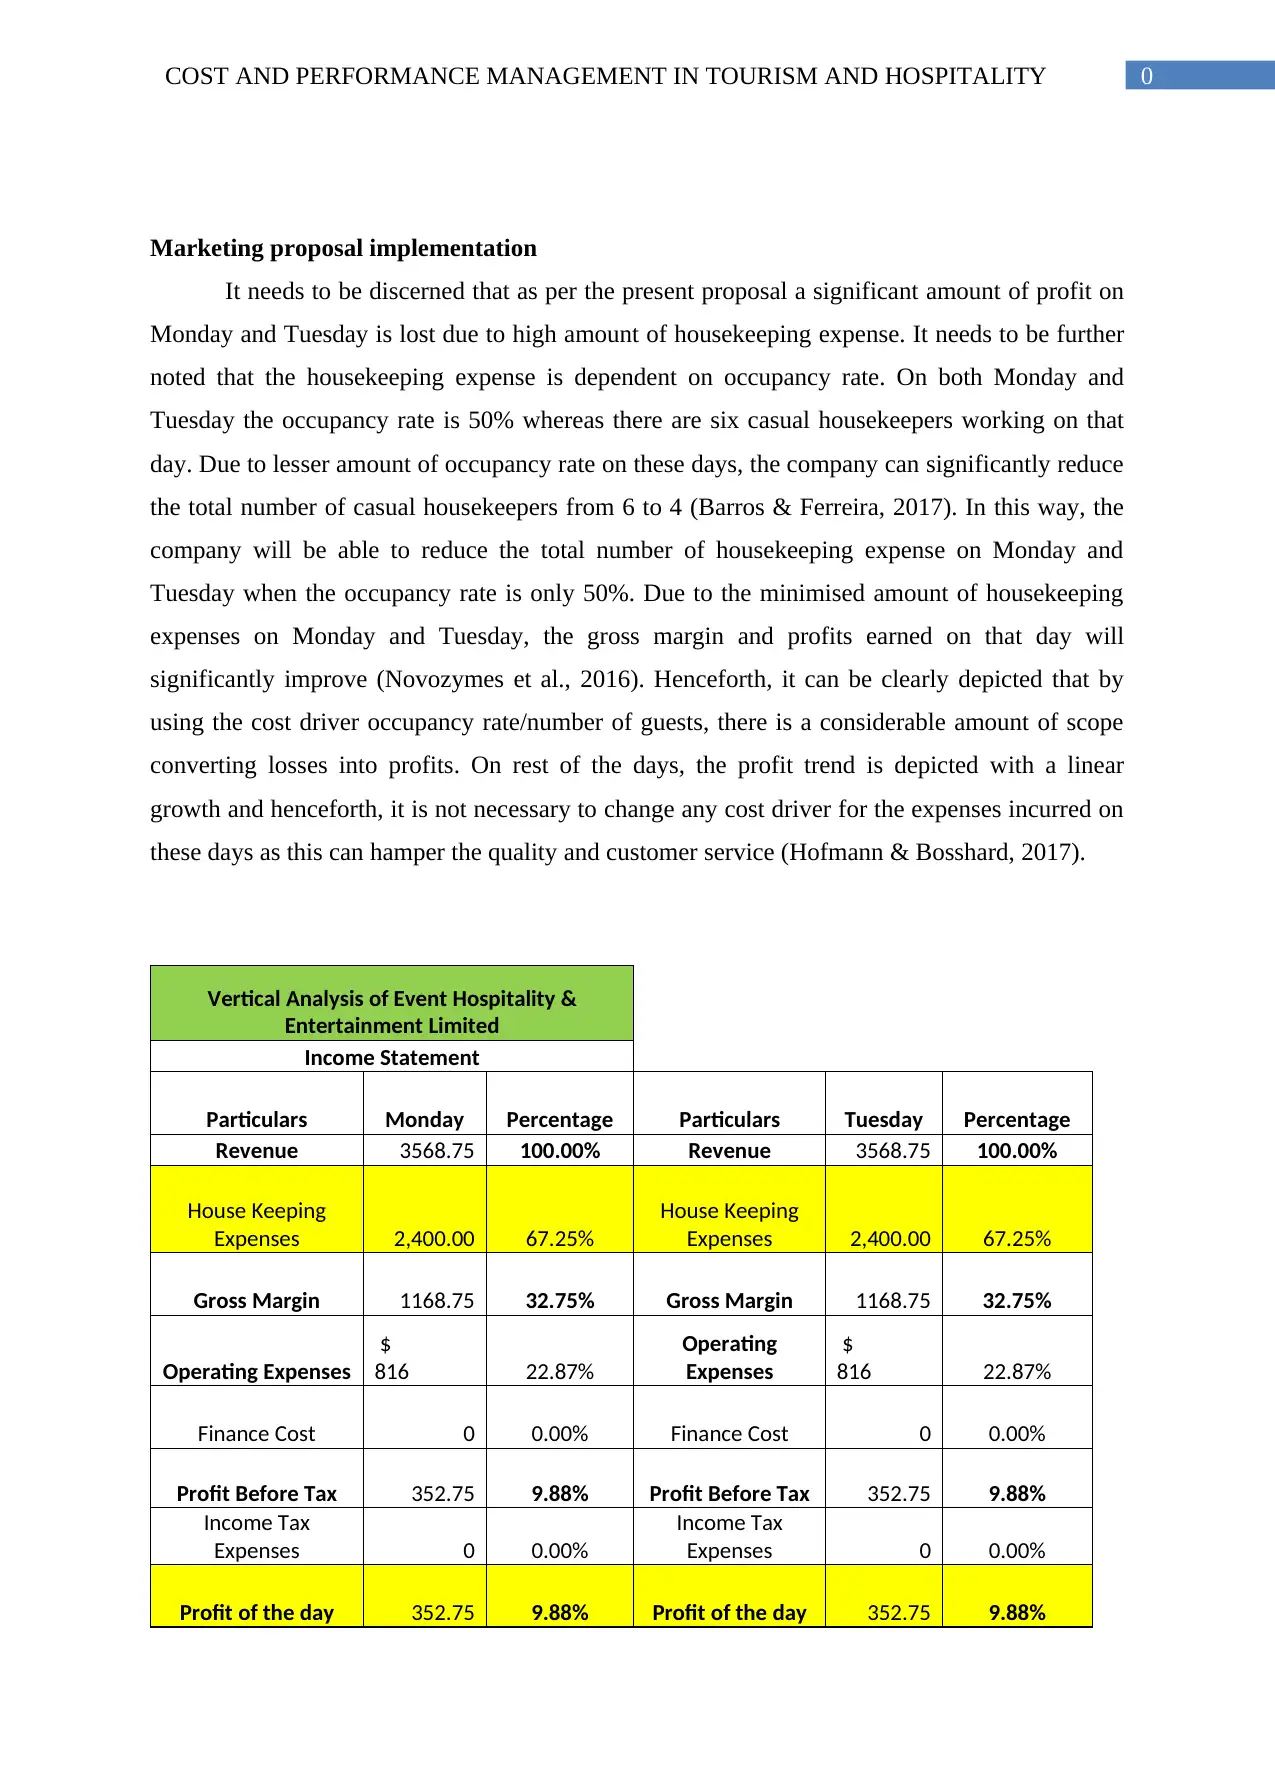
Marketing proposal implementation
It needs to be discerned that as per the present proposal a significant amount of profit on
Monday and Tuesday is lost due to high amount of housekeeping expense. It needs to be further
noted that the housekeeping expense is dependent on occupancy rate. On both Monday and
Tuesday the occupancy rate is 50% whereas there are six casual housekeepers working on that
day. Due to lesser amount of occupancy rate on these days, the company can significantly reduce
the total number of casual housekeepers from 6 to 4 (Barros & Ferreira, 2017). In this way, the
company will be able to reduce the total number of housekeeping expense on Monday and
Tuesday when the occupancy rate is only 50%. Due to the minimised amount of housekeeping
expenses on Monday and Tuesday, the gross margin and profits earned on that day will
significantly improve (Novozymes et al., 2016). Henceforth, it can be clearly depicted that by
using the cost driver occupancy rate/number of guests, there is a considerable amount of scope
converting losses into profits. On rest of the days, the profit trend is depicted with a linear
growth and henceforth, it is not necessary to change any cost driver for the expenses incurred on
these days as this can hamper the quality and customer service (Hofmann & Bosshard, 2017).
Vertical Analysis of Event Hospitality &
Entertainment Limited
Income Statement
Particulars Monday Percentage Particulars Tuesday Percentage
Revenue 3568.75 100.00% Revenue 3568.75 100.00%
House Keeping
Expenses 2,400.00 67.25%
House Keeping
Expenses 2,400.00 67.25%
Gross Margin 1168.75 32.75% Gross Margin 1168.75 32.75%
Operating Expenses
$
816 22.87%
Operating
Expenses
$
816 22.87%
Finance Cost 0 0.00% Finance Cost 0 0.00%
Profit Before Tax 352.75 9.88% Profit Before Tax 352.75 9.88%
Income Tax
Expenses 0 0.00%
Income Tax
Expenses 0 0.00%
Profit of the day 352.75 9.88% Profit of the day 352.75 9.88%
Paraphrase This Document
Need a fresh take? Get an instant paraphrase of this document with our AI Paraphraser
1COST AND PERFORMANCE MANAGEMENT IN TOURISM AND HOSPITALITY
Behaviour of Cost Cost Driver Monday Tuesday
50%
occupancy 50% occupancy
Cost: Fixed
Rent for Premises
Total number of
property
$
80 $ 80
Internet
Speed and
network operator
$
15 $ 15
Advertisement Media Selection
$
70 $ 70
Insurance Nature of Risk
$
8 $ 8
Total expenses
from Fixed cost
Drivers
$
173 $ 173
Cost: Variable
Full Time House
Keeping Expense Number of guests $600.00 $600.00
Casual House
Keeping Expense Number of guests $1,800.00 $1,800.00
Electricity Number of guests $550.00 $550.00
Water Expenses Number of guests $35.00 $35.00
Laundry Expenses
(Average) Number of guests $55.00 $55.00
Netflix
Subscription Number of guests $3.00 $3.00
Total expenses
from variable cost
Drivers $3,043.00 $3,043.00
2COST AND PERFORMANCE MANAGEMENT IN TOURISM AND HOSPITALITY
Conclusion
The various depictions made on Cost Driver and Cost Behaviour has stated that the
rationale of selecting fixed cost is due to the fact that they remain constant even with an increase
or decrease in the occupancy rate. The main driver for the fixed cost rent is identified with total
number of property in possession of the “Event Hospitality & Entertainment Limited”.
Additionally, the various analysis and synthesis of information in a quantitative manner it can be
clearly seen that the housekeeping expenses are the most significant expense incurred by the
company in revenue generation. The company can significantly reduce the total number of casual
housekeepers from 6 to 4 on Monday and Tuesday. Due to the minimised amount of
housekeeping expenses on Monday and Tuesday, the gross margin and profits earned on that day
will significantly improve.
⊘ This is a preview!⊘
Do you want full access?
Subscribe today to unlock all pages.
Trusted by 1+ million students worldwide
3COST AND PERFORMANCE MANAGEMENT IN TOURISM AND HOSPITALITY
References
Babad, Y. M., Balachandran, B. V., BITTENCOURT, O. N. D. A. S., Bornia, A. C., Botelho, E.,
Brimson, J. A., … Lembeck, M. (2015). Activity-based costing for hospitals. The
Accounting Review, 5(3), 3–34. https://doi.org/10.1111/j.1467-6281.2012.00366.x
Barros, R. S., & Ferreira, A. M. D. S. da C. (2017). Time-driven activity-based costing.
Qualitative Research in Accounting & Management, 14(1), 2–20.
https://doi.org/10.1108/QRAM-10-2015-0095
Hofmann, E., & Bosshard, J. (2017). Supply chain management and activity-based costing.
International Journal of Physical Distribution & Logistics Management, 47(8), 712–735.
https://doi.org/10.1108/IJPDLM-04-2017-0158
Kapian, R. S., & Anderson, S. R. (2014). Rethinking activity-based costing. Technology.
Retrieved from http://www.homeworkmarket.com/sites/default/files/q1/26/11/abc-
_company_article.pdf
Kapić, J. (2014). Activity Based Costing - ABC. Business Consultant / Poslovni Konsultant,
6(32), 9–16. Retrieved from http://poslovnikonsultant.ba/
Mahal, I., & Hossain, M. A. (2015). Activity-Based Costing (ABC) – An Effective Tool for
Better Management. Research Journal of Finance and AccountingOnline), 6(4), 2222–
2847.
McLaughlin, N., Burke, M. A., Setlur, N. P., Niedzwiecki, D. R., Kaplan, A. L., Saigal, C., …
Kaplan, R. S. (2014). Time-driven activity-based costing: a driver for provider
engagement in costing activities and redesign initiatives. Neurosurgical Focus, 37(5), E3.
https://doi.org/10.3171/2014.8.FOCUS14381
NICE. (2016). Costing Report. Rehabilitation after Critical Illness Costing Report, (February),
1–39. Retrieved from
www.nice.org.uk/guidance/CG155%0Awww.nice.org.uk/CG83%5Cnwww.nice.org.uk
Novozymes, Børsen, Drury, C., Brealey, R. A., Myres, S. C., Allen, F., … Raiborn, C. a. (2016).
Time-driven activity-based costing. Journal of Accounting Research, 18(2), 23–51.
https://doi.org/10.1287/mnsc.1100.1175
Paraphrase This Document
Need a fresh take? Get an instant paraphrase of this document with our AI Paraphraser

4COST AND PERFORMANCE MANAGEMENT IN TOURISM AND HOSPITALITY
1 out of 11
Related Documents


Your All-in-One AI-Powered Toolkit for Academic Success.
+13062052269
info@desklib.com
Available 24*7 on WhatsApp / Email
![[object Object]](/_next/static/media/star-bottom.7253800d.svg)
Unlock your academic potential
Copyright © 2020–2026 A2Z Services. All Rights Reserved. Developed and managed by ZUCOL.