Cost and Performance Management for Tourism and Hospitality - Analysis
VerifiedAdded on 2021/02/20
|10
|2700
|161
Report
AI Summary
This report provides a detailed analysis of cost and performance management within the tourism and hospitality industry, focusing on two distinct events. It categorizes costs, evaluates cost drivers, and differentiates cost-related pricing and control techniques. The analysis includes a breakdown of expenses, comparing cost shares and values across events, with key drivers identified as decorations and lighting. The report also explores pricing strategies, calculates break-even points, and suggests the best alternative for maximizing profitability, concluding that Event 1 seems more profitable due to the higher markup. The study uses tables to present data and calculations, offering a comprehensive overview of cost management practices and their impact on profitability within the industry.

COST AND PERFORMANCE MANAGEMENT FOR TOURISM AND
HOSPITALITY
HOSPITALITY
Paraphrase This Document
Need a fresh take? Get an instant paraphrase of this document with our AI Paraphraser
TABLE OF CONTENTS
INTRODUCTION...........................................................................................................................1
Task 1: Categorize costs and critically evaluate which costs are cost driven. (sales driven)..........1
Task 2: Differentiate cost related to pricing and cost control techniques according to the various
cost drivers and behaviours..............................................................................................................5
Task 3: Discuss with emphasis on cost drivers in relation to which offer is best acceptable for the
business............................................................................................................................................7
CONCLUSION................................................................................................................................8
REFERENCE..................................................................................................................................................9
Table 1First event............................................................................................................................2
Table 2Second event........................................................................................................................4
Table 3Difference in cost share in total expenditure.......................................................................5
Table 4Value difference across events............................................................................................6
Table 5price after mark-up percentage............................................................................................7
Table 6BEP......................................................................................................................................7
INTRODUCTION
Cost is the one of main factor which is given due importance by the business firms. This is
because its control lead to increase in business profit. Firms adopt multiple approaches to control
cost of the product at the workplace. In the current report two events are analysed and in respect
to them specific analysis is done through calculation and comparison of values. At end of the
report break even level is identified and best alternative is suggested that can be adopted by the
firm to earn more profit in the business.
Task 1: Categorize costs and critically evaluate which costs are cost driven.
(sales driven)
Categorize the costs.
Classification of costs refers to grouping the expenses according to the characteristics that
are similar. In the field of costing, there are different ways to categorize cost on the basis of
functions, nature, traceability etc.
Classification on the basis of nature : Under this, cost can be classified into different
categorize like cost of material, labour cost and other expenses.
Material cost - It refers to the cost related with material that organization uses in
production of goods. It can be divided into other parts such as cost of packaging of the
material, cost of raw material etc.
Labour expenses - It is related with wages and salary of the labour (Priya., C., 2018).
Organization have to pay salary and wages to employees for performing different tasks.
Such as salary paid to employees for providing various services.
Expenses - This includes cost other than cost of material and labour that firm has to incur
for effective marketing of goods. Such as expenses related with social media marketing
through Instagram, Facebook, Television etc.
Classification on the basis of functions: Under this, the cost are grouped on the basis of
different functions such as selling, production, administration etc.
Production costs- Cost of production refers to the expenses related with actual
manufacturing of the products (Lomas, J., 2018). These expenses are necessary in order
to manufacture the goods.
1
⊘ This is a preview!⊘
Do you want full access?
Subscribe today to unlock all pages.
Trusted by 1+ million students worldwide
Commercial costs - Commercial cost refers to the total expenses for operating the
enterprise. It includes cost other than manufacturing cost. Such as selling and distribution
expenses, administration cost etc.
Classification by Traceability : It is considered as one of the most important classification of
costs. On the basis of traceability, cost can be classified under two categories. Such as -
Direct cost - It refers to the cost that can be easily associated with cost centres or cost
unit. For example – cost of material, cost of labour that are involved in the process of
manufacturing.
Indirect cost - It refers to the cost that cannot be directly identified with a particular cost
centre or a cost unit (Etkin,, 2016). Example of indirect cost is rent of building, salary of
the manager etc. Therefore, company cannot determine how to ascertain these expenses
to a particular cost unit.
Classification by Normality : Under this, the cost can be classified in two categories such as
normal and abnormal cost (Vuong, 2018). These expenses are generally occur at particular level
of output and under similar set of situations.
Normal cost - It is a part of total cost of production. It refers to the expenses that firm
incurr at normal level of output in similar conditions. These expenses are part of costing
profit and loss of the company.
Abnormal cost - These cost are not incurred by firm at a particular level of output in
given conditions. These costs are profit and loss
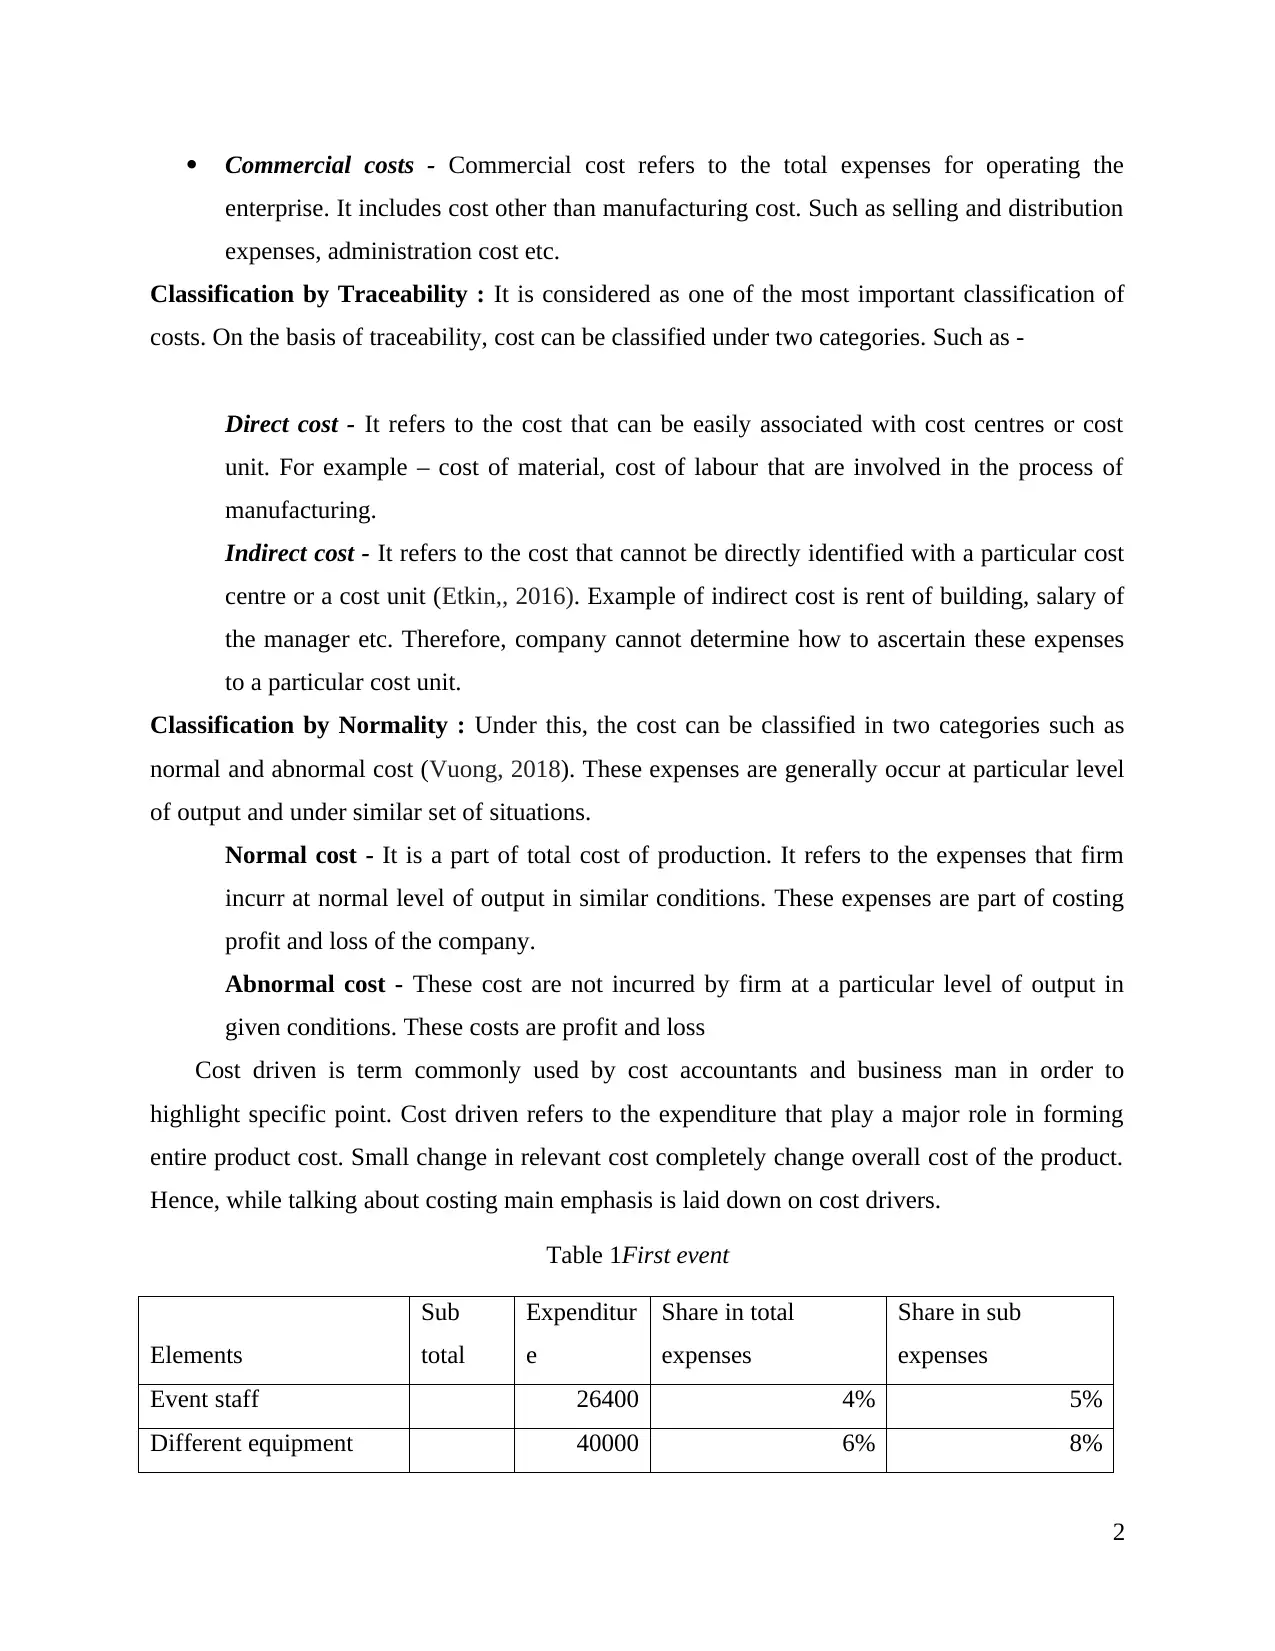
Cost driven is term commonly used by cost accountants and business man in order to
highlight specific point. Cost driven refers to the expenditure that play a major role in forming
entire product cost. Small change in relevant cost completely change overall cost of the product.
Hence, while talking about costing main emphasis is laid down on cost drivers.
Table 1First event
Elements
Sub
total
Expenditur
e
Share in total
expenses
Share in sub
expenses
Event staff 26400 4% 5%
Different equipment 40000 6% 8%
2
enterprise. It includes cost other than manufacturing cost. Such as selling and distribution
expenses, administration cost etc.
Classification by Traceability : It is considered as one of the most important classification of
costs. On the basis of traceability, cost can be classified under two categories. Such as -
Direct cost - It refers to the cost that can be easily associated with cost centres or cost
unit. For example – cost of material, cost of labour that are involved in the process of
manufacturing.
Indirect cost - It refers to the cost that cannot be directly identified with a particular cost
centre or a cost unit (Etkin,, 2016). Example of indirect cost is rent of building, salary of
the manager etc. Therefore, company cannot determine how to ascertain these expenses
to a particular cost unit.
Classification by Normality : Under this, the cost can be classified in two categories such as
normal and abnormal cost (Vuong, 2018). These expenses are generally occur at particular level
of output and under similar set of situations.
Normal cost - It is a part of total cost of production. It refers to the expenses that firm
incurr at normal level of output in similar conditions. These expenses are part of costing
profit and loss of the company.
Abnormal cost - These cost are not incurred by firm at a particular level of output in
given conditions. These costs are profit and loss
Cost driven is term commonly used by cost accountants and business man in order to
highlight specific point. Cost driven refers to the expenditure that play a major role in forming
entire product cost. Small change in relevant cost completely change overall cost of the product.
Hence, while talking about costing main emphasis is laid down on cost drivers.
Table 1First event
Elements
Sub
total
Expenditur
e
Share in total
expenses
Share in sub
expenses
Event staff 26400 4% 5%
Different equipment 40000 6% 8%
2
Paraphrase This Document
Need a fresh take? Get an instant paraphrase of this document with our AI Paraphraser
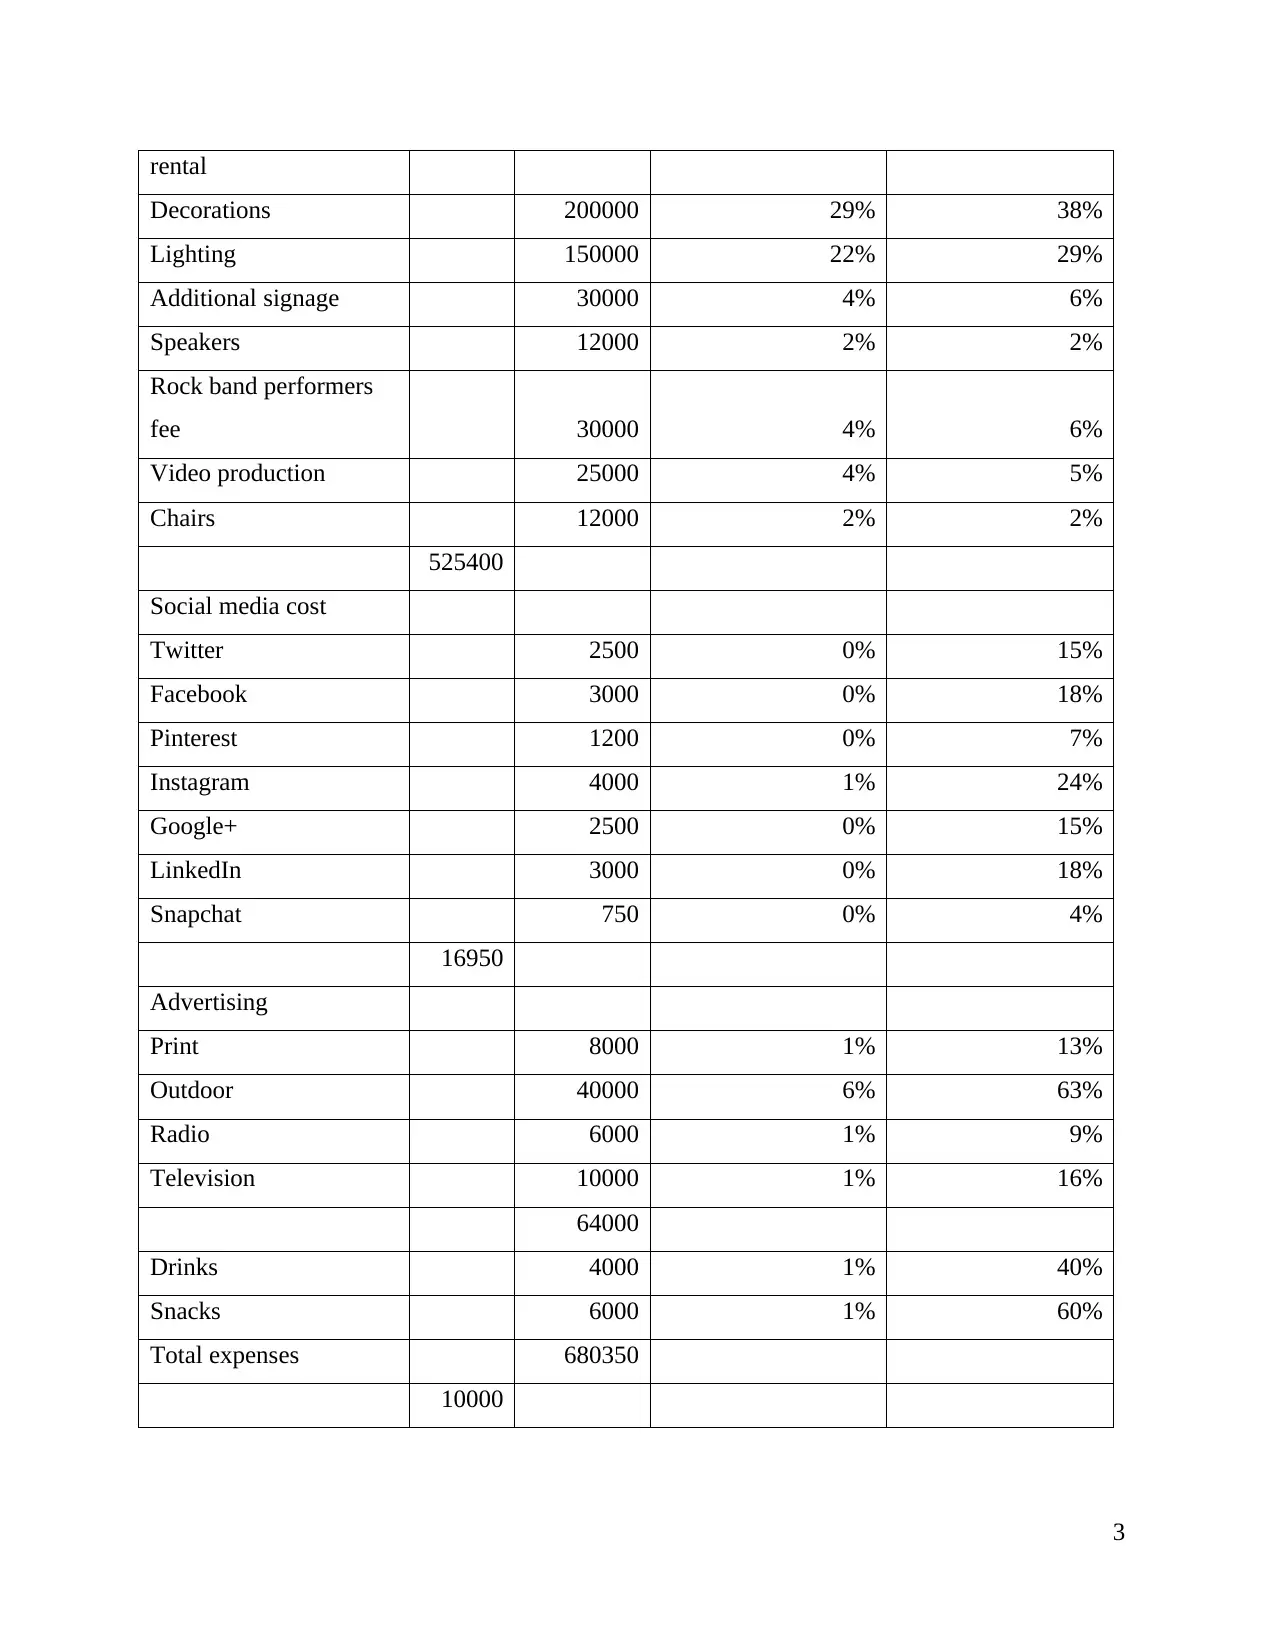
rental
Decorations 200000 29% 38%
Lighting 150000 22% 29%
Additional signage 30000 4% 6%
Speakers 12000 2% 2%
Rock band performers
fee 30000 4% 6%
Video production 25000 4% 5%
Chairs 12000 2% 2%
525400
Social media cost
Twitter 2500 0% 15%
Facebook 3000 0% 18%
Pinterest 1200 0% 7%
Instagram 4000 1% 24%
Google+ 2500 0% 15%
LinkedIn 3000 0% 18%
Snapchat 750 0% 4%
16950
Advertising
Print 8000 1% 13%
Outdoor 40000 6% 63%
Radio 6000 1% 9%
Television 10000 1% 16%
64000
Drinks 4000 1% 40%
Snacks 6000 1% 60%
Total expenses 680350
10000
3
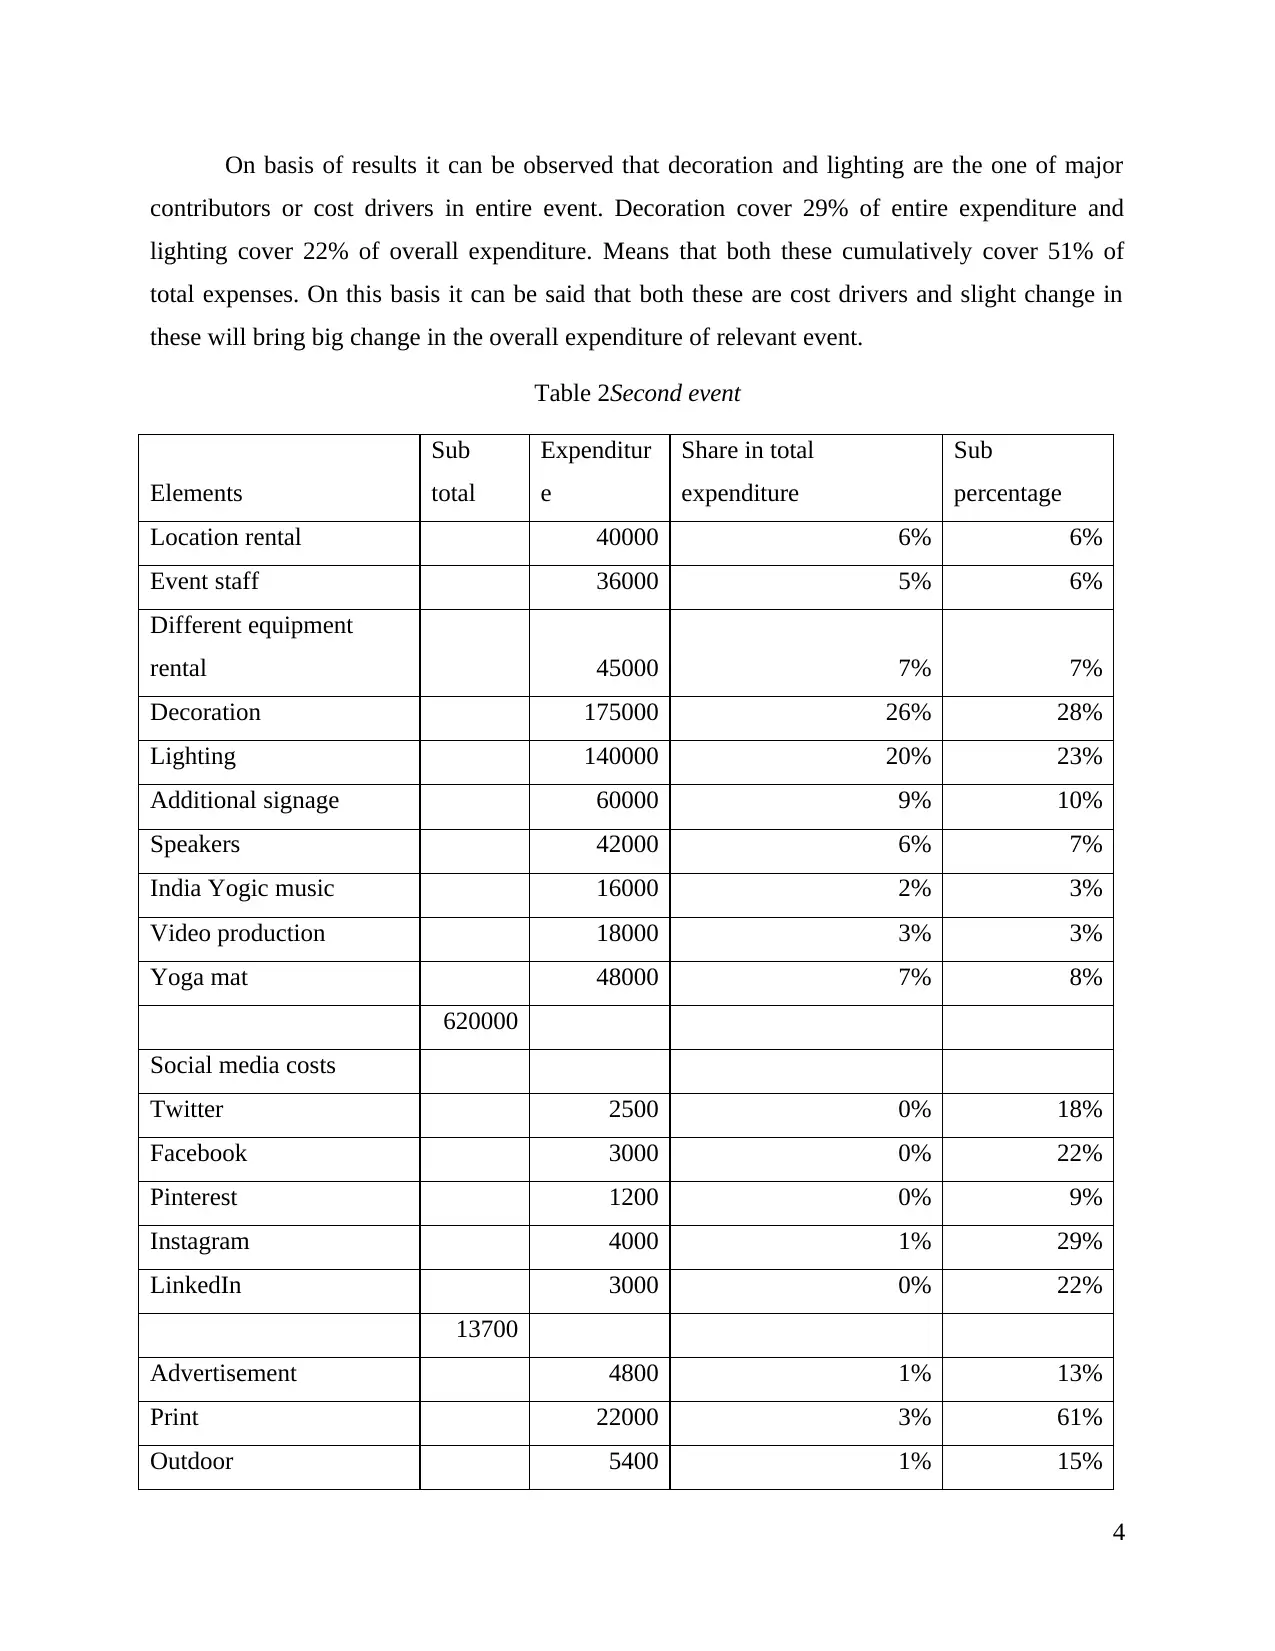
On basis of results it can be observed that decoration and lighting are the one of major
contributors or cost drivers in entire event. Decoration cover 29% of entire expenditure and
lighting cover 22% of overall expenditure. Means that both these cumulatively cover 51% of
total expenses. On this basis it can be said that both these are cost drivers and slight change in
these will bring big change in the overall expenditure of relevant event.
Table 2Second event
Elements
Sub
total
Expenditur
e
Share in total
expenditure
Sub
percentage
Location rental 40000 6% 6%
Event staff 36000 5% 6%
Different equipment
rental 45000 7% 7%
Decoration 175000 26% 28%
Lighting 140000 20% 23%
Additional signage 60000 9% 10%
Speakers 42000 6% 7%
India Yogic music 16000 2% 3%
Video production 18000 3% 3%
Yoga mat 48000 7% 8%
620000
Social media costs
Twitter 2500 0% 18%
Facebook 3000 0% 22%
Pinterest 1200 0% 9%
Instagram 4000 1% 29%
LinkedIn 3000 0% 22%
13700
Advertisement 4800 1% 13%
Print 22000 3% 61%
Outdoor 5400 1% 15%
4
⊘ This is a preview!⊘
Do you want full access?
Subscribe today to unlock all pages.
Trusted by 1+ million students worldwide
Radio 2000 0% 6%
Television 2000 0% 6%
36200
Drinks 8000 1% 53%
Snacks 7000 1% 47%
Total expenditure 15000 684900
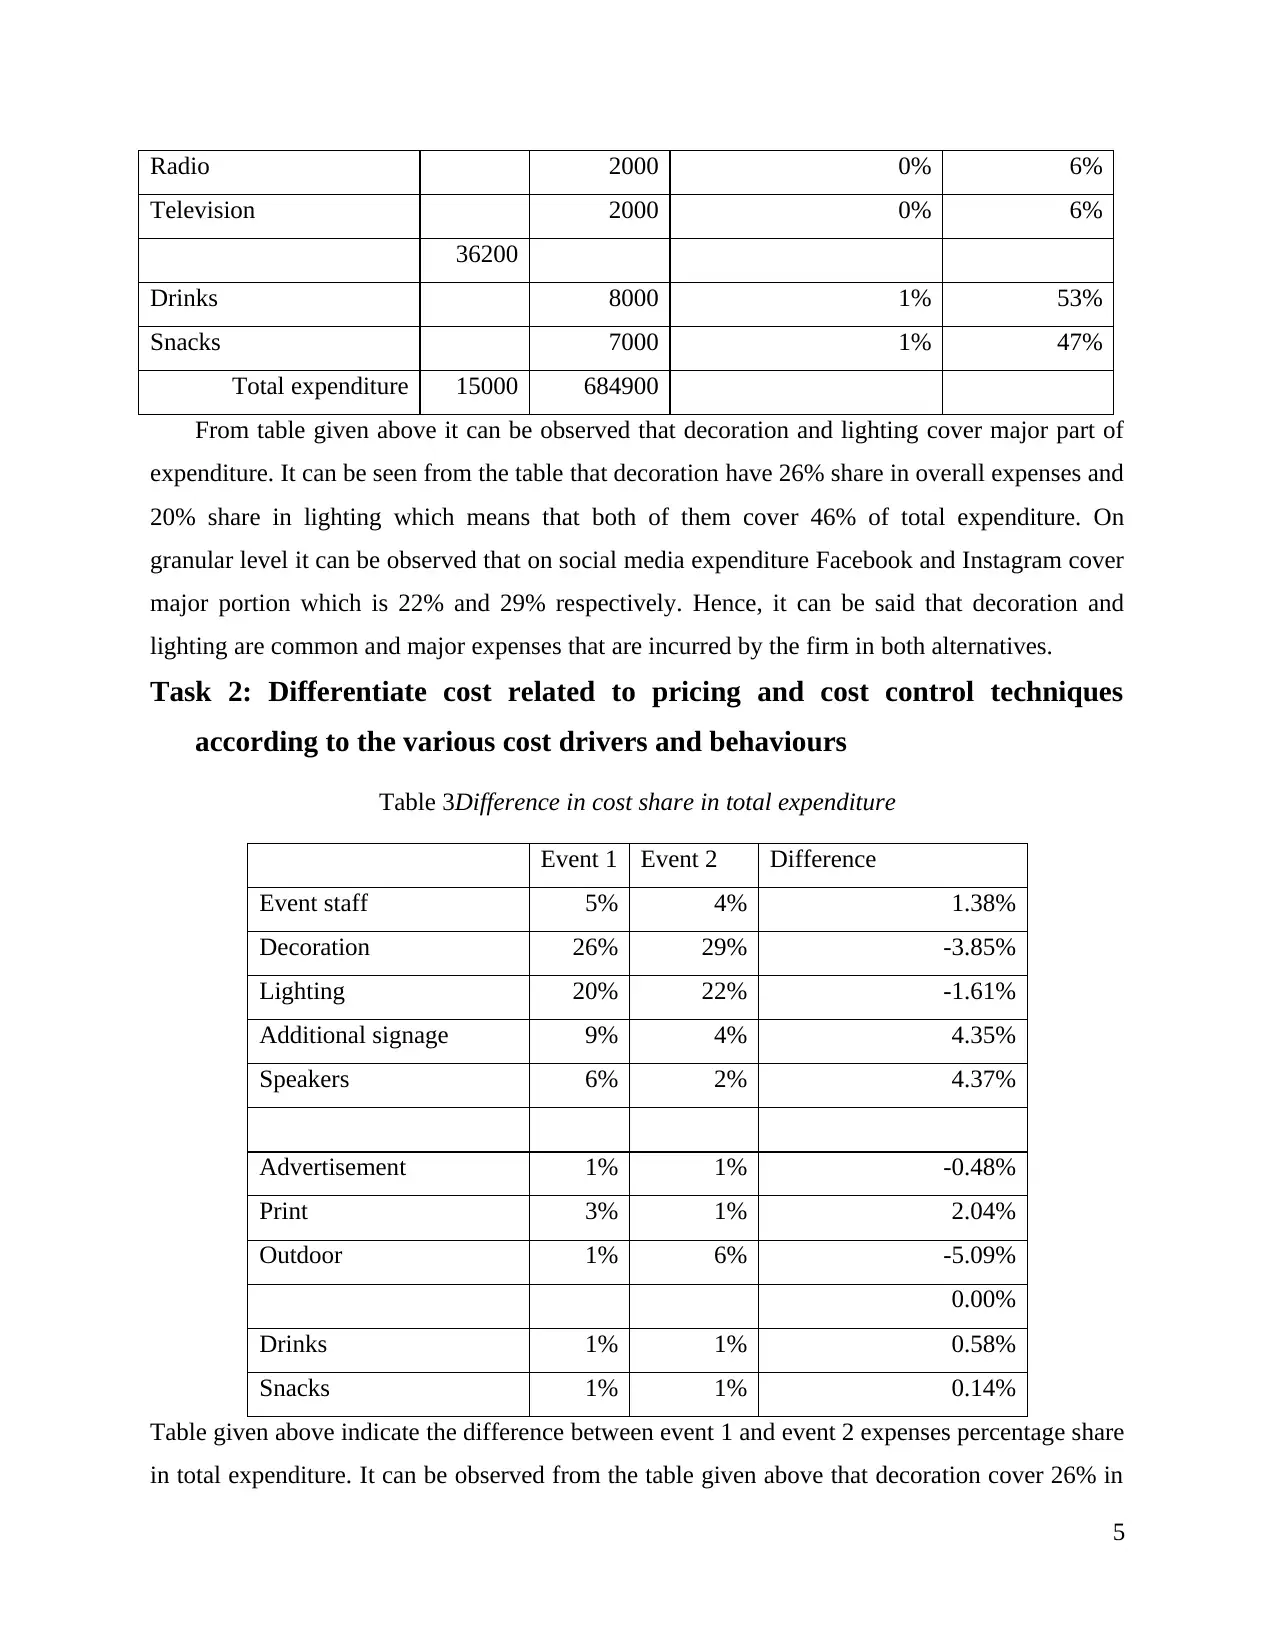
From table given above it can be observed that decoration and lighting cover major part of
expenditure. It can be seen from the table that decoration have 26% share in overall expenses and
20% share in lighting which means that both of them cover 46% of total expenditure. On
granular level it can be observed that on social media expenditure Facebook and Instagram cover
major portion which is 22% and 29% respectively. Hence, it can be said that decoration and
lighting are common and major expenses that are incurred by the firm in both alternatives.
Task 2: Differentiate cost related to pricing and cost control techniques
according to the various cost drivers and behaviours
Table 3Difference in cost share in total expenditure
Event 1 Event 2 Difference
Event staff 5% 4% 1.38%
Decoration 26% 29% -3.85%
Lighting 20% 22% -1.61%
Additional signage 9% 4% 4.35%
Speakers 6% 2% 4.37%
Advertisement 1% 1% -0.48%
Print 3% 1% 2.04%
Outdoor 1% 6% -5.09%
0.00%
Drinks 1% 1% 0.58%
Snacks 1% 1% 0.14%
Table given above indicate the difference between event 1 and event 2 expenses percentage share
in total expenditure. It can be observed from the table given above that decoration cover 26% in
5
Television 2000 0% 6%
36200
Drinks 8000 1% 53%
Snacks 7000 1% 47%
Total expenditure 15000 684900
From table given above it can be observed that decoration and lighting cover major part of
expenditure. It can be seen from the table that decoration have 26% share in overall expenses and
20% share in lighting which means that both of them cover 46% of total expenditure. On
granular level it can be observed that on social media expenditure Facebook and Instagram cover
major portion which is 22% and 29% respectively. Hence, it can be said that decoration and
lighting are common and major expenses that are incurred by the firm in both alternatives.
Task 2: Differentiate cost related to pricing and cost control techniques
according to the various cost drivers and behaviours
Table 3Difference in cost share in total expenditure
Event 1 Event 2 Difference
Event staff 5% 4% 1.38%
Decoration 26% 29% -3.85%
Lighting 20% 22% -1.61%
Additional signage 9% 4% 4.35%
Speakers 6% 2% 4.37%
Advertisement 1% 1% -0.48%
Print 3% 1% 2.04%
Outdoor 1% 6% -5.09%
0.00%
Drinks 1% 1% 0.58%
Snacks 1% 1% 0.14%
Table given above indicate the difference between event 1 and event 2 expenses percentage share
in total expenditure. It can be observed from the table given above that decoration cover 26% in
5
Paraphrase This Document
Need a fresh take? Get an instant paraphrase of this document with our AI Paraphraser
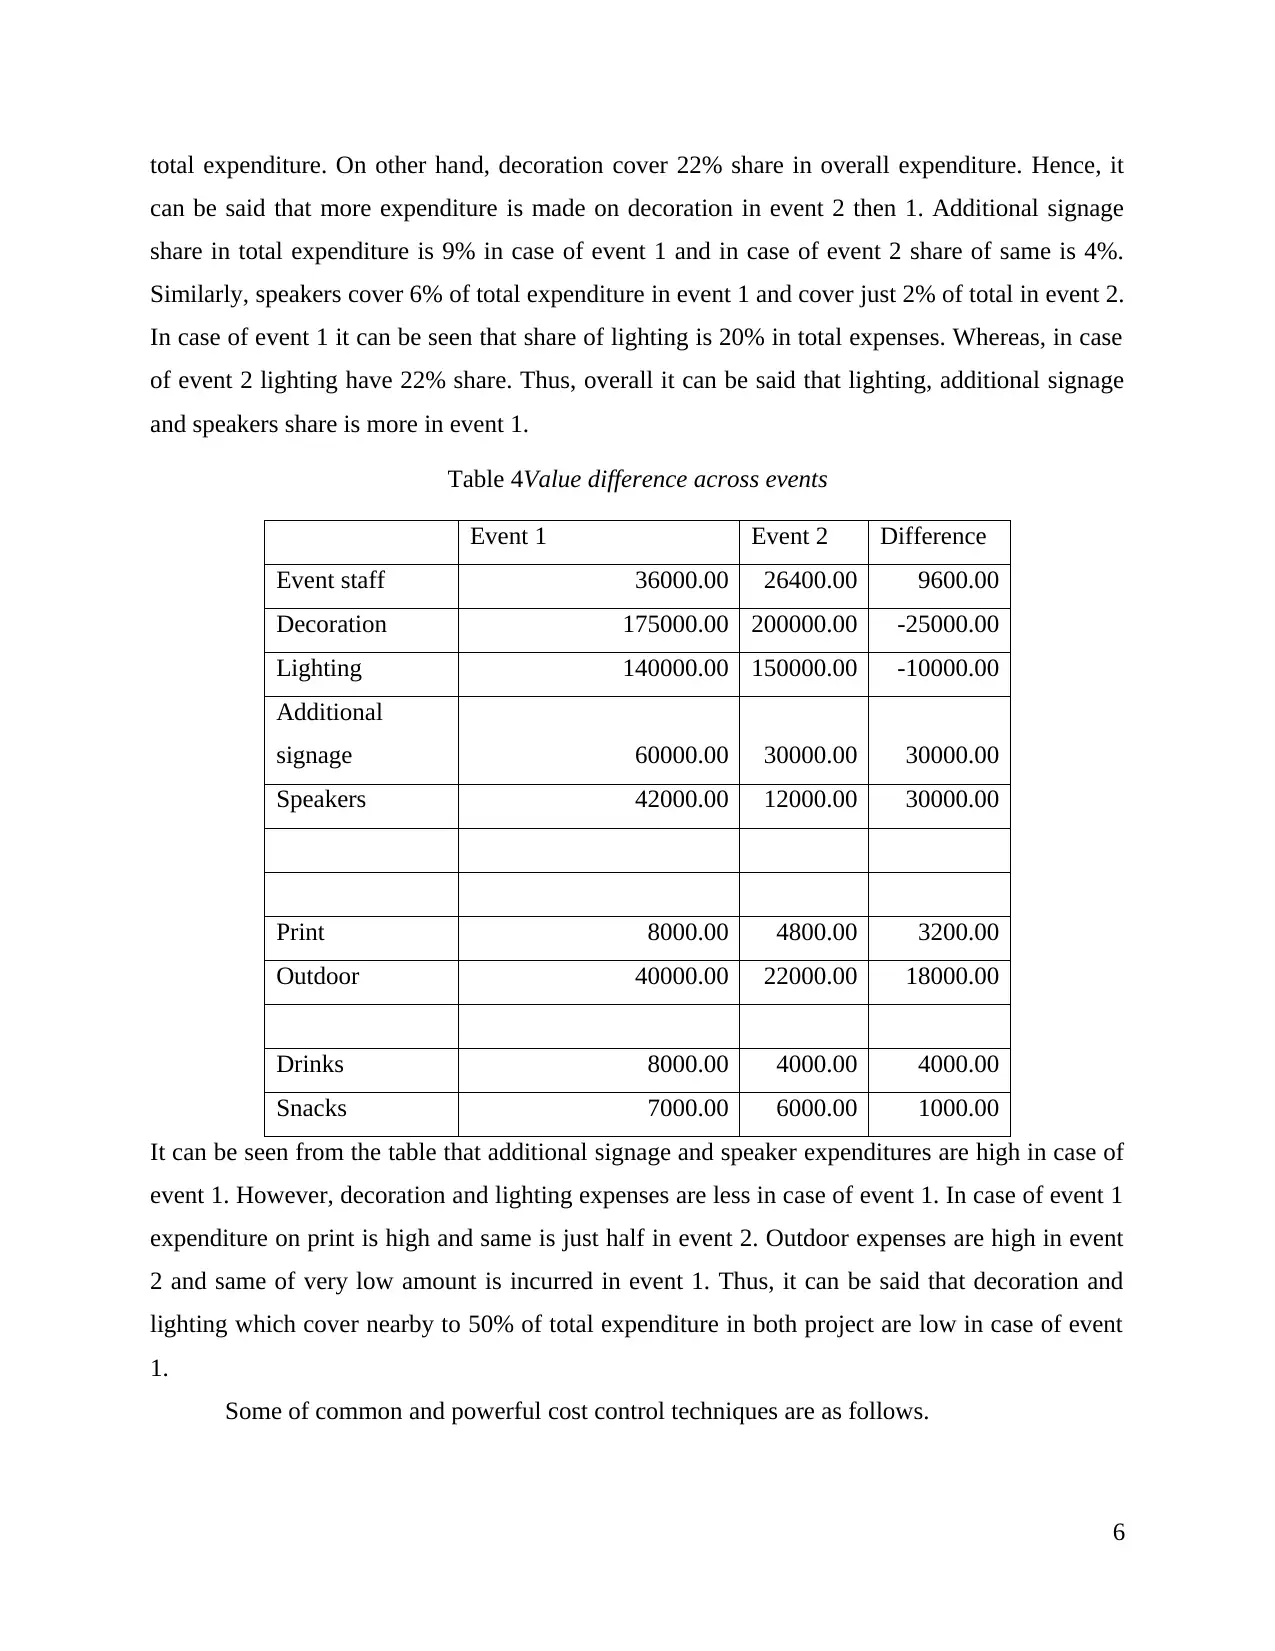
total expenditure. On other hand, decoration cover 22% share in overall expenditure. Hence, it
can be said that more expenditure is made on decoration in event 2 then 1. Additional signage
share in total expenditure is 9% in case of event 1 and in case of event 2 share of same is 4%.
Similarly, speakers cover 6% of total expenditure in event 1 and cover just 2% of total in event 2.
In case of event 1 it can be seen that share of lighting is 20% in total expenses. Whereas, in case
of event 2 lighting have 22% share. Thus, overall it can be said that lighting, additional signage
and speakers share is more in event 1.
Table 4Value difference across events
Event 1 Event 2 Difference
Event staff 36000.00 26400.00 9600.00
Decoration 175000.00 200000.00 -25000.00
Lighting 140000.00 150000.00 -10000.00
Additional
signage 60000.00 30000.00 30000.00
Speakers 42000.00 12000.00 30000.00
Print 8000.00 4800.00 3200.00
Outdoor 40000.00 22000.00 18000.00
Drinks 8000.00 4000.00 4000.00
Snacks 7000.00 6000.00 1000.00
It can be seen from the table that additional signage and speaker expenditures are high in case of
event 1. However, decoration and lighting expenses are less in case of event 1. In case of event 1
expenditure on print is high and same is just half in event 2. Outdoor expenses are high in event
2 and same of very low amount is incurred in event 1. Thus, it can be said that decoration and
lighting which cover nearby to 50% of total expenditure in both project are low in case of event
1.
Some of common and powerful cost control techniques are as follows.
6
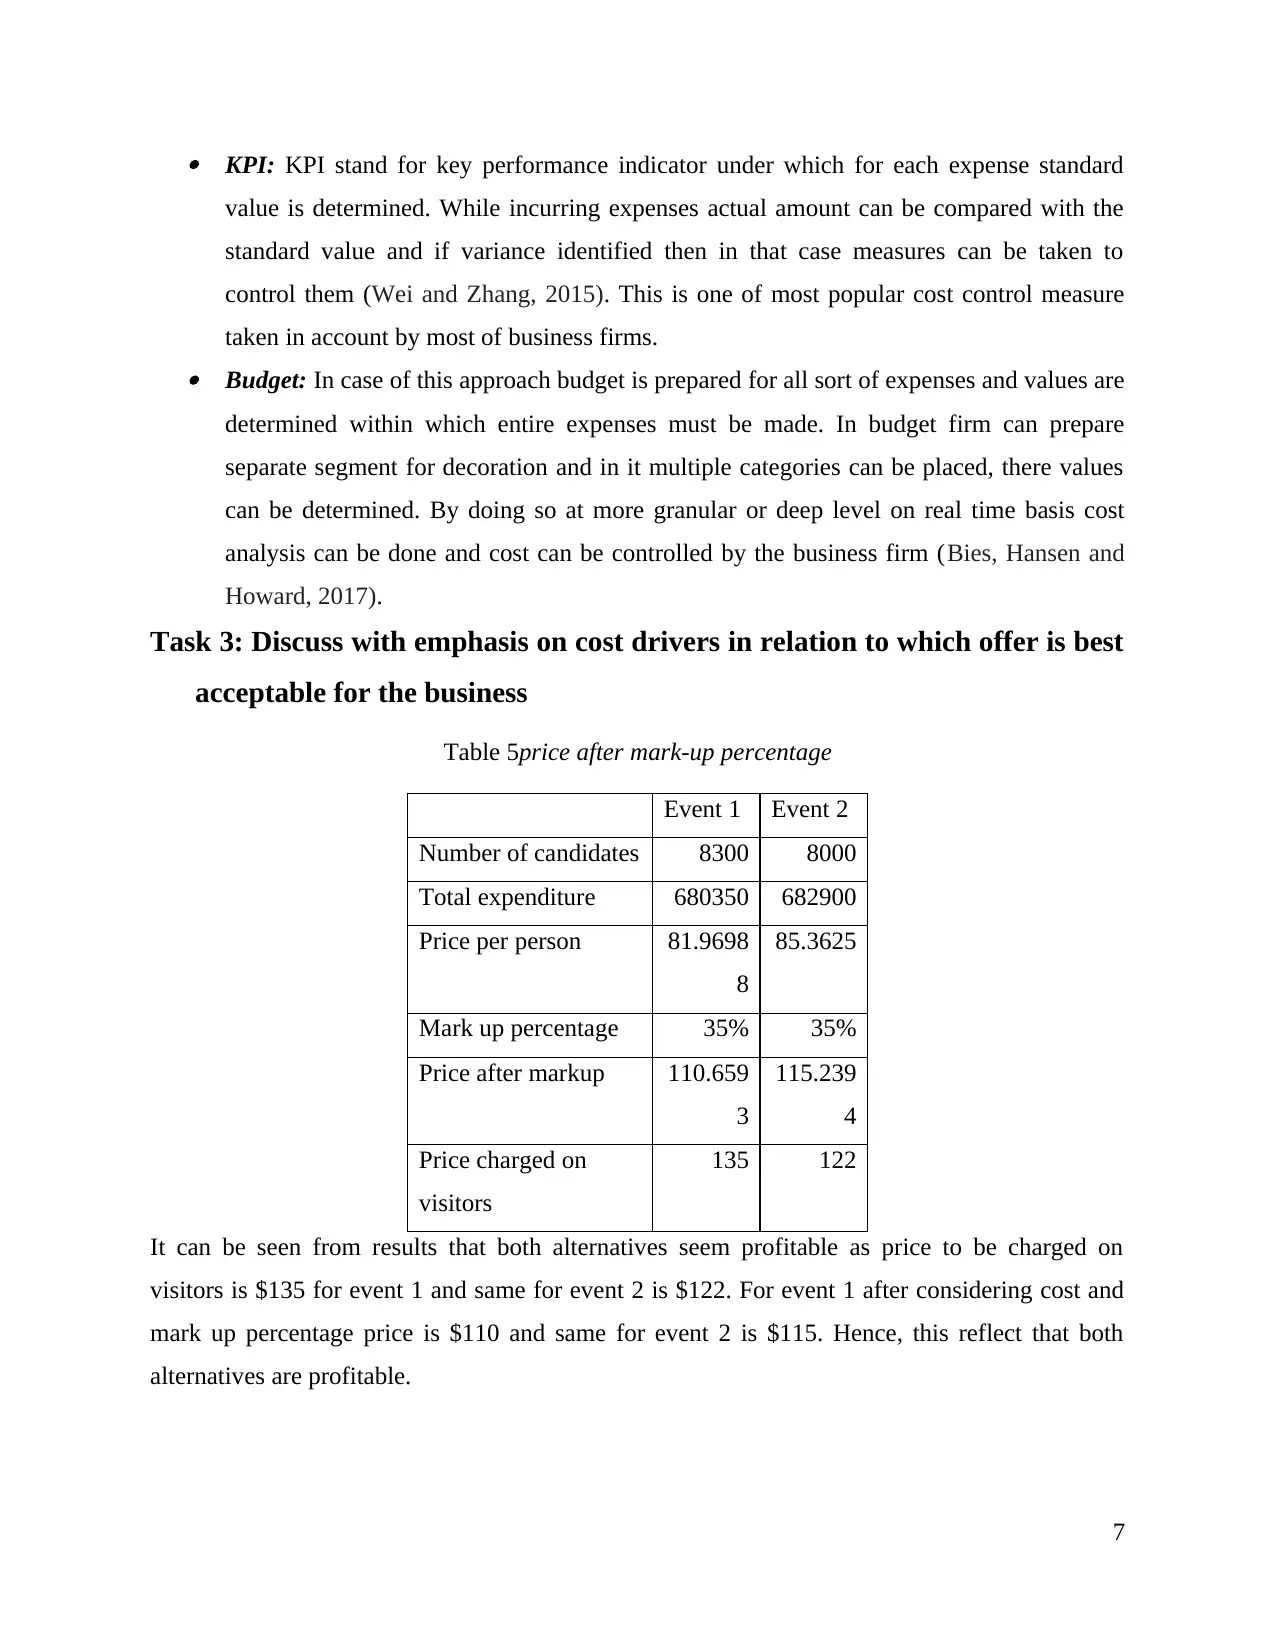
KPI: KPI stand for key performance indicator under which for each expense standard
value is determined. While incurring expenses actual amount can be compared with the
standard value and if variance identified then in that case measures can be taken to
control them (Wei and Zhang, 2015). This is one of most popular cost control measure
taken in account by most of business firms. Budget: In case of this approach budget is prepared for all sort of expenses and values are
determined within which entire expenses must be made. In budget firm can prepare
separate segment for decoration and in it multiple categories can be placed, there values
can be determined. By doing so at more granular or deep level on real time basis cost
analysis can be done and cost can be controlled by the business firm (Bies, Hansen and
Howard, 2017).
Task 3: Discuss with emphasis on cost drivers in relation to which offer is best
acceptable for the business
Table 5price after mark-up percentage
Event 1 Event 2
Number of candidates 8300 8000
Total expenditure 680350 682900
Price per person 81.9698
8
85.3625
Mark up percentage 35% 35%
Price after markup 110.659
3
115.239
4
Price charged on
visitors
135 122
It can be seen from results that both alternatives seem profitable as price to be charged on
visitors is $135 for event 1 and same for event 2 is $122. For event 1 after considering cost and
mark up percentage price is $110 and same for event 2 is $115. Hence, this reflect that both
alternatives are profitable.
7
⊘ This is a preview!⊘
Do you want full access?
Subscribe today to unlock all pages.
Trusted by 1+ million students worldwide
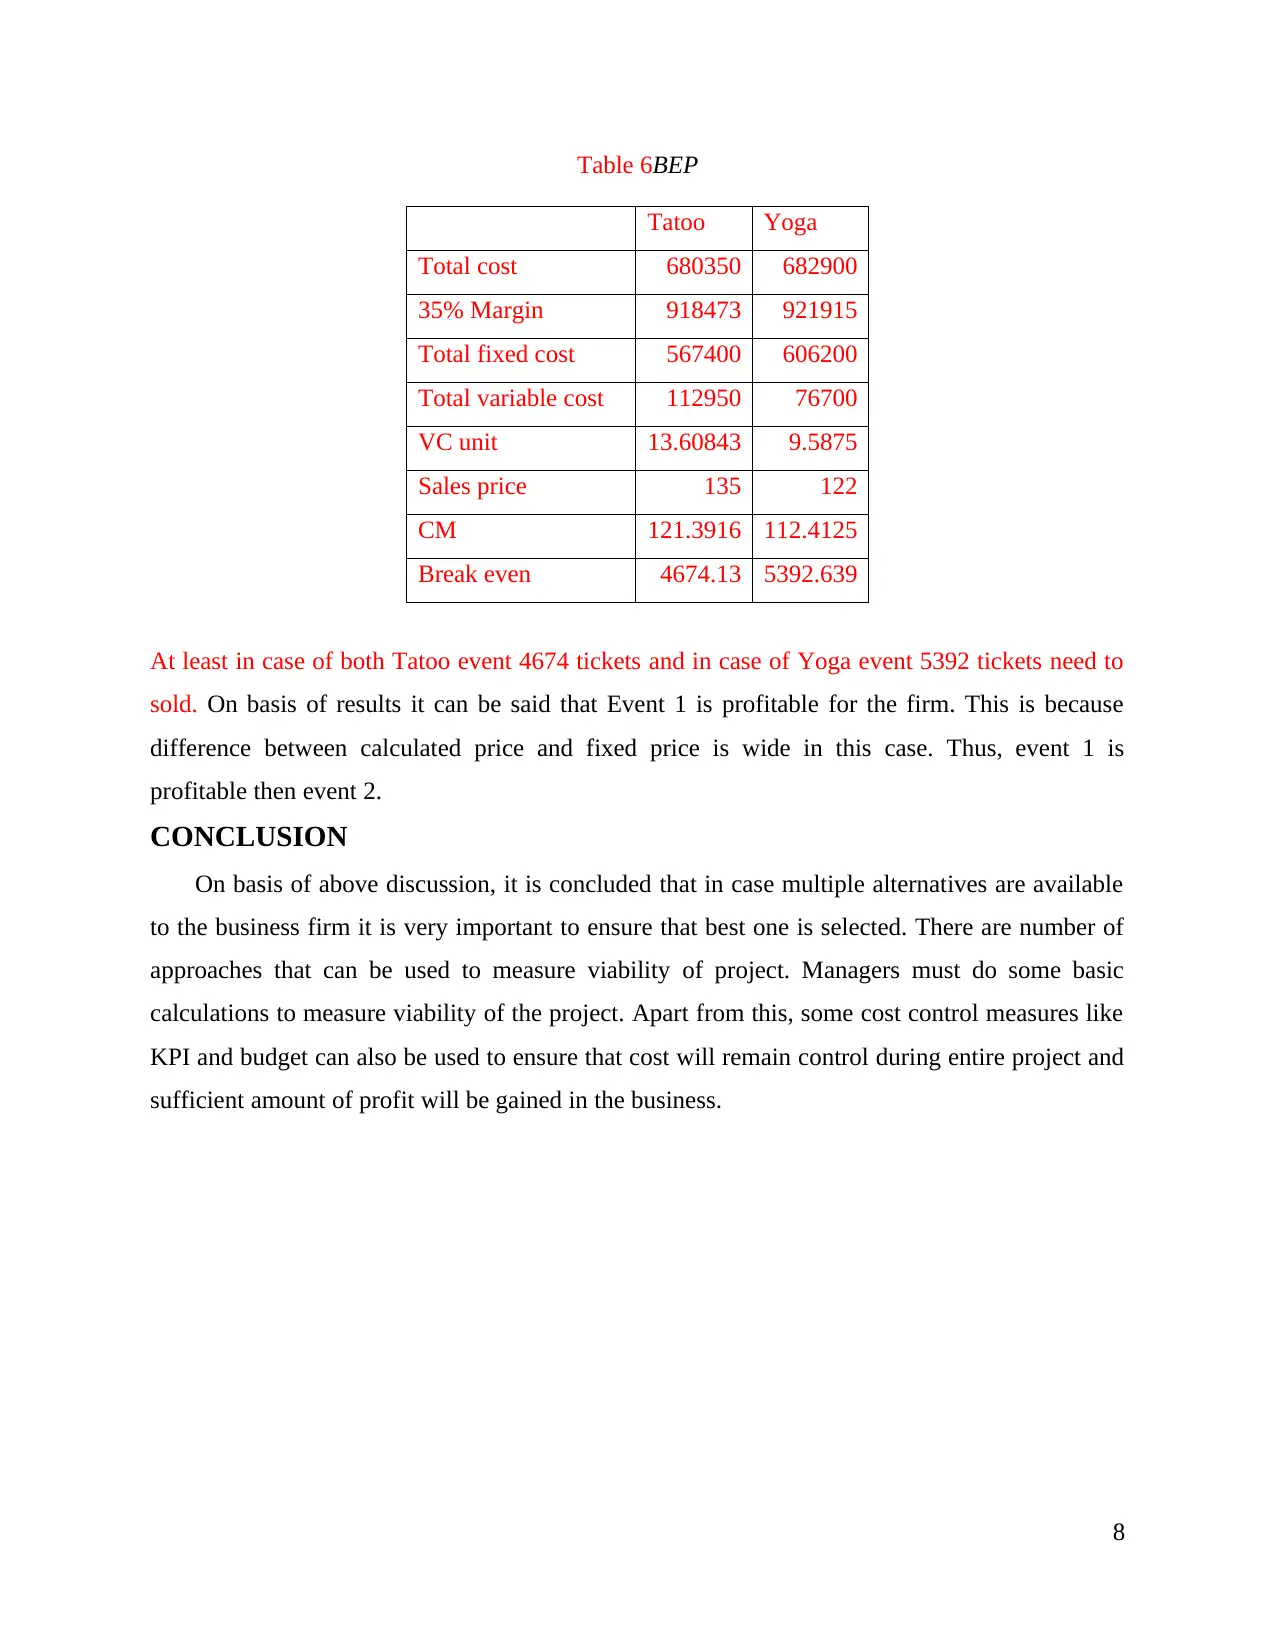
Table 6BEP
Tatoo Yoga
Total cost 680350 682900
35% Margin 918473 921915
Total fixed cost 567400 606200
Total variable cost 112950 76700
VC unit 13.60843 9.5875
Sales price 135 122
CM 121.3916 112.4125
Break even 4674.13 5392.639
At least in case of both Tatoo event 4674 tickets and in case of Yoga event 5392 tickets need to
sold. On basis of results it can be said that Event 1 is profitable for the firm. This is because
difference between calculated price and fixed price is wide in this case. Thus, event 1 is
profitable then event 2.
CONCLUSION
On basis of above discussion, it is concluded that in case multiple alternatives are available
to the business firm it is very important to ensure that best one is selected. There are number of
approaches that can be used to measure viability of project. Managers must do some basic
calculations to measure viability of the project. Apart from this, some cost control measures like
KPI and budget can also be used to ensure that cost will remain control during entire project and
sufficient amount of profit will be gained in the business.
8
1 out of 10
Related Documents


Your All-in-One AI-Powered Toolkit for Academic Success.
+13062052269
info@desklib.com
Available 24*7 on WhatsApp / Email
![[object Object]](/_next/static/media/star-bottom.7253800d.svg)
Unlock your academic potential
Copyright © 2020–2026 A2Z Services. All Rights Reserved. Developed and managed by ZUCOL.