Cost and Revenue Analysis: Internal Reporting and Costing Systems
VerifiedAdded on 2023/02/02
|16
|4052
|59
Report
AI Summary
This report provides a comprehensive analysis of cost and revenue management within an organization. It begins with an introduction to the purpose of internal reporting and its relationship to costing systems. The report then identifies different responsibility centers, cost classifications, and the differences between marginal and absorption costing. The core of the report focuses on recording and analyzing cost information for materials, labor, and expenses, including inventory valuation using FIFO, LIFO, and weighted average methods. Furthermore, it delves into overhead cost allocation, absorption rates, and variance analysis. The report also covers short-term and long-term decision-making processes, including the effect of changing activity levels on unit costs and concludes with an overview of the key takeaways from the analysis. The report also provides an understanding of different costing systems and their implications on financial reporting and decision-making.
Cost and Revenue
Paraphrase This Document
Need a fresh take? Get an instant paraphrase of this document with our AI Paraphraser
Table of Contents
INTRODUCTION......................................................................................................................4
TASK 1......................................................................................................................................4
1.1 Purpose of internal reporting in the organisation.............................................................4
1.2 Relationship between costing system in the organisation................................................5
1.3 Identify the responsibility centres, cost centres, profit centres and investment centres
within an organisation............................................................................................................5
1.4 Explain the characteristics of different types of cost classifications and their use in
costing....................................................................................................................................5
1.5 Explain the differences between marginal and absorption costing..................................6
TASK 2......................................................................................................................................6
2.1 Record cost information for material, labour and expenses in accordance with the........6
organisation’s costing procedures..........................................................................................6
2.2 Analyse cost information for material, labour and expenses in accordance with the......6
organisation’s costing procedures..........................................................................................6
2.3 Define the various stages of inventory.............................................................................6
2.4 Value inventory using these methods:.............................................................................7
2.5 Describe the behaviour of these costs:.............................................................................8
2.6 Record cost information using these costing systems......................................................9
TASK 3......................................................................................................................................9
3.1Attribute overhead costs to production and service cost centres in accordance with
agreed bases of allocation and apportionment.......................................................................9
3.2 Calculate overhead absorption rates.................................................................................9
3.3 Make adjustments for under or over recovered overhead costs in accordance with
established procedures.........................................................................................................11
3.4 Review methods of allocation, apportionment and absorption at regular intervals,......12
implementing agreed changes to methods...........................................................................12
3.5 Communicate with relevant staff to resolve any queries in overhead cost data...........13
TASK 4....................................................................................................................................13
4.1 Compare budget costs with actual costs, noting any variances.....................................13
4.2 Analyse variances for management reports...................................................................13
4.3 Provide information for budget holders for the significant variances............................14
4.4Prepare management reports...........................................................................................14
Start with the end in mind....................................................................................................14
TASK 5....................................................................................................................................14
5.1 Present estimates of future income and cost for decision making:................................14
5.2Explain the effect of changing activity levels on unit costs...........................................15
5.3 Calculate the effect of changing activity levels on unit costs........................................15
5.4 Identify factors affecting short-term and long term decision making............................15
CONCLUSION........................................................................................................................15
REFERENCES.........................................................................................................................16
⊘ This is a preview!⊘
Do you want full access?
Subscribe today to unlock all pages.
Trusted by 1+ million students worldwide
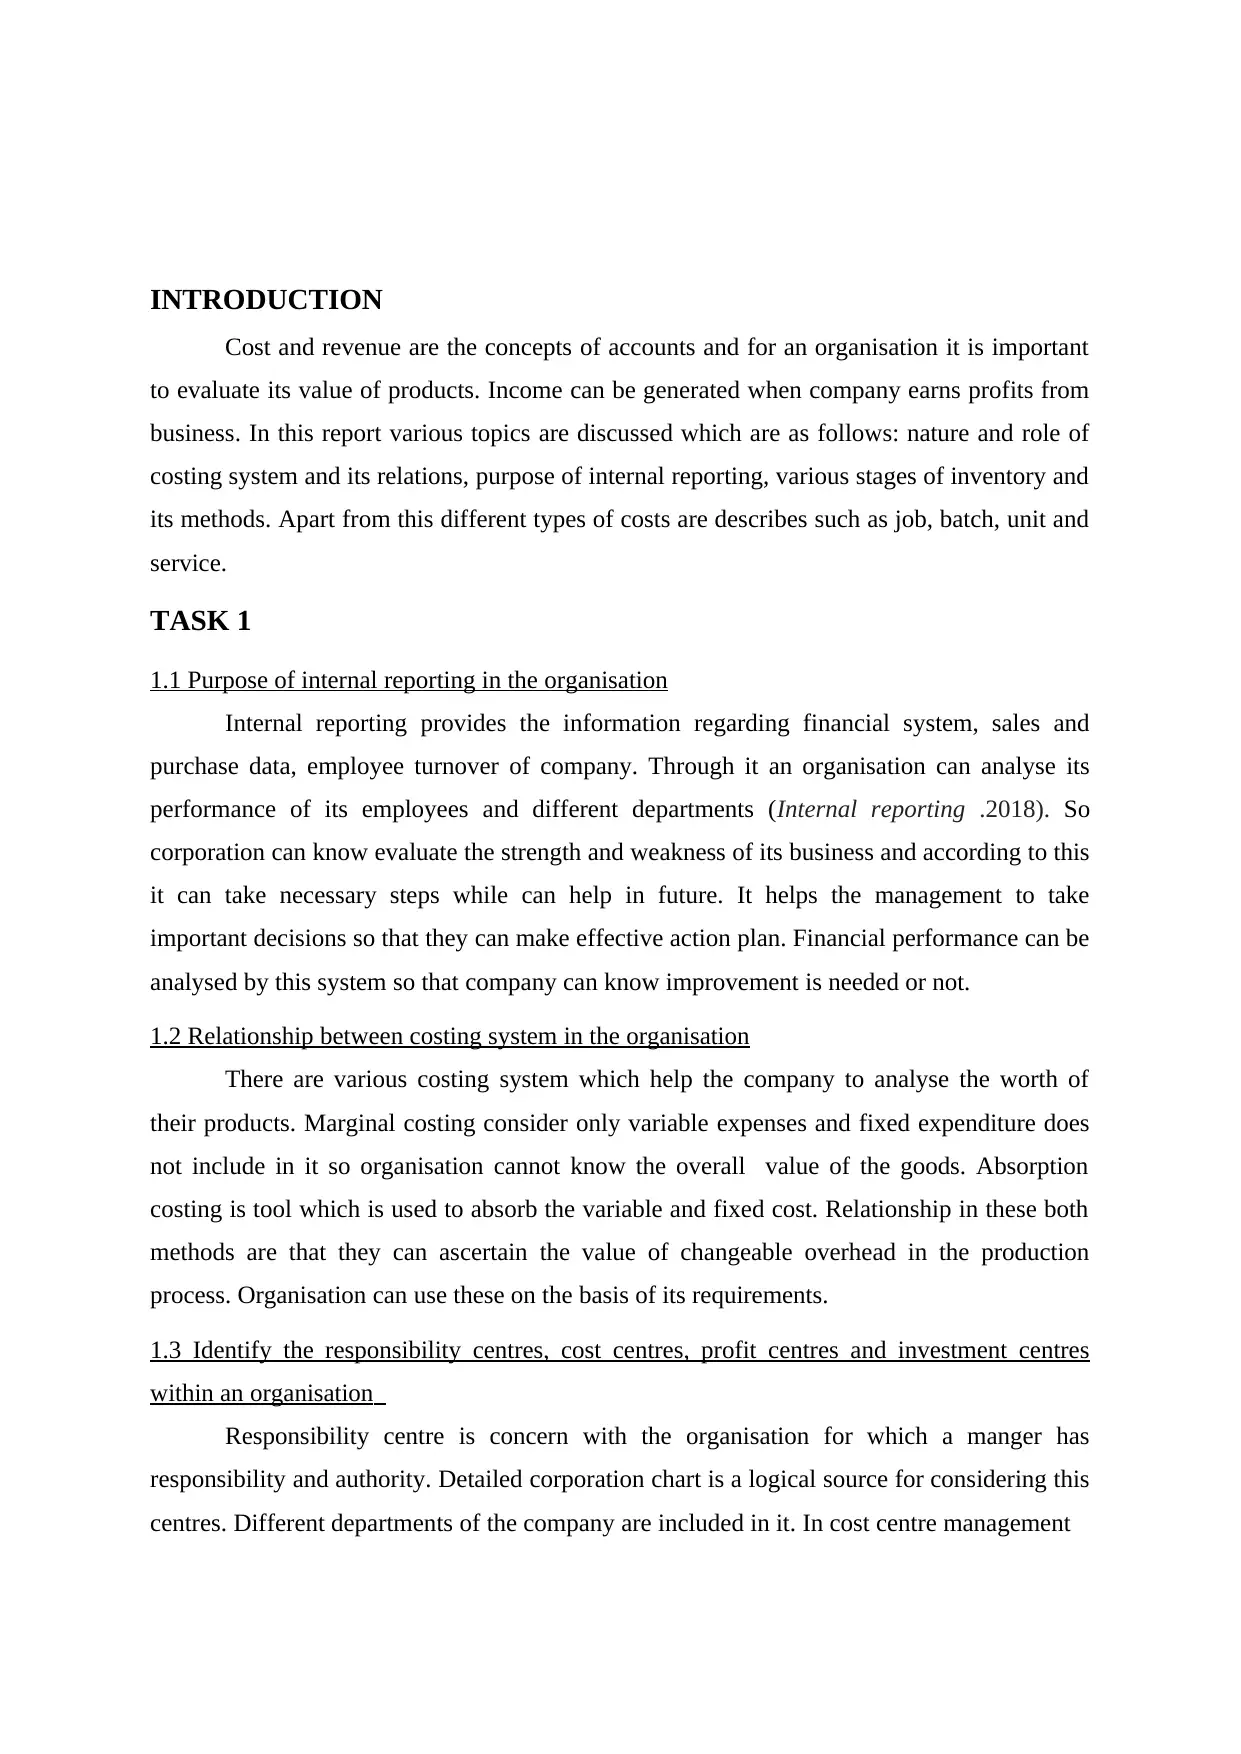
INTRODUCTION
Cost and revenue are the concepts of accounts and for an organisation it is important
to evaluate its value of products. Income can be generated when company earns profits from
business. In this report various topics are discussed which are as follows: nature and role of
costing system and its relations, purpose of internal reporting, various stages of inventory and
its methods. Apart from this different types of costs are describes such as job, batch, unit and
service.
TASK 1
1.1 Purpose of internal reporting in the organisation
Internal reporting provides the information regarding financial system, sales and
purchase data, employee turnover of company. Through it an organisation can analyse its
performance of its employees and different departments (Internal reporting .2018). So
corporation can know evaluate the strength and weakness of its business and according to this
it can take necessary steps while can help in future. It helps the management to take
important decisions so that they can make effective action plan. Financial performance can be
analysed by this system so that company can know improvement is needed or not.
1.2 Relationship between costing system in the organisation
There are various costing system which help the company to analyse the worth of
their products. Marginal costing consider only variable expenses and fixed expenditure does
not include in it so organisation cannot know the overall value of the goods. Absorption
costing is tool which is used to absorb the variable and fixed cost. Relationship in these both
methods are that they can ascertain the value of changeable overhead in the production
process. Organisation can use these on the basis of its requirements.
1.3 Identify the responsibility centres, cost centres, profit centres and investment centres
within an organisation
Responsibility centre is concern with the organisation for which a manger has
responsibility and authority. Detailed corporation chart is a logical source for considering this
centres. Different departments of the company are included in it. In cost centre management
Paraphrase This Document
Need a fresh take? Get an instant paraphrase of this document with our AI Paraphraser
of department only accountable to control the cost in the company and it does not directly
related to the profits.
Profit centre: It is a division of an organisation who is responsible to control the profits and
manager put its all efforts to maximize the revenue. They takes important decision related to
the operating expenditure and price of products.
Investment centres: A unit in the company who is accountable for the investment and try to
maximize the returns from it.
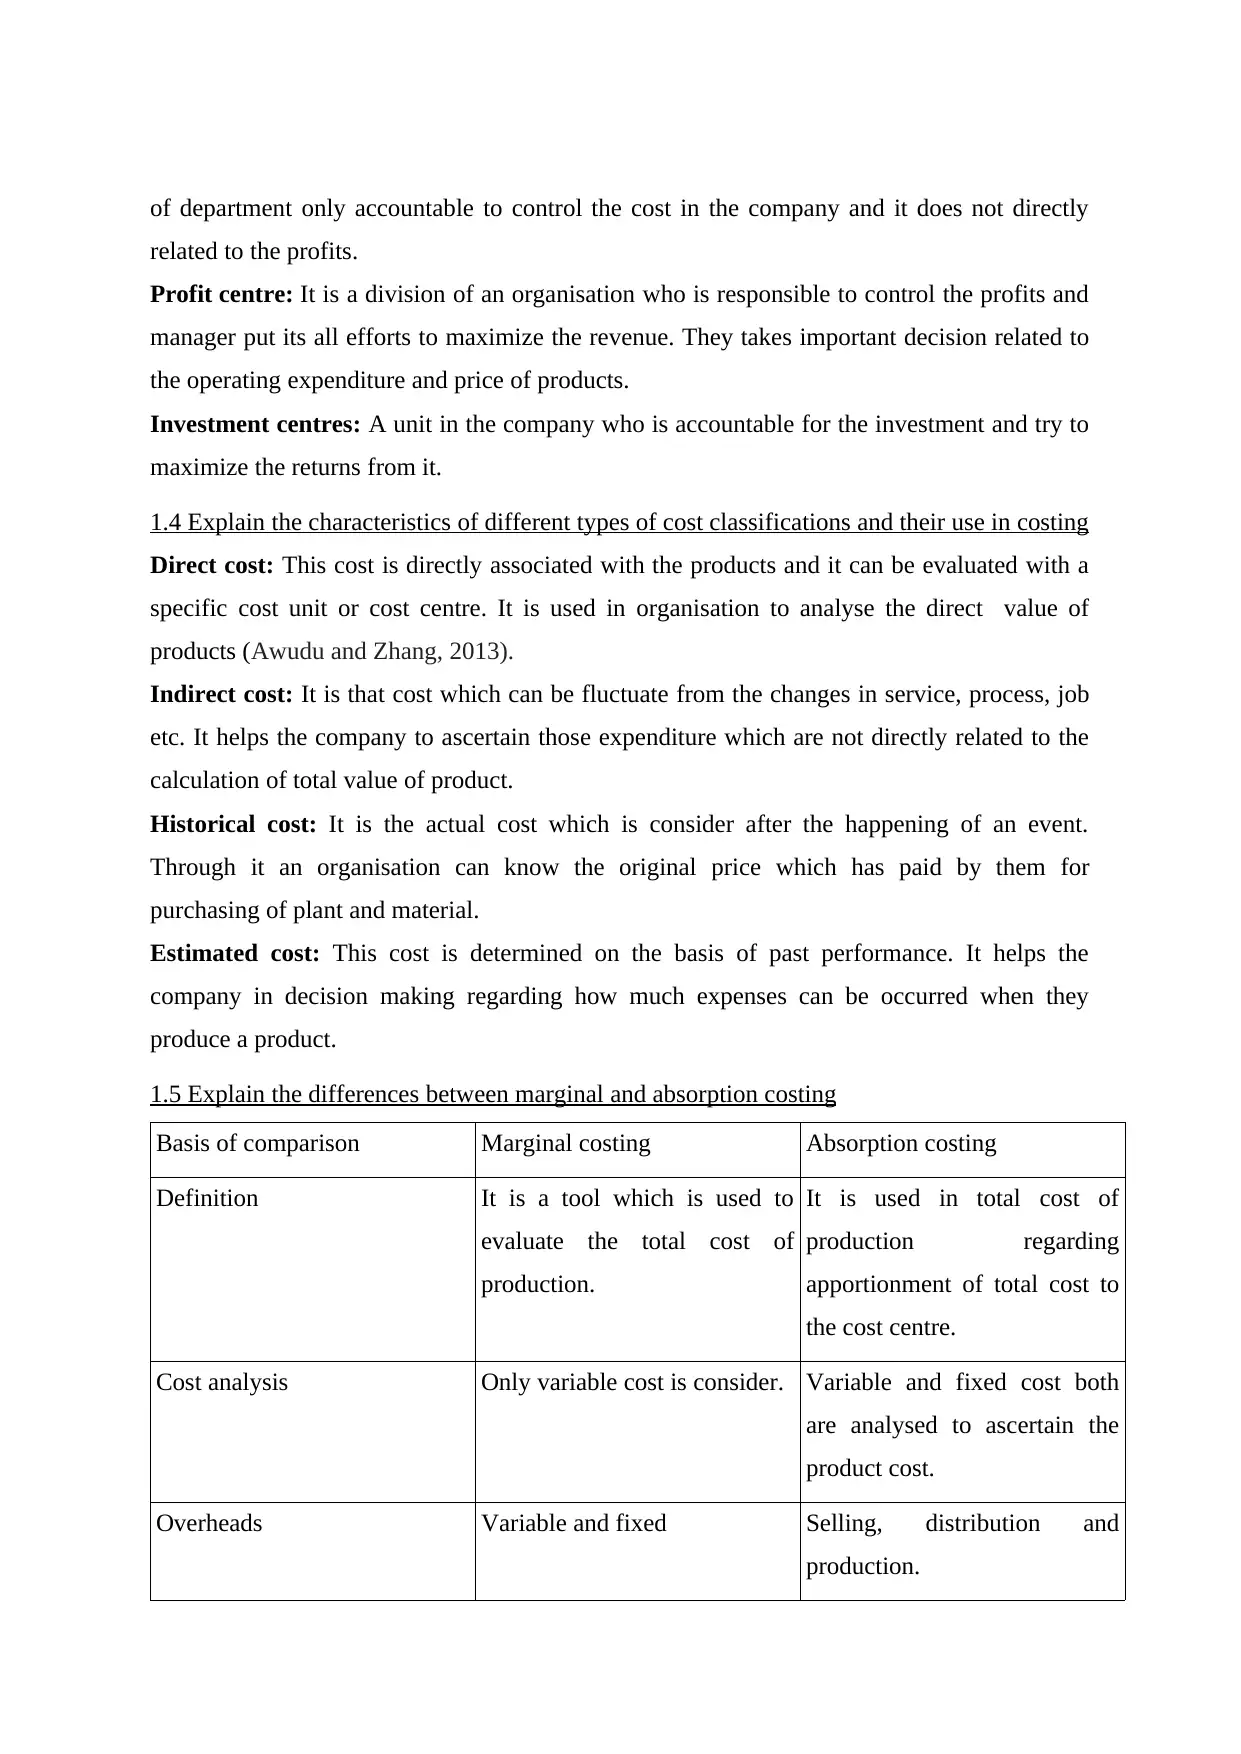
1.4 Explain the characteristics of different types of cost classifications and their use in costing
Direct cost: This cost is directly associated with the products and it can be evaluated with a
specific cost unit or cost centre. It is used in organisation to analyse the direct value of
products (Awudu and Zhang, 2013).
Indirect cost: It is that cost which can be fluctuate from the changes in service, process, job
etc. It helps the company to ascertain those expenditure which are not directly related to the
calculation of total value of product.
Historical cost: It is the actual cost which is consider after the happening of an event.
Through it an organisation can know the original price which has paid by them for
purchasing of plant and material.
Estimated cost: This cost is determined on the basis of past performance. It helps the
company in decision making regarding how much expenses can be occurred when they
produce a product.
1.5 Explain the differences between marginal and absorption costing
Basis of comparison Marginal costing Absorption costing
Definition It is a tool which is used to
evaluate the total cost of
production.
It is used in total cost of
production regarding
apportionment of total cost to
the cost centre.
Cost analysis Only variable cost is consider. Variable and fixed cost both
are analysed to ascertain the
product cost.
Overheads Variable and fixed Selling, distribution and
production.
related to the profits.
Profit centre: It is a division of an organisation who is responsible to control the profits and
manager put its all efforts to maximize the revenue. They takes important decision related to
the operating expenditure and price of products.
Investment centres: A unit in the company who is accountable for the investment and try to
maximize the returns from it.
1.4 Explain the characteristics of different types of cost classifications and their use in costing
Direct cost: This cost is directly associated with the products and it can be evaluated with a
specific cost unit or cost centre. It is used in organisation to analyse the direct value of
products (Awudu and Zhang, 2013).
Indirect cost: It is that cost which can be fluctuate from the changes in service, process, job
etc. It helps the company to ascertain those expenditure which are not directly related to the
calculation of total value of product.
Historical cost: It is the actual cost which is consider after the happening of an event.
Through it an organisation can know the original price which has paid by them for
purchasing of plant and material.
Estimated cost: This cost is determined on the basis of past performance. It helps the
company in decision making regarding how much expenses can be occurred when they
produce a product.
1.5 Explain the differences between marginal and absorption costing
Basis of comparison Marginal costing Absorption costing
Definition It is a tool which is used to
evaluate the total cost of
production.
It is used in total cost of
production regarding
apportionment of total cost to
the cost centre.
Cost analysis Only variable cost is consider. Variable and fixed cost both
are analysed to ascertain the
product cost.
Overheads Variable and fixed Selling, distribution and
production.
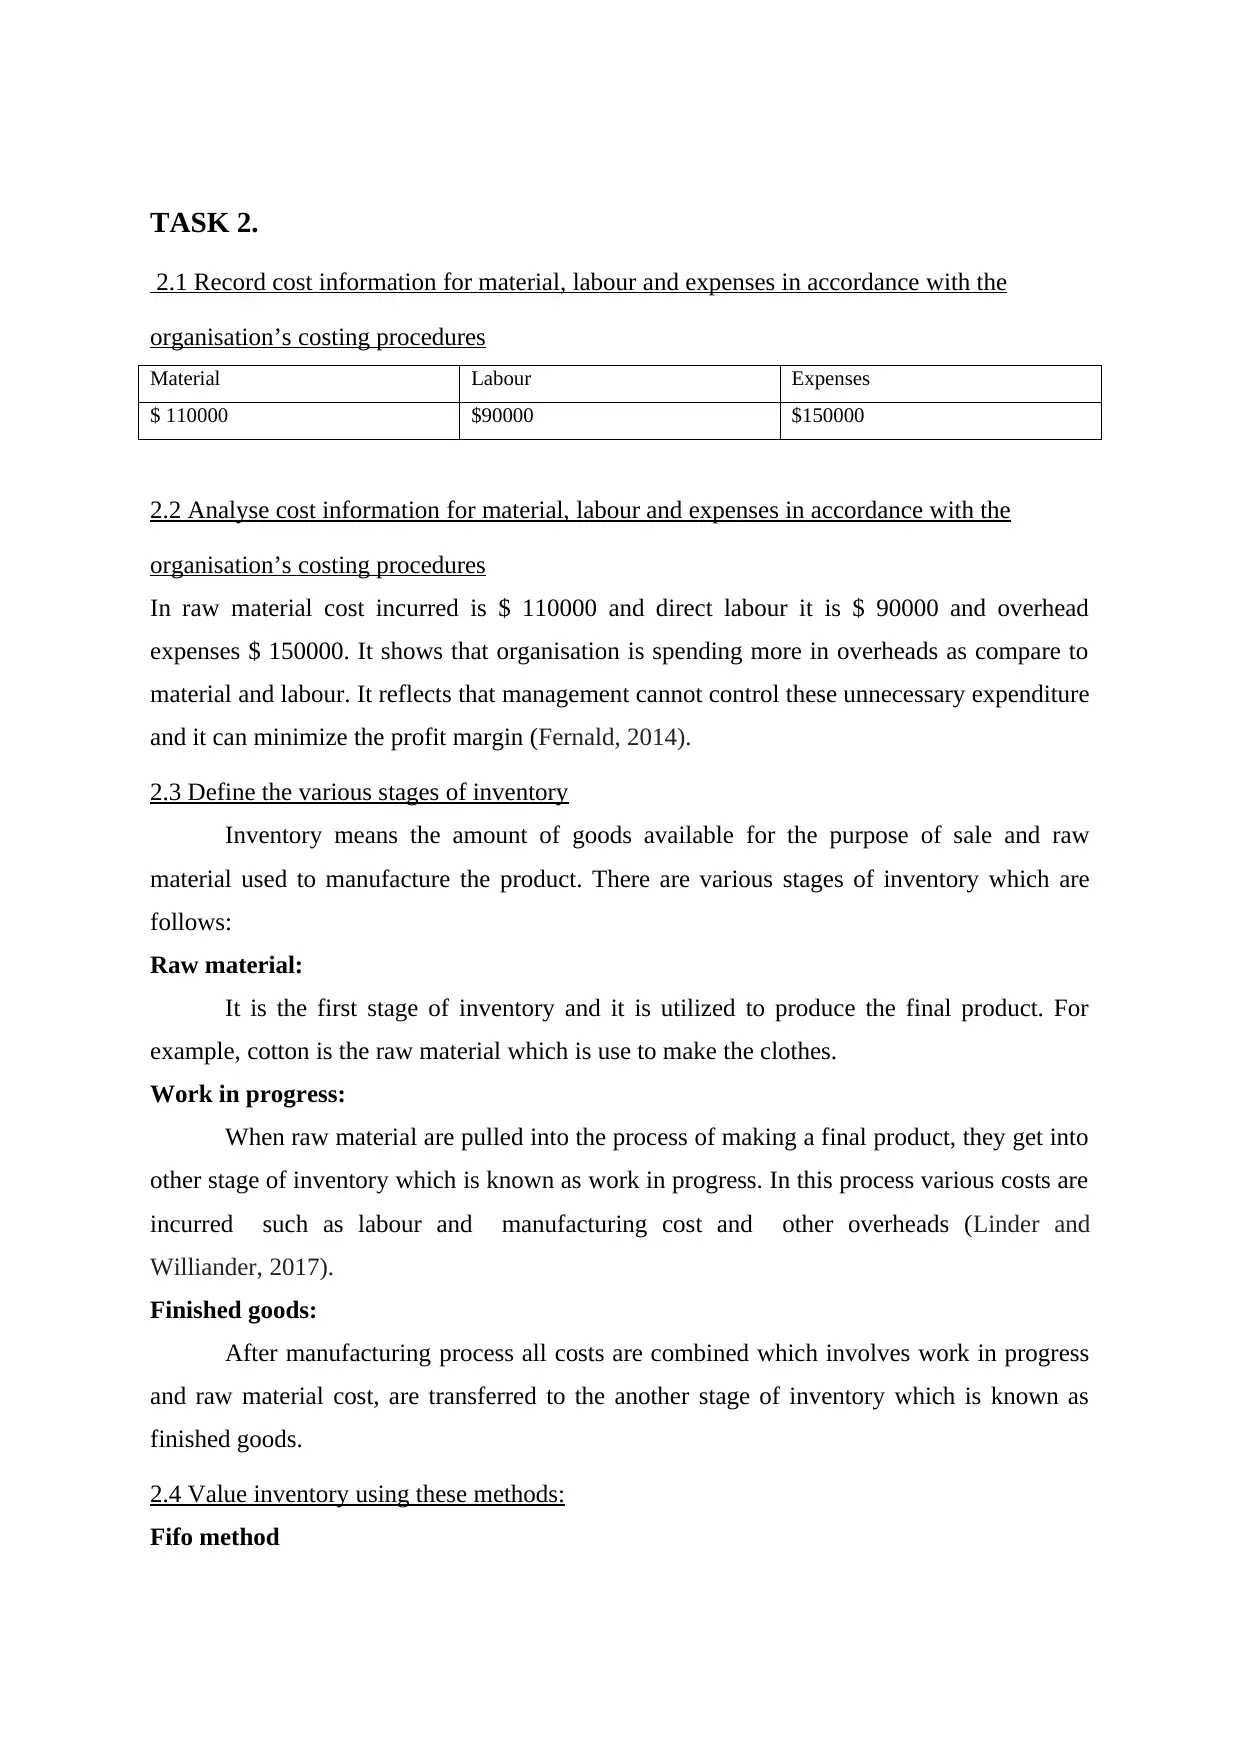
TASK 2.
2.1 Record cost information for material, labour and expenses in accordance with the
organisation’s costing procedures
Material Labour Expenses
$ 110000 $90000 $150000
2.2 Analyse cost information for material, labour and expenses in accordance with the
organisation’s costing procedures
In raw material cost incurred is $ 110000 and direct labour it is $ 90000 and overhead
expenses $ 150000. It shows that organisation is spending more in overheads as compare to
material and labour. It reflects that management cannot control these unnecessary expenditure
and it can minimize the profit margin (Fernald, 2014).
2.3 Define the various stages of inventory
Inventory means the amount of goods available for the purpose of sale and raw
material used to manufacture the product. There are various stages of inventory which are
follows:
Raw material:
It is the first stage of inventory and it is utilized to produce the final product. For
example, cotton is the raw material which is use to make the clothes.
Work in progress:
When raw material are pulled into the process of making a final product, they get into
other stage of inventory which is known as work in progress. In this process various costs are
incurred such as labour and manufacturing cost and other overheads (Linder and
Williander, 2017).
Finished goods:
After manufacturing process all costs are combined which involves work in progress
and raw material cost, are transferred to the another stage of inventory which is known as
finished goods.
2.4 Value inventory using these methods:
Fifo method
⊘ This is a preview!⊘
Do you want full access?
Subscribe today to unlock all pages.
Trusted by 1+ million students worldwide
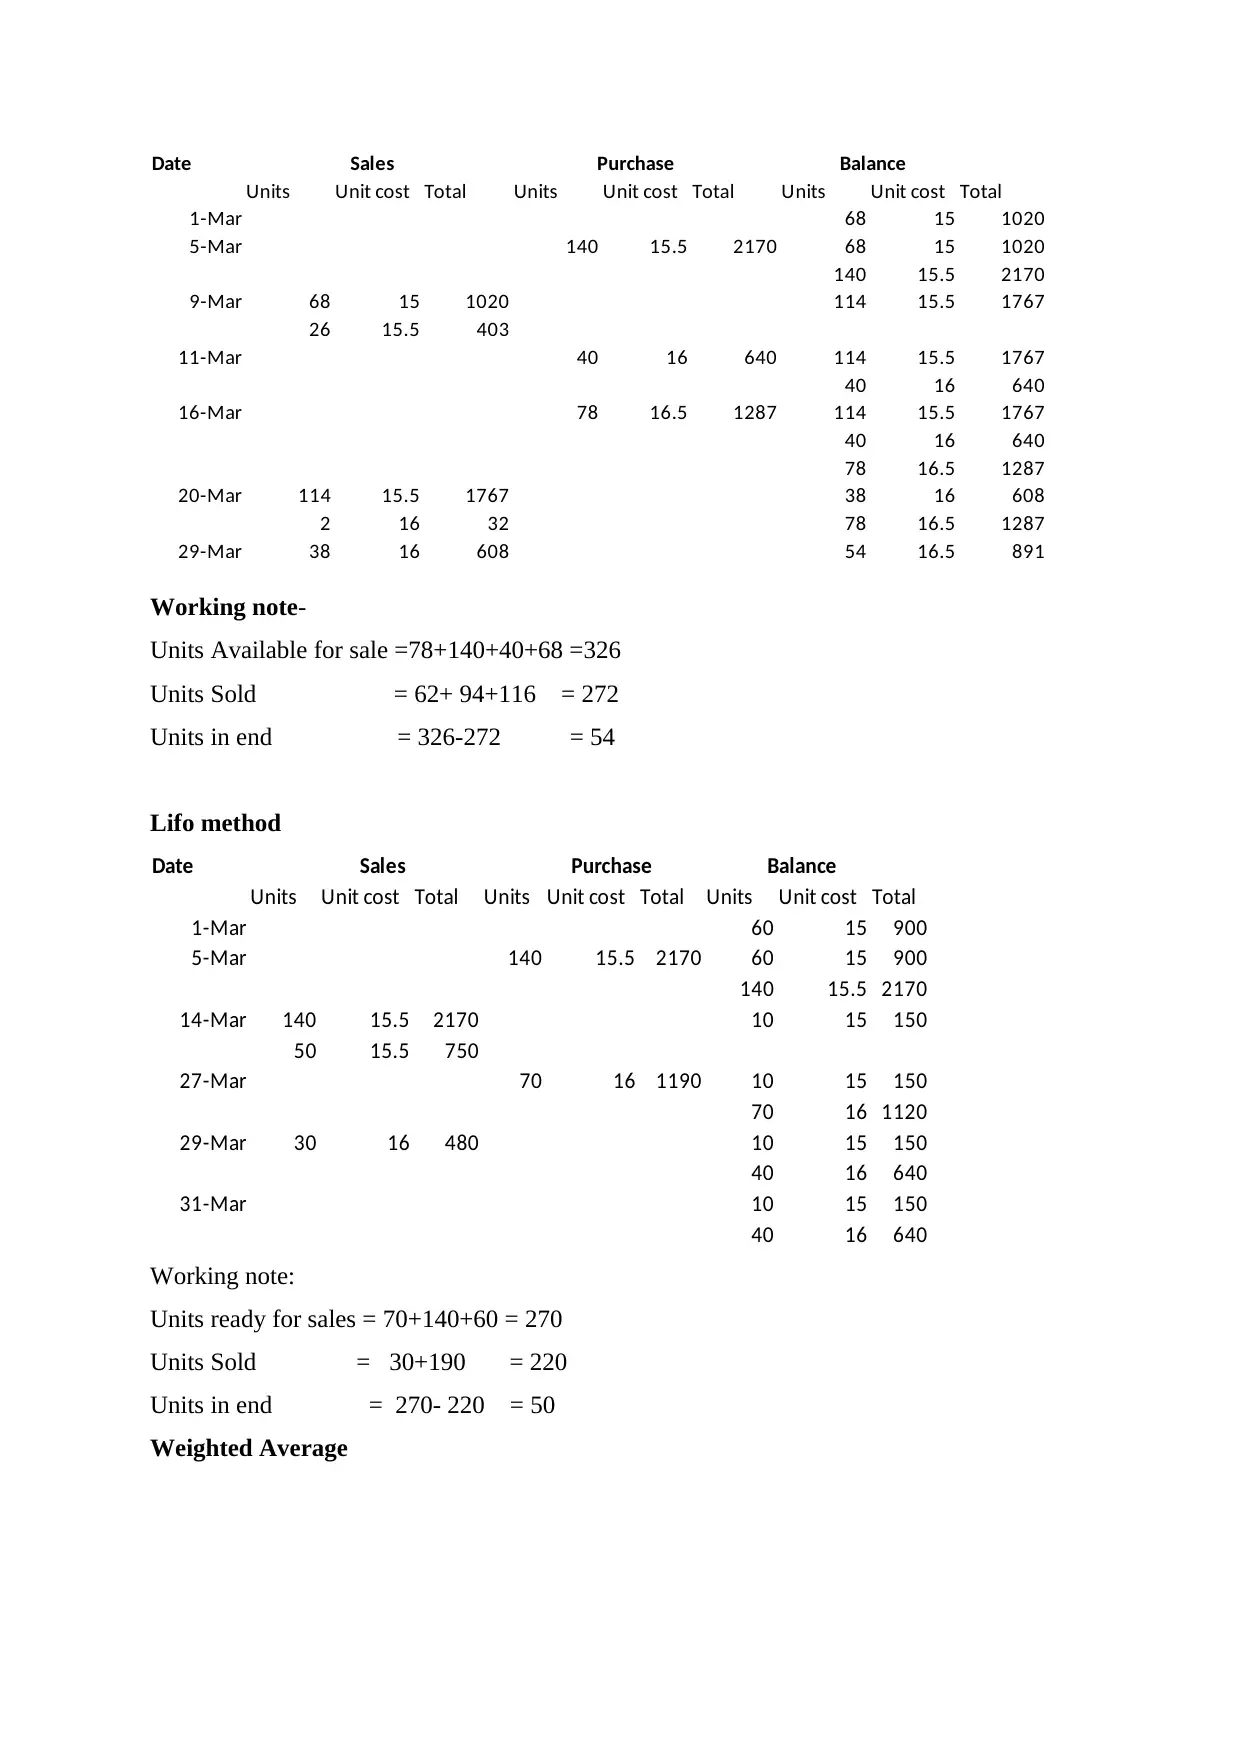
Date Sales Purchase Balance
Units Unit cost Total Units Unit cost Total Units Unit cost Total
1-Mar 68 15 1020
5-Mar 140 15.5 2170 68 15 1020
140 15.5 2170
9-Mar 68 15 1020 114 15.5 1767
26 15.5 403
11-Mar 40 16 640 114 15.5 1767
40 16 640
16-Mar 78 16.5 1287 114 15.5 1767
40 16 640
78 16.5 1287
20-Mar 114 15.5 1767 38 16 608
2 16 32 78 16.5 1287
29-Mar 38 16 608 54 16.5 891
Working note-
Units Available for sale =78+140+40+68 =326
Units Sold = 62+ 94+116 = 272
Units in end = 326-272 = 54
Lifo method
Date Sales Purchase Balance
Units Unit cost Total Units Unit cost Total Units Unit cost Total
1-Mar 60 15 900
5-Mar 140 15.5 2170 60 15 900
140 15.5 2170
14-Mar 140 15.5 2170 10 15 150
50 15.5 750
27-Mar 70 16 1190 10 15 150
70 16 1120
29-Mar 30 16 480 10 15 150
40 16 640
31-Mar 10 15 150
40 16 640
Working note:
Units ready for sales = 70+140+60 = 270
Units Sold = 30+190 = 220
Units in end = 270- 220 = 50
Weighted Average
Units Unit cost Total Units Unit cost Total Units Unit cost Total
1-Mar 68 15 1020
5-Mar 140 15.5 2170 68 15 1020
140 15.5 2170
9-Mar 68 15 1020 114 15.5 1767
26 15.5 403
11-Mar 40 16 640 114 15.5 1767
40 16 640
16-Mar 78 16.5 1287 114 15.5 1767
40 16 640
78 16.5 1287
20-Mar 114 15.5 1767 38 16 608
2 16 32 78 16.5 1287
29-Mar 38 16 608 54 16.5 891
Working note-
Units Available for sale =78+140+40+68 =326
Units Sold = 62+ 94+116 = 272
Units in end = 326-272 = 54
Lifo method
Date Sales Purchase Balance
Units Unit cost Total Units Unit cost Total Units Unit cost Total
1-Mar 60 15 900
5-Mar 140 15.5 2170 60 15 900
140 15.5 2170
14-Mar 140 15.5 2170 10 15 150
50 15.5 750
27-Mar 70 16 1190 10 15 150
70 16 1120
29-Mar 30 16 480 10 15 150
40 16 640
31-Mar 10 15 150
40 16 640
Working note:
Units ready for sales = 70+140+60 = 270
Units Sold = 30+190 = 220
Units in end = 270- 220 = 50
Weighted Average
Paraphrase This Document
Need a fresh take? Get an instant paraphrase of this document with our AI Paraphraser
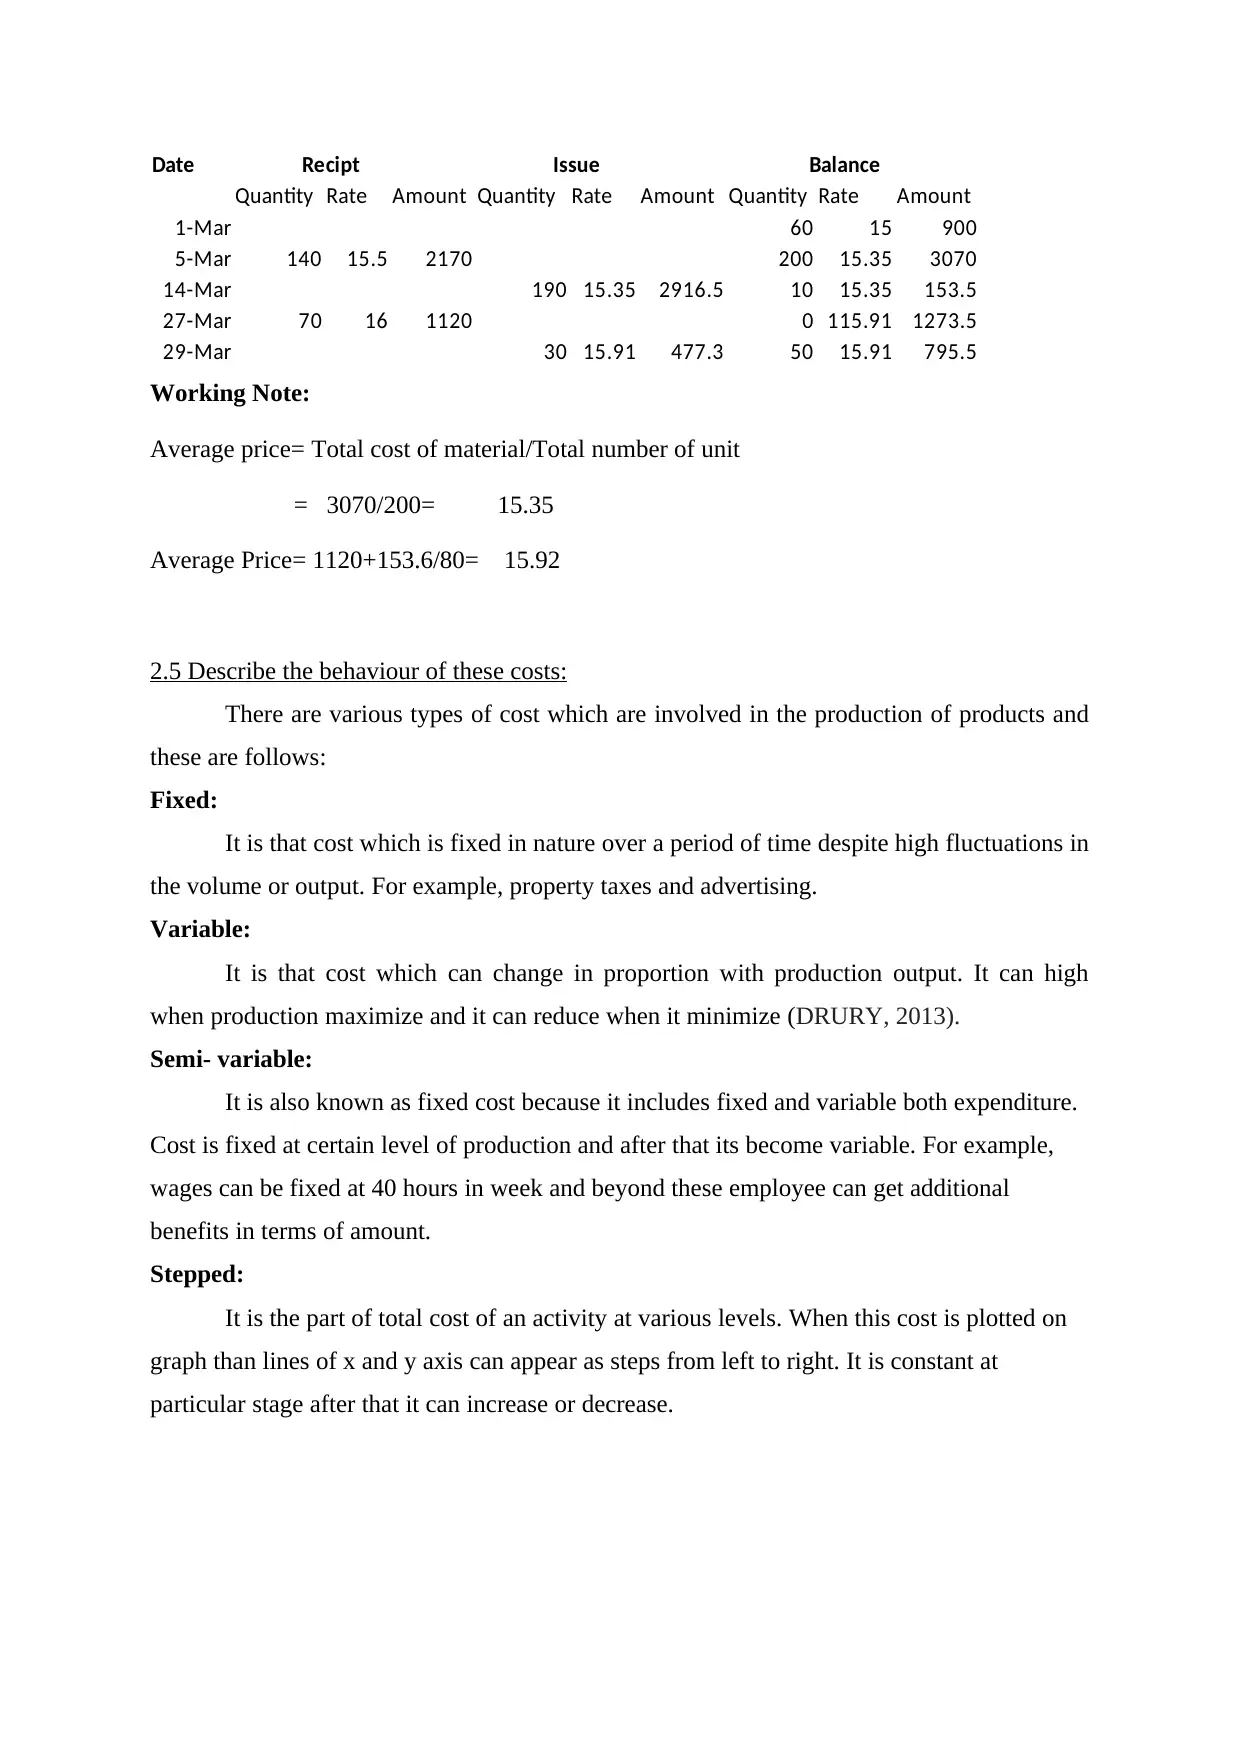
Date Recipt Issue Balance
Quantity Rate Amount Quantity Rate Amount Quantity Rate Amount
1-Mar 60 15 900
5-Mar 140 15.5 2170 200 15.35 3070
14-Mar 190 15.35 2916.5 10 15.35 153.5
27-Mar 70 16 1120 0 115.91 1273.5
29-Mar 30 15.91 477.3 50 15.91 795.5
Working Note:
Average price= Total cost of material/Total number of unit
= 3070/200= 15.35
Average Price= 1120+153.6/80= 15.92
2.5 Describe the behaviour of these costs:
There are various types of cost which are involved in the production of products and
these are follows:
Fixed:
It is that cost which is fixed in nature over a period of time despite high fluctuations in
the volume or output. For example, property taxes and advertising.
Variable:
It is that cost which can change in proportion with production output. It can high
when production maximize and it can reduce when it minimize (DRURY, 2013).
Semi- variable:
It is also known as fixed cost because it includes fixed and variable both expenditure.
Cost is fixed at certain level of production and after that its become variable. For example,
wages can be fixed at 40 hours in week and beyond these employee can get additional
benefits in terms of amount.
Stepped:
It is the part of total cost of an activity at various levels. When this cost is plotted on
graph than lines of x and y axis can appear as steps from left to right. It is constant at
particular stage after that it can increase or decrease.
2.6 Record cost information using these costing systems
TASK 3.
3.1Attribute overhead costs to production and service cost centres in accordance with agreed
bases of allocation and apportionment
There are various types of cost which are occurred in the production of goods and
services. It is described as follows:
Direct: It is that cost which is directly related to the production of products. Depreciation is
difficult to assign for a particular product. Example, commission paid to suppliers.
Step down: This method assign the cost of a services departments to other operating
departments in the company (Saebi and Foss, 2015).
For example, an organisation gives ranks to its services departments by the percentage
of expenditure which are consumed by others departments. Rank is given on the basis of cost
allocation.
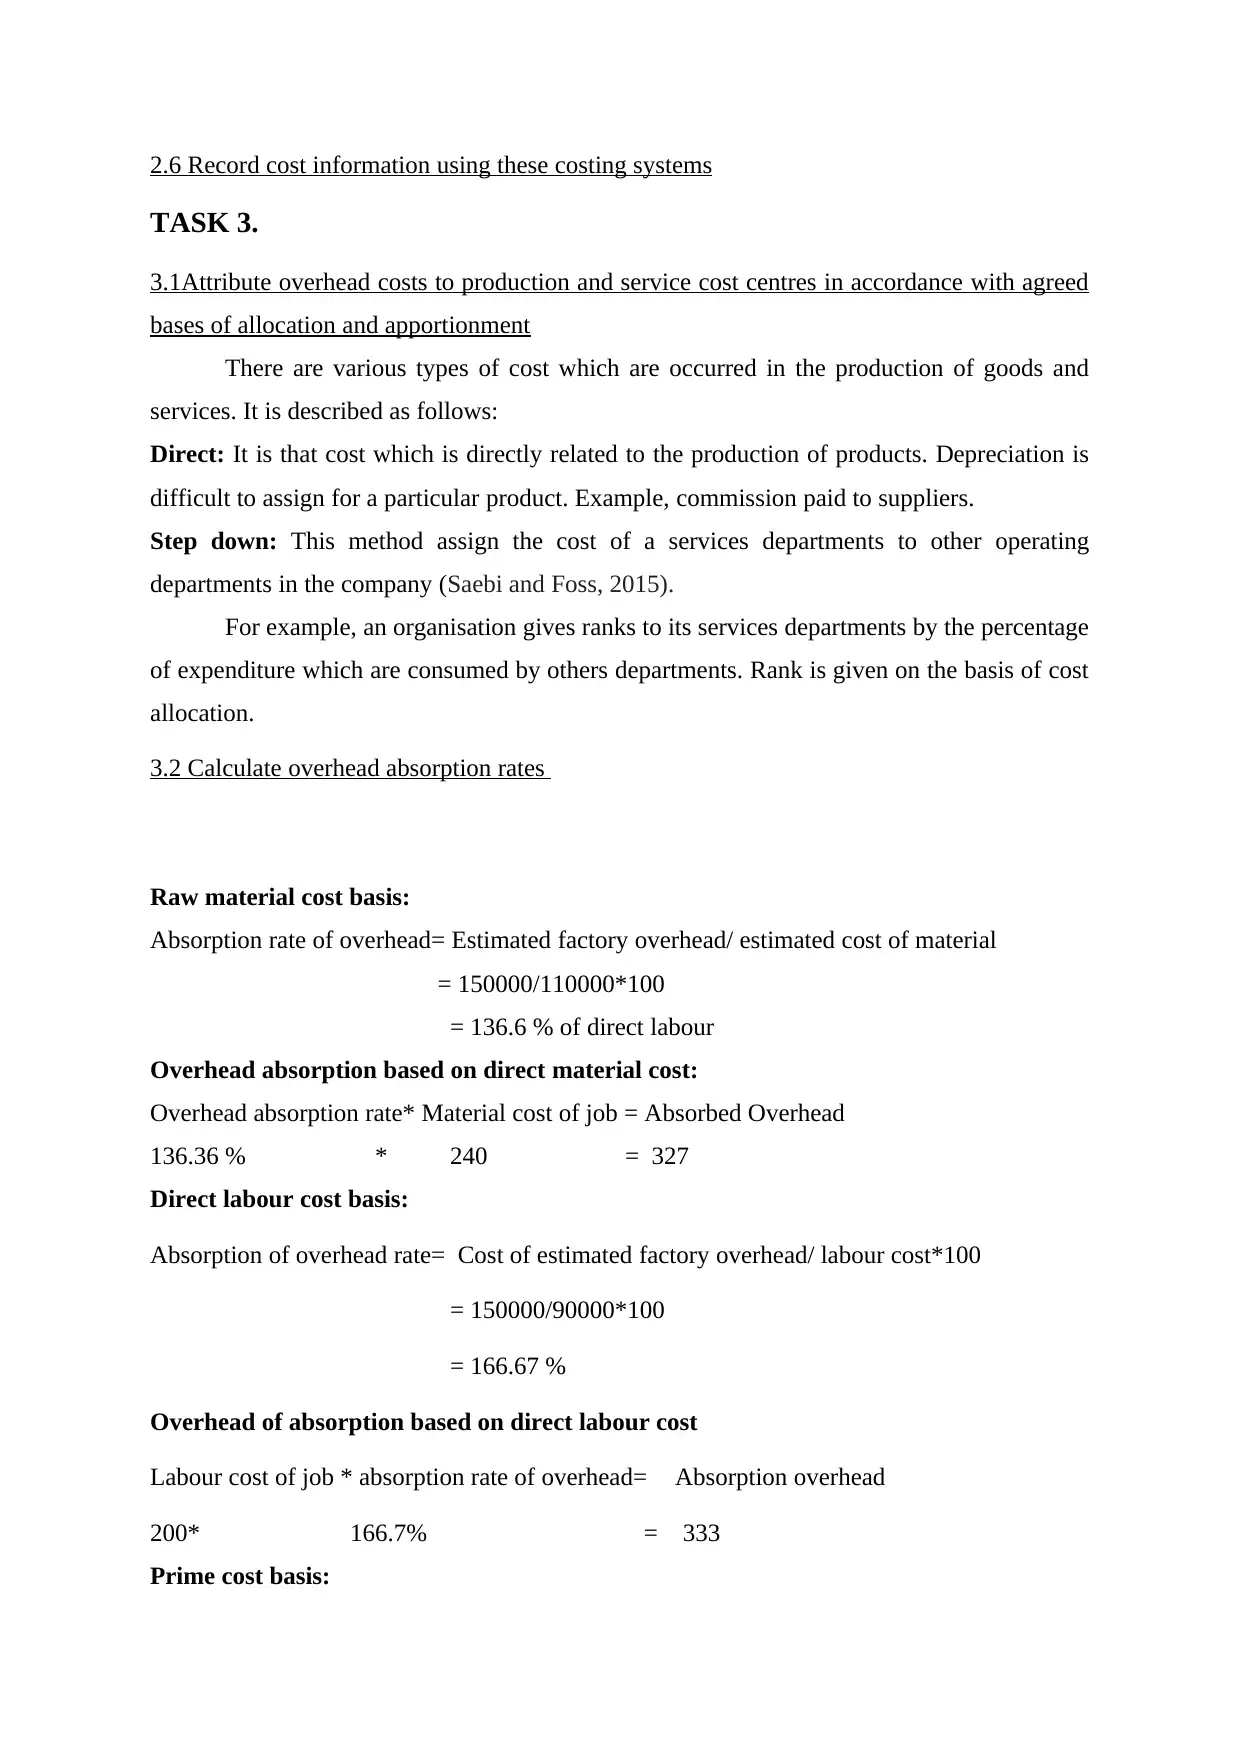
3.2 Calculate overhead absorption rates
Raw material cost basis:
Absorption rate of overhead= Estimated factory overhead/ estimated cost of material
= 150000/110000*100
= 136.6 % of direct labour
Overhead absorption based on direct material cost:
Overhead absorption rate* Material cost of job = Absorbed Overhead
136.36 % * 240 = 327
Direct labour cost basis:
Absorption of overhead rate= Cost of estimated factory overhead/ labour cost*100
= 150000/90000*100
= 166.67 %
Overhead of absorption based on direct labour cost
Labour cost of job * absorption rate of overhead= Absorption overhead
200* 166.7% = 333
Prime cost basis:
TASK 3.
3.1Attribute overhead costs to production and service cost centres in accordance with agreed
bases of allocation and apportionment
There are various types of cost which are occurred in the production of goods and
services. It is described as follows:
Direct: It is that cost which is directly related to the production of products. Depreciation is
difficult to assign for a particular product. Example, commission paid to suppliers.
Step down: This method assign the cost of a services departments to other operating
departments in the company (Saebi and Foss, 2015).
For example, an organisation gives ranks to its services departments by the percentage
of expenditure which are consumed by others departments. Rank is given on the basis of cost
allocation.
3.2 Calculate overhead absorption rates
Raw material cost basis:
Absorption rate of overhead= Estimated factory overhead/ estimated cost of material
= 150000/110000*100
= 136.6 % of direct labour
Overhead absorption based on direct material cost:
Overhead absorption rate* Material cost of job = Absorbed Overhead
136.36 % * 240 = 327
Direct labour cost basis:
Absorption of overhead rate= Cost of estimated factory overhead/ labour cost*100
= 150000/90000*100
= 166.67 %
Overhead of absorption based on direct labour cost
Labour cost of job * absorption rate of overhead= Absorption overhead
200* 166.7% = 333
Prime cost basis:
⊘ This is a preview!⊘
Do you want full access?
Subscribe today to unlock all pages.
Trusted by 1+ million students worldwide
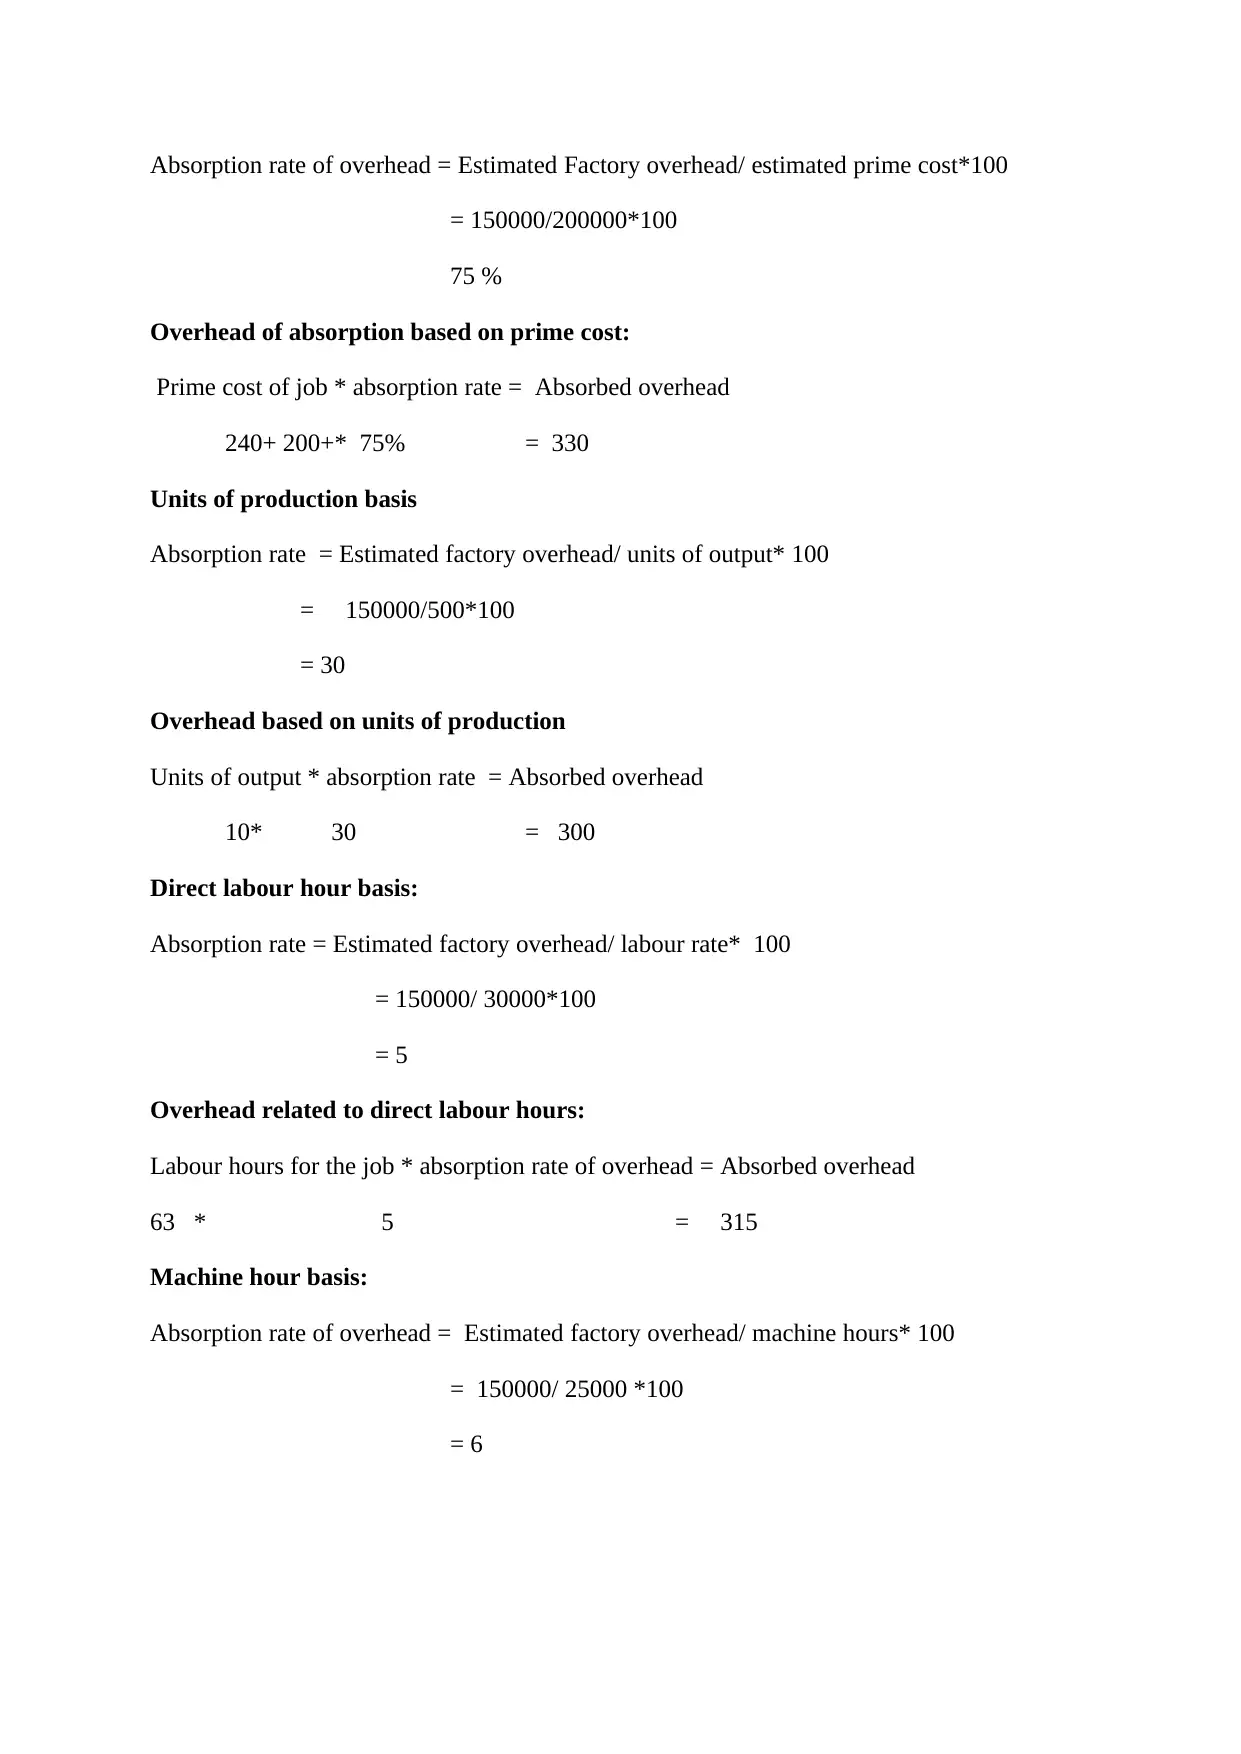
Absorption rate of overhead = Estimated Factory overhead/ estimated prime cost*100
= 150000/200000*100
75 %
Overhead of absorption based on prime cost:
Prime cost of job * absorption rate = Absorbed overhead
240+ 200+* 75% = 330
Units of production basis
Absorption rate = Estimated factory overhead/ units of output* 100
= 150000/500*100
= 30
Overhead based on units of production
Units of output * absorption rate = Absorbed overhead
10* 30 = 300
Direct labour hour basis:
Absorption rate = Estimated factory overhead/ labour rate* 100
= 150000/ 30000*100
= 5
Overhead related to direct labour hours:
Labour hours for the job * absorption rate of overhead = Absorbed overhead
63 * 5 = 315
Machine hour basis:
Absorption rate of overhead = Estimated factory overhead/ machine hours* 100
= 150000/ 25000 *100
= 6
Paraphrase This Document
Need a fresh take? Get an instant paraphrase of this document with our AI Paraphraser
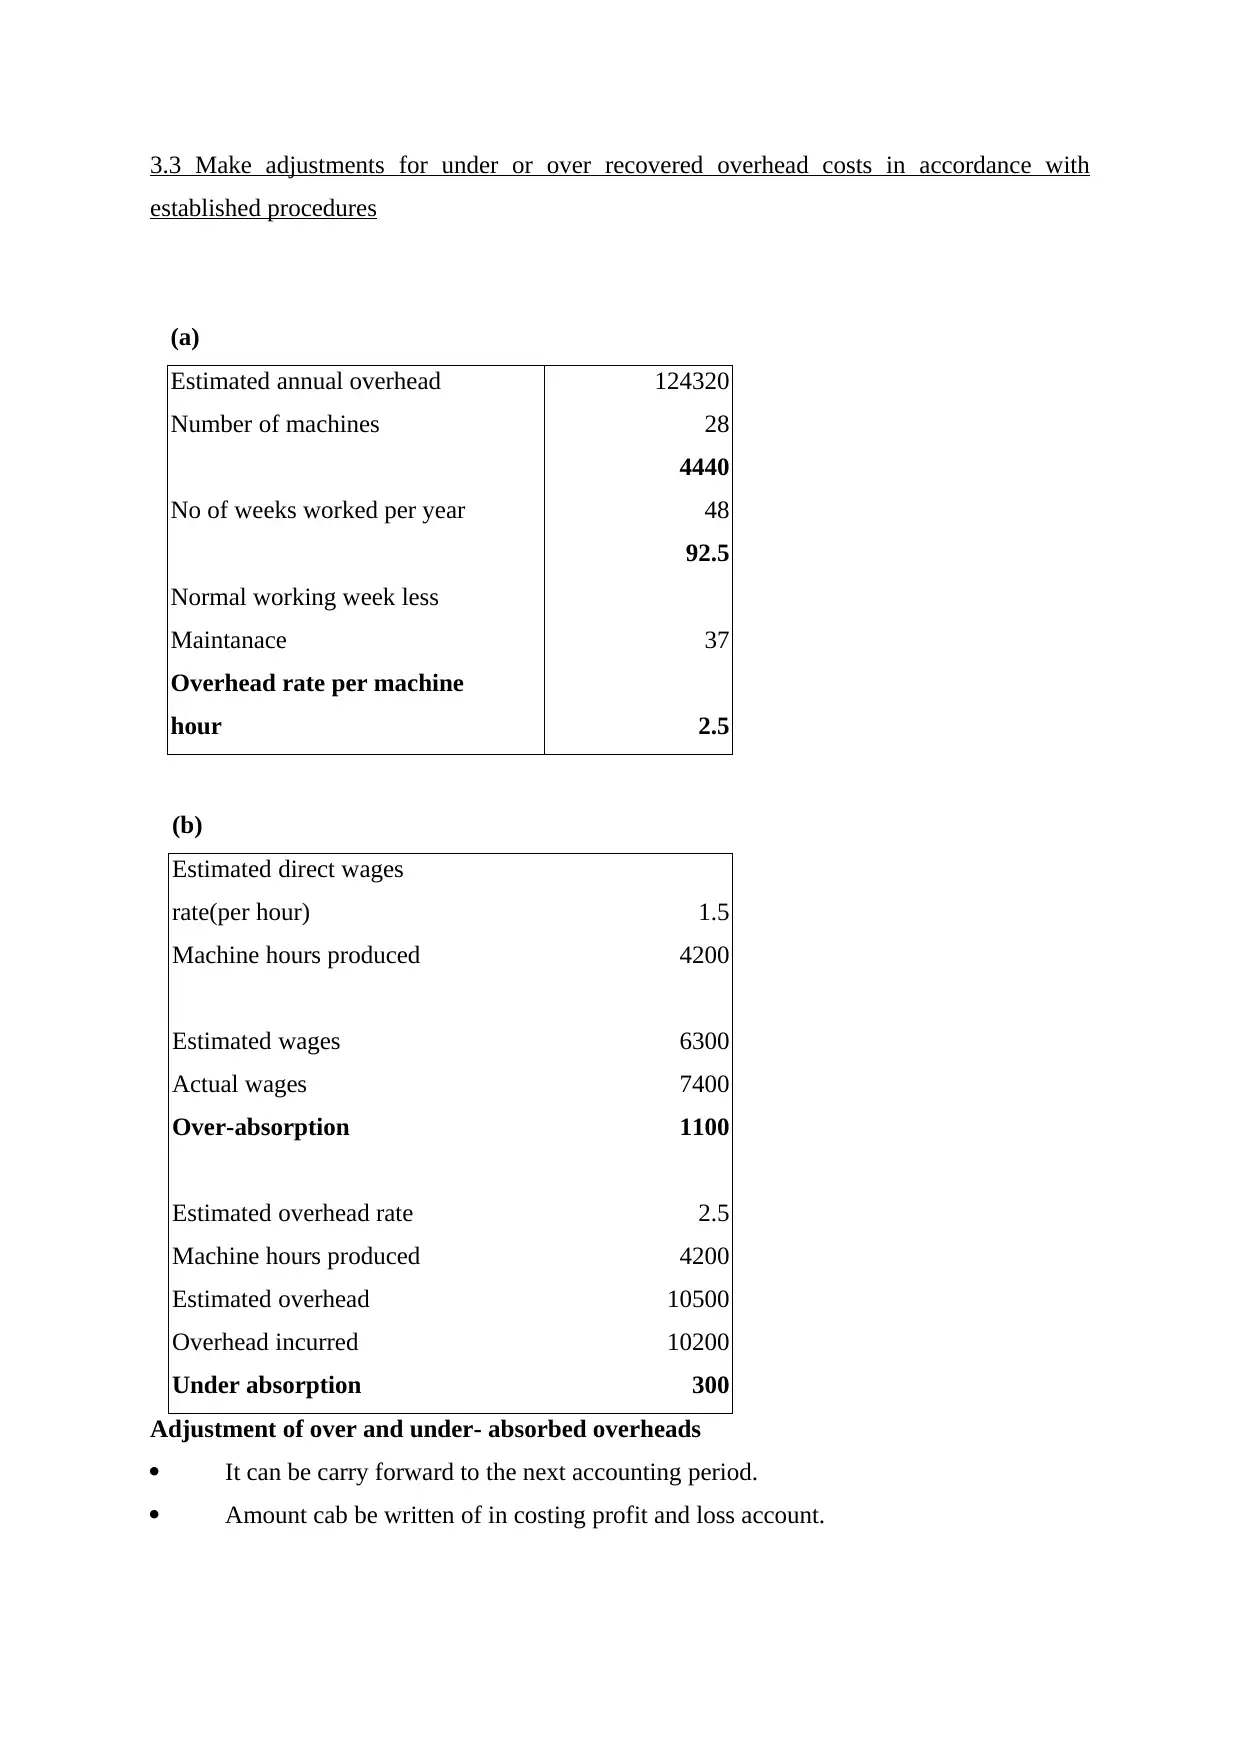
3.3 Make adjustments for under or over recovered overhead costs in accordance with
established procedures
(a)
Estimated annual overhead 124320
Number of machines 28
4440
No of weeks worked per year 48
92.5
Normal working week less
Maintanace 37
Overhead rate per machine
hour 2.5
(b)
Estimated direct wages
rate(per hour) 1.5
Machine hours produced 4200
Estimated wages 6300
Actual wages 7400
Over-absorption 1100
Estimated overhead rate 2.5
Machine hours produced 4200
Estimated overhead 10500
Overhead incurred 10200
Under absorption 300
Adjustment of over and under- absorbed overheads
It can be carry forward to the next accounting period.
Amount cab be written of in costing profit and loss account.
3.4 Review methods of allocation, apportionment and absorption at regular intervals,
implementing agreed changes to methods
There are various methods of allocation which are use to allocate factory overhead
costs to units of production. These are as follows:
Direct labour:
It is usable when amount of direct labour consumed by a unit of production. They are
involve in the manufacturing of goods.
Machine time:
The cost is incurred when machine operates for the purpose of production of goods
and services. If it consume more time than expenses will maximize.
Apportionment: It a used in cost allocation where organisation can ascertain the cost
involvement in the production. It has divided as many parts which are as follows:
Direct allocation:
These are those overheads which are directly allocated to various departments on the
basis of expenses. For example, pay the employees for overtime related to specific
department (Sahoo and Tone, 2014).
Direct labour or machine hours: In this type of allocation expenditure related to the
overheads are apportioned to the different departments in the ratio of machine hours and
labour employed.
Absorption: It is costing technique which is used to ascertain the unit and direct material
cost.
There are various methods of this which are as follows:
Production unit method:
This method is used to ascertain the overhead absorption rate and is calculated as
follows: budgeted or actual overhead/ Number of units produced.
Percentage of direct material cost method:
This method helps to know the overhead which are absorbed on the basis of
predetermined or actual rate of absorption.
3.5 Communicate with relevant staff to resolve any queries in overhead cost data
Overheads can be occurred in the production of goods. A company wants to minimize
the it so that product cost can be reduce. There are various type of overheads which are
follows: manufacturing, office and administration, selling and distribution, research and
overhead etc.
⊘ This is a preview!⊘
Do you want full access?
Subscribe today to unlock all pages.
Trusted by 1+ million students worldwide
1 out of 16
Related Documents


Your All-in-One AI-Powered Toolkit for Academic Success.
+13062052269
info@desklib.com
Available 24*7 on WhatsApp / Email
![[object Object]](/_next/static/media/star-bottom.7253800d.svg)
Unlock your academic potential
Copyright © 2020–2026 A2Z Services. All Rights Reserved. Developed and managed by ZUCOL.