University Assignment: Detailed Cost and Revenue Analysis for LUBM303
VerifiedAdded on 2022/12/15
|18
|4839
|372
Homework Assignment
AI Summary
This assignment delves into cost and revenue analysis, exploring key concepts such as variable and fixed costs, contribution margins, and profit calculations. It includes calculations and interpretations of the correlation coefficient between advertising expenditure and sales revenue, along with a scatter diagram illustrating the relationship. The assignment also involves break-even point analysis, margin of safety calculations, and the evaluation of different operational and marketing strategies to maximize profit. Furthermore, it discusses the importance of considering non-financial factors in decision-making and provides a comprehensive overview of cost behavior and its impact on business performance. The document also includes graphical representations and detailed explanations to support the analysis.

LUBM303
Paraphrase This Document
Need a fresh take? Get an instant paraphrase of this document with our AI Paraphraser

Table of Contents
Question 1........................................................................................................................................3
Question 2........................................................................................................................................6
Question 3........................................................................................................................................9
References......................................................................................................................................16
Question 1
a.
Unit variable cost × Quantity Produced = Variable cost
Variable cost + Fixed cost = Total cost
b.
Sales per unit × Quantity Produced = Sales revenue
Sales revenue = 2 × 180,000 = 360,000
Less: Variables cost = 0.75 × 180,000 = 135,000
Contribution = 225,000
Less: Fixed costs = 60,000
Profit = 165,000
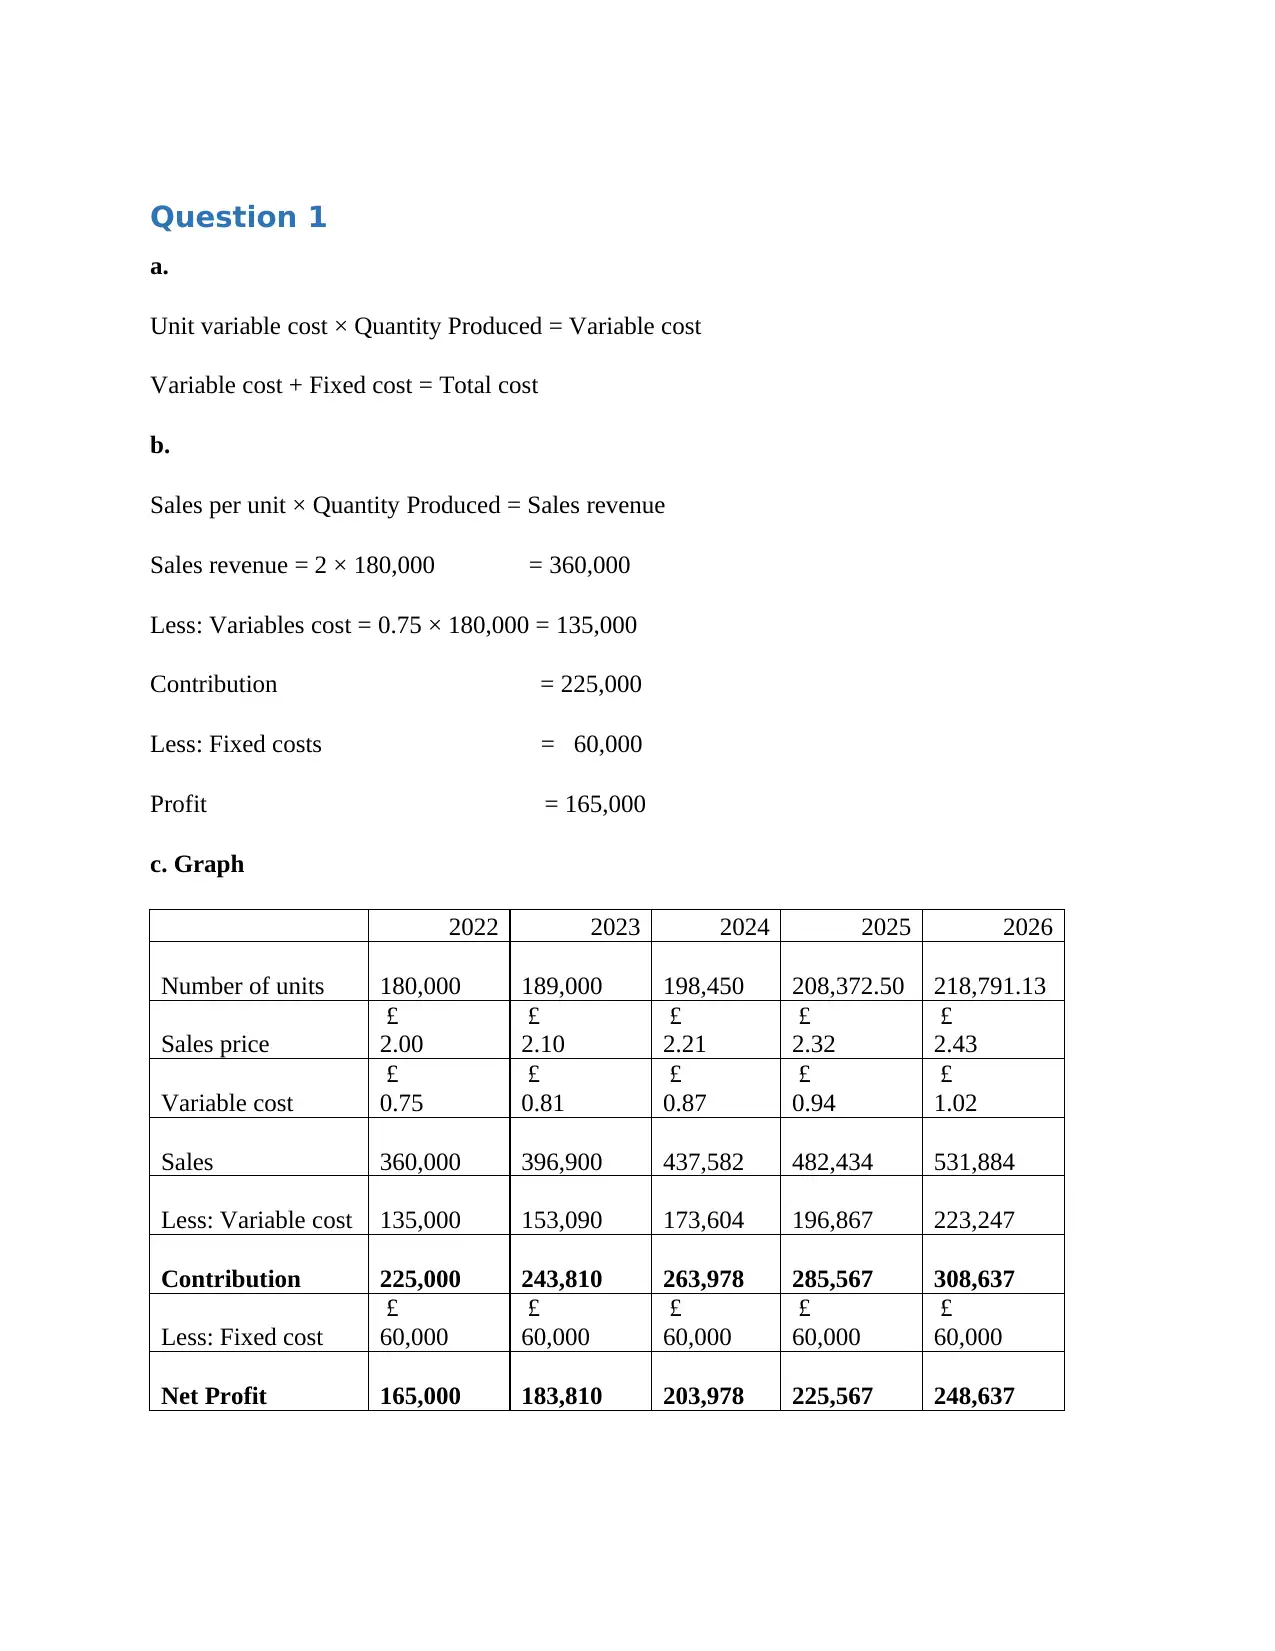
c. Graph
2022 2023 2024 2025 2026
Number of units 180,000 189,000 198,450 208,372.50 218,791.13
Sales price
£
2.00
£
2.10
£
2.21
£
2.32
£
2.43
Variable cost
£
0.75
£
0.81
£
0.87
£
0.94
£
1.02
Sales 360,000 396,900 437,582 482,434 531,884
Less: Variable cost 135,000 153,090 173,604 196,867 223,247
Contribution 225,000 243,810 263,978 285,567 308,637
Less: Fixed cost
£
60,000
£
60,000
£
60,000
£
60,000
£
60,000
Net Profit 165,000 183,810 203,978 225,567 248,637
a.
Unit variable cost × Quantity Produced = Variable cost
Variable cost + Fixed cost = Total cost
b.
Sales per unit × Quantity Produced = Sales revenue
Sales revenue = 2 × 180,000 = 360,000
Less: Variables cost = 0.75 × 180,000 = 135,000
Contribution = 225,000
Less: Fixed costs = 60,000
Profit = 165,000
c. Graph
2022 2023 2024 2025 2026
Number of units 180,000 189,000 198,450 208,372.50 218,791.13
Sales price
£
2.00
£
2.10
£
2.21
£
2.32
£
2.43
Variable cost
£
0.75
£
0.81
£
0.87
£
0.94
£
1.02
Sales 360,000 396,900 437,582 482,434 531,884
Less: Variable cost 135,000 153,090 173,604 196,867 223,247
Contribution 225,000 243,810 263,978 285,567 308,637
Less: Fixed cost
£
60,000
£
60,000
£
60,000
£
60,000
£
60,000
Net Profit 165,000 183,810 203,978 225,567 248,637
⊘ This is a preview!⊘
Do you want full access?
Subscribe today to unlock all pages.
Trusted by 1+ million students worldwide
2022 2023 2024 2025 2026
-
50,000
100,000
150,000
200,000
250,000
300,000
Series1
d.
Cost and revenue analysis refers to the study of the cost of creation and deals with the income of
a creative unit or company under different conditions. The goal of a company is to take
advantage and not make mistakes. However, the pros and cons of a company largely depend on
its costs and revenues. Basically, the gain / disadvantage is defined as the difference between the
total income and the total cost, i.e. Profit (or) Loss = Total Income - Total Cost. Since costs and
revenues are critical to choosing creative behaviors and how they view investment, it is
important to understand cost and income considerations.
A cost behavior study refers to the board's effort to see how operating costs are changing versus
a change in the association's business level. These costs can include direct materials, direct labor,
and management costs incurred in building an object. The board generally examines costs
through cost accounting skills.
Cost capabilities are pictures of how the cost (e.g., material, labor, or overhead) changes with
changes in the movement speed indicated by that cost. For example, the total variable costs
fluctuate relative to the extended movement, but the fixed costs remain the same as before. Cost
capabilities can have a variety of structures.
Paraphrase This Document
Need a fresh take? Get an instant paraphrase of this document with our AI Paraphraser
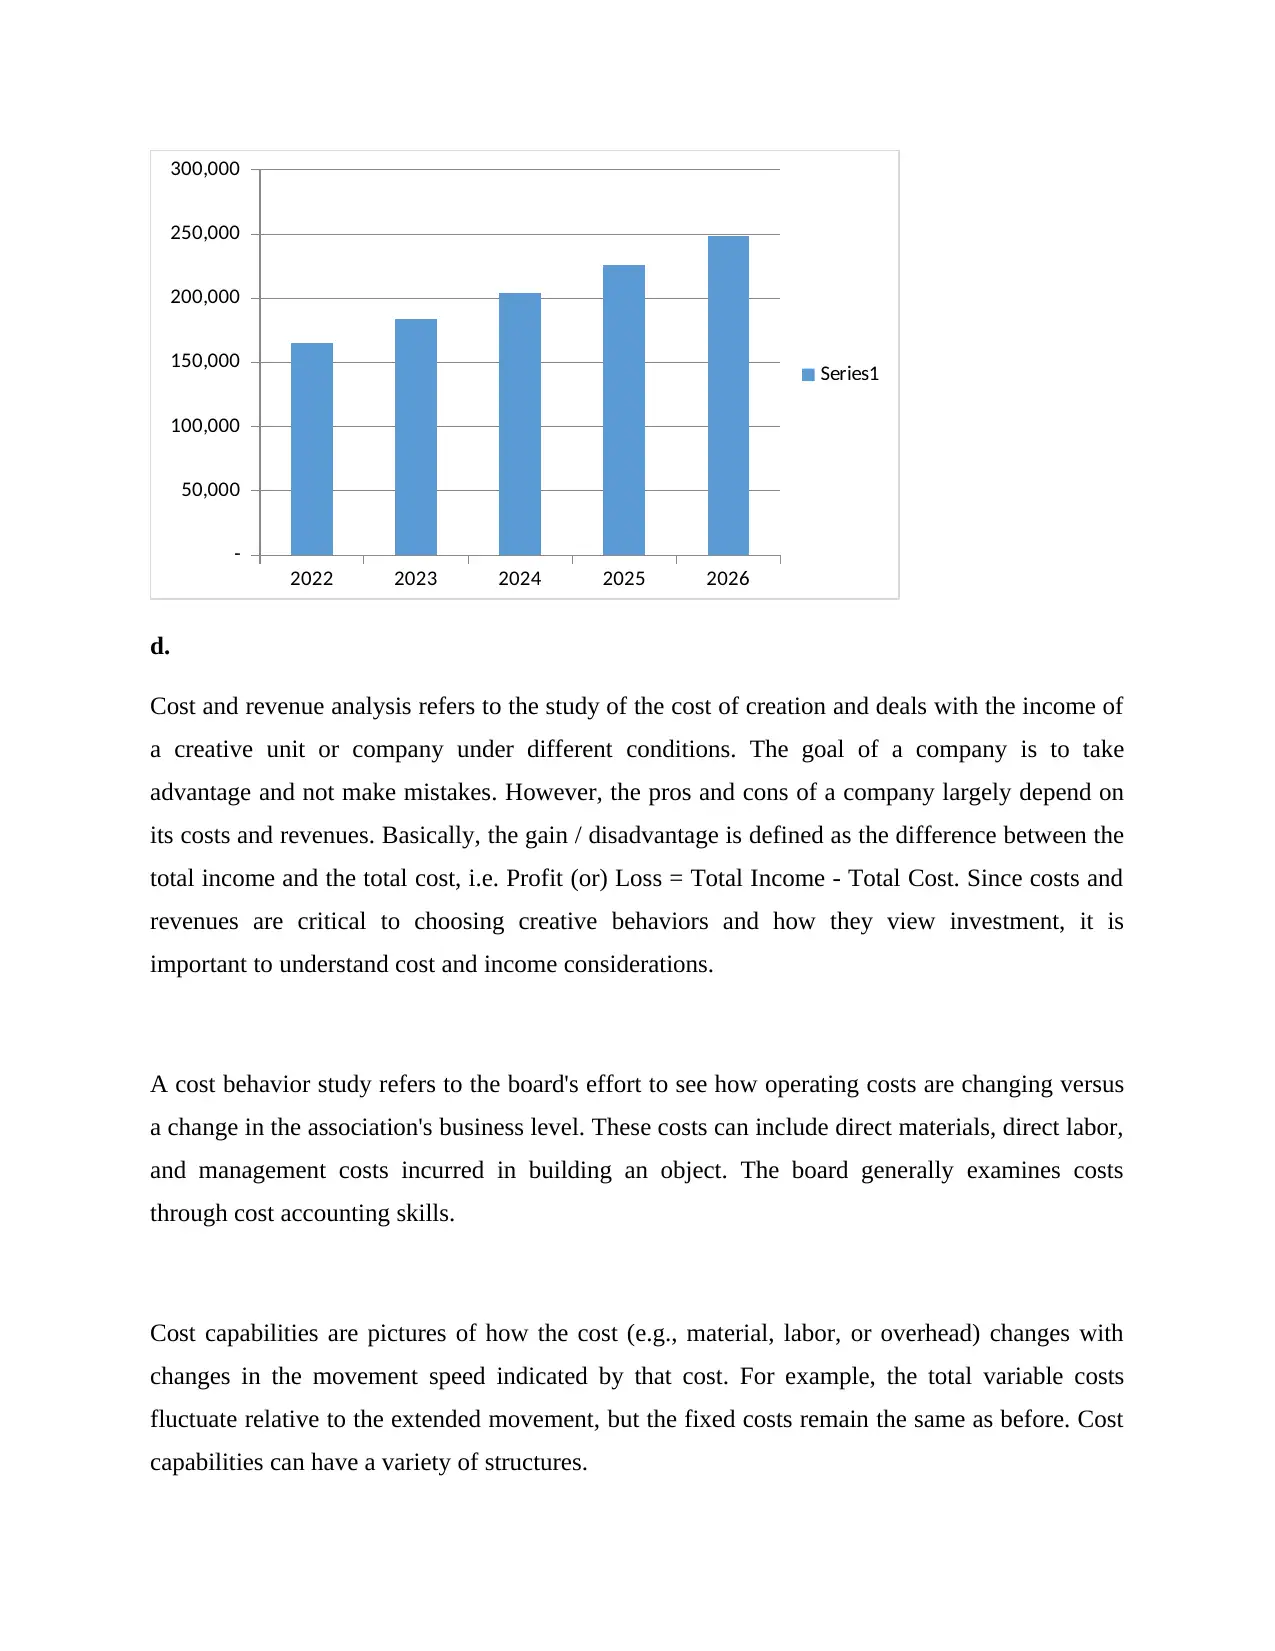
Projections before and after
Before projections, the revenue was 360,000 pounds, and cost was 135,000. But with the
changes in revenue and cost; the whole projection has changed. The overall impact can be
analyzed on the revenue. The graph clearly indicates that, firm’s profit is increasing every year;
despite of increase in variable cost. The reason is constant size of fixed cost every time when
project was made. Due to constant revenue, the profit is trended towards upward side. The
contribution margin is also major reason behind this upward trend. The increase in number of
units and size of sales volume gives hike to the overall earnings. Besides increasing in the
variable cost, Profit earning is growing every year even at high growth rate of variables cost. The
reason might be increase in volume results into larger impact compared to variable cost.
Quantitative Cost Analysis
It is critical for executives to use quantitative analysis methods to demonstrate costing
capabilities. The simplest approach is the high-low method. This strategy uses only the highest
and lowest cost and individual cost driver estimates to determine cost performance.
Despite the many limitations of this approach, it is a crucial first attempt to examine the link
between the cost driver and regular costs.
Repeat repeater is another strategy that uses reality strategies to routinely measure progress in the
dependent variable relative to changes in the autonomous variable. The replay method is a much
better indicator of the link between the factors. Programming, for example, Microsoft Excel is a
valuable tool for repeat analysis.
While both revenue costs and COGS are used against this, there are small variations. The
essential difference between them is that the cost of the goods sold does not take into account the
costs of promotion and distribution. Manufacturers are more likely to use the cost of selling
products, while specialist agencies are more likely to consider revenue consumption. Spending
income is an essential part of an organization’s payroll call. Its parts vary according to the
opinion of the organization and the industry. As well as the fact that it helps to estimate the
benefits of advancing costs.
From time to time, organizations may similarly conduct surveys of all characteristics and
subsequently conduct the validated study to further examine the effects of each autonomous
variable on the reliable variable. The overall conclusion is that there are several ways to break
down information on cost behavior within an organization and it is up to the board to choose
how well they intend to conduct the top-down analysis.
Question 2
a. Correlation Coefficient
X Values
∑ = 20000
Mean = 4000
∑(X - Mx)2 = SSx = 10000000
Y Values
∑ = 400000
Mean = 80000
∑(Y - My)2 = SSy = 1000000000
X and Y Combined
N = 5
∑(X - Mx)(Y - My) = 90000000
R Calculation
r = ∑((X - My)(Y - Mx)) / √((SSx)(SSy))
r = 90000000 / √((10000000)(1000000000)) = 0.9
The correlation coefficient is 0.9 which is near to perfect correlation.
⊘ This is a preview!⊘
Do you want full access?
Subscribe today to unlock all pages.
Trusted by 1+ million students worldwide
b. Scatter diagram
0 2 4 6 8 10 12
0
2
4
6
8
10
12
Advertising exp
Sales revenue
c.
There is strong impact of advertising on sales revenue as both variables are not fitted well.
Additionally, there is positive impact of advertising on the revenue of the firm.
Company can increase its sales by adopting digital marketing strategies, as there is positive
strong relationship between both advertising and sales revenue, hence investing more on
advertising will not only enhance the sales of the company but it will also give competitive
advantage to fitness industry.
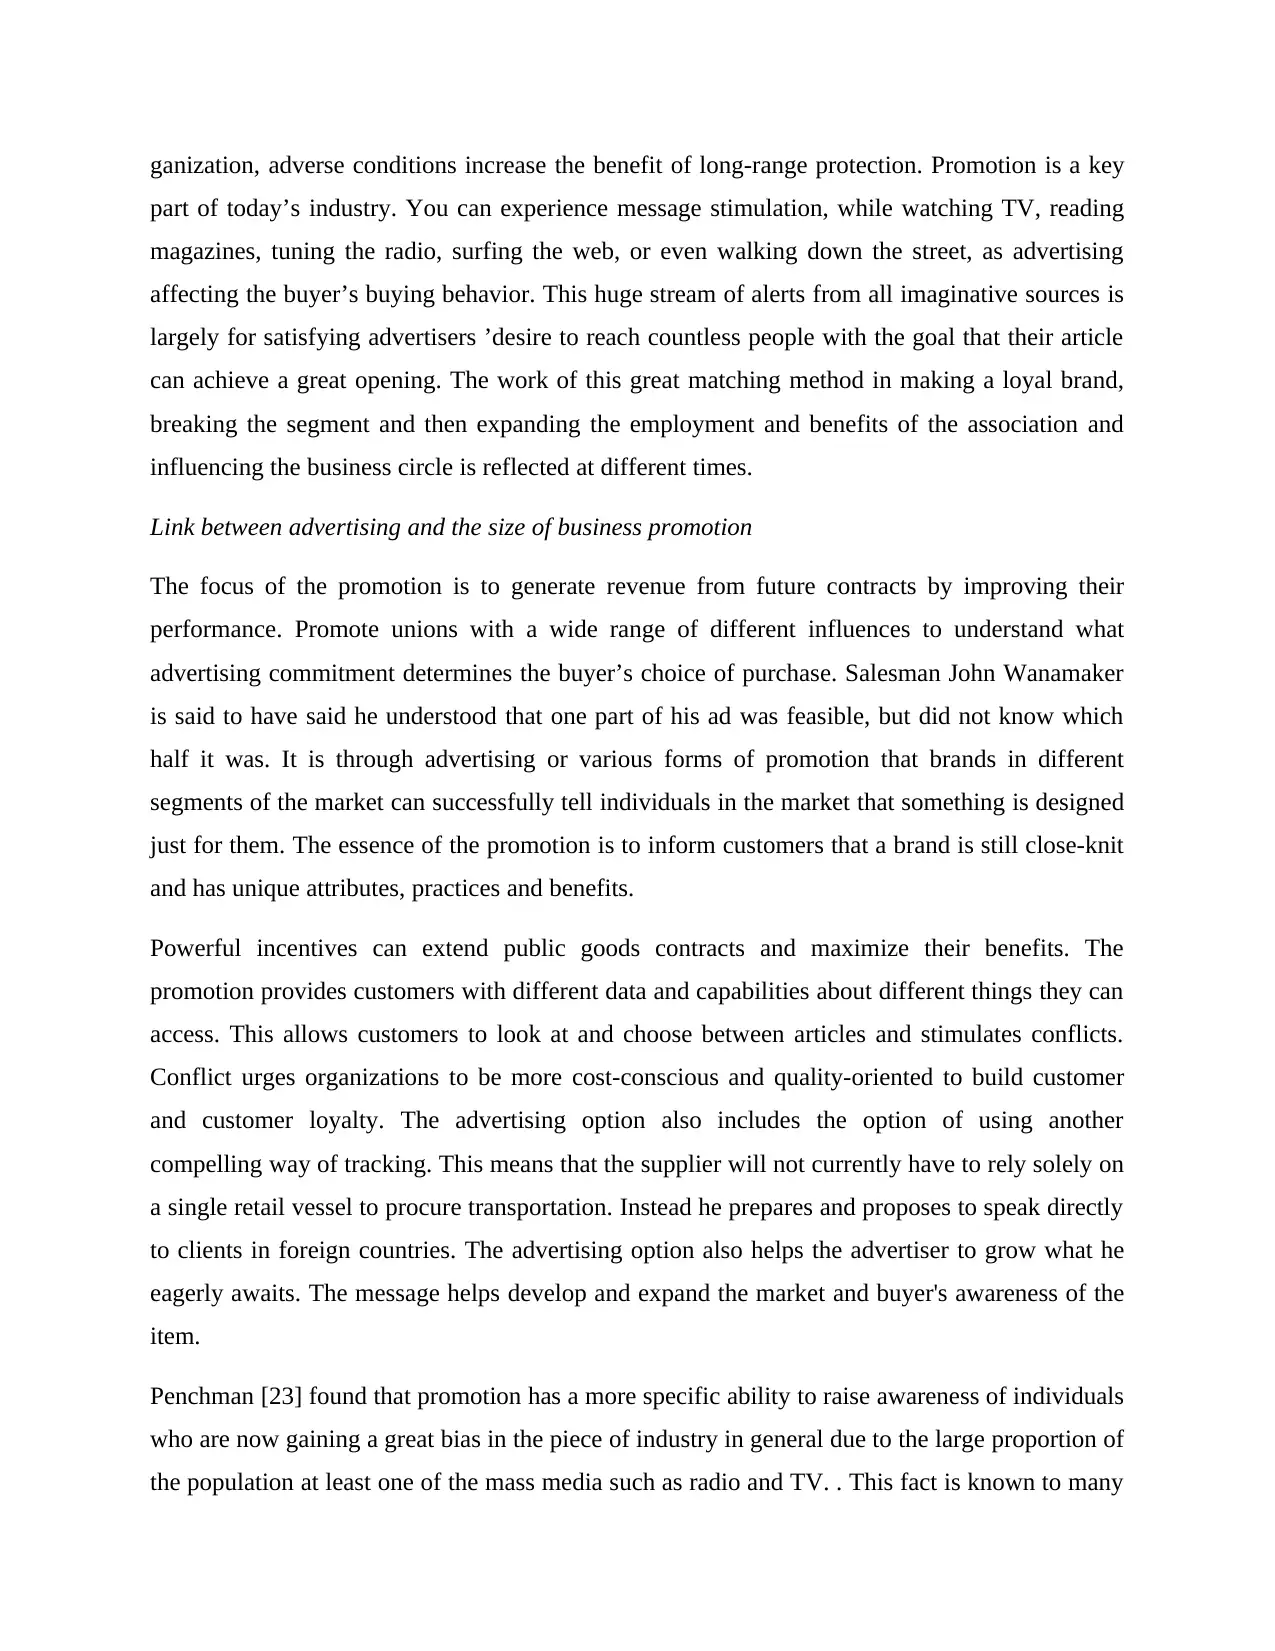
Impact of advertising expenditure on sales
In today’s competitive world, clients should be protected to have the upper hand to deal with
their problems better than the various contenders. Then again, consumers buy products with
different biases; therefore, they should be considered in the design of advertising systems. On the
planet that the various components of promoting consumer protection should be considered in
the light of consumer goals to cover the interests of society, a bad situation will increase the
long-term protection benefit.
0 2 4 6 8 10 12
0
2
4
6
8
10
12
Advertising exp
Sales revenue
c.
There is strong impact of advertising on sales revenue as both variables are not fitted well.
Additionally, there is positive impact of advertising on the revenue of the firm.
Company can increase its sales by adopting digital marketing strategies, as there is positive
strong relationship between both advertising and sales revenue, hence investing more on
advertising will not only enhance the sales of the company but it will also give competitive
advantage to fitness industry.
Impact of advertising expenditure on sales
In today’s competitive world, clients should be protected to have the upper hand to deal with
their problems better than the various contenders. Then again, consumers buy products with
different biases; therefore, they should be considered in the design of advertising systems. On the
planet that the various components of promoting consumer protection should be considered in
the light of consumer goals to cover the interests of society, a bad situation will increase the
long-term protection benefit.
Paraphrase This Document
Need a fresh take? Get an instant paraphrase of this document with our AI Paraphraser
ganization, adverse conditions increase the benefit of long-range protection. Promotion is a key
part of today’s industry. You can experience message stimulation, while watching TV, reading
magazines, tuning the radio, surfing the web, or even walking down the street, as advertising
affecting the buyer’s buying behavior. This huge stream of alerts from all imaginative sources is
largely for satisfying advertisers ’desire to reach countless people with the goal that their article
can achieve a great opening. The work of this great matching method in making a loyal brand,
breaking the segment and then expanding the employment and benefits of the association and
influencing the business circle is reflected at different times.
Link between advertising and the size of business promotion
The focus of the promotion is to generate revenue from future contracts by improving their
performance. Promote unions with a wide range of different influences to understand what
advertising commitment determines the buyer’s choice of purchase. Salesman John Wanamaker
is said to have said he understood that one part of his ad was feasible, but did not know which
half it was. It is through advertising or various forms of promotion that brands in different
segments of the market can successfully tell individuals in the market that something is designed
just for them. The essence of the promotion is to inform customers that a brand is still close-knit
and has unique attributes, practices and benefits.
Powerful incentives can extend public goods contracts and maximize their benefits. The
promotion provides customers with different data and capabilities about different things they can
access. This allows customers to look at and choose between articles and stimulates conflicts.
Conflict urges organizations to be more cost-conscious and quality-oriented to build customer
and customer loyalty. The advertising option also includes the option of using another
compelling way of tracking. This means that the supplier will not currently have to rely solely on
a single retail vessel to procure transportation. Instead he prepares and proposes to speak directly
to clients in foreign countries. The advertising option also helps the advertiser to grow what he
eagerly awaits. The message helps develop and expand the market and buyer's awareness of the
item.
Penchman [23] found that promotion has a more specific ability to raise awareness of individuals
who are now gaining a great bias in the piece of industry in general due to the large proportion of
the population at least one of the mass media such as radio and TV. . This fact is known to many
who have been promoted by the organization. Given the possibility of non-compliance, it will
encourage an increase in the volume of contracts. Pride et al (1989) find that advertising often
stimulates demand in this way by animating contracts. To foster a close relationship with
contract revenue, the entire market mix should be viewed by the customer as the right one.
Elliot [16] states that advertising agencies will struggle in another energetic way with the brand,
in order to expand their segment of the global business through an expanded client, using the
simple method has instructed users to perform presentation techniques. Several researchers have
listened to different perspectives on the impact of advertising on the performance of agreements.
Either way, most of them agree that strong advertising will increase revenue in the long run.
Jefikins [24] stated that in a bad association there is not only conflict between rival supporters,
but also the decision between their opponents and the administrations. People also don't
remember effectively and in that sense the biggest promoter on the planet fails effectively if it
stops advertising. Organizations advertise to know about something or something that helps
build trust. In the event that something is largely unavailable, it is important to make it clear to
people.
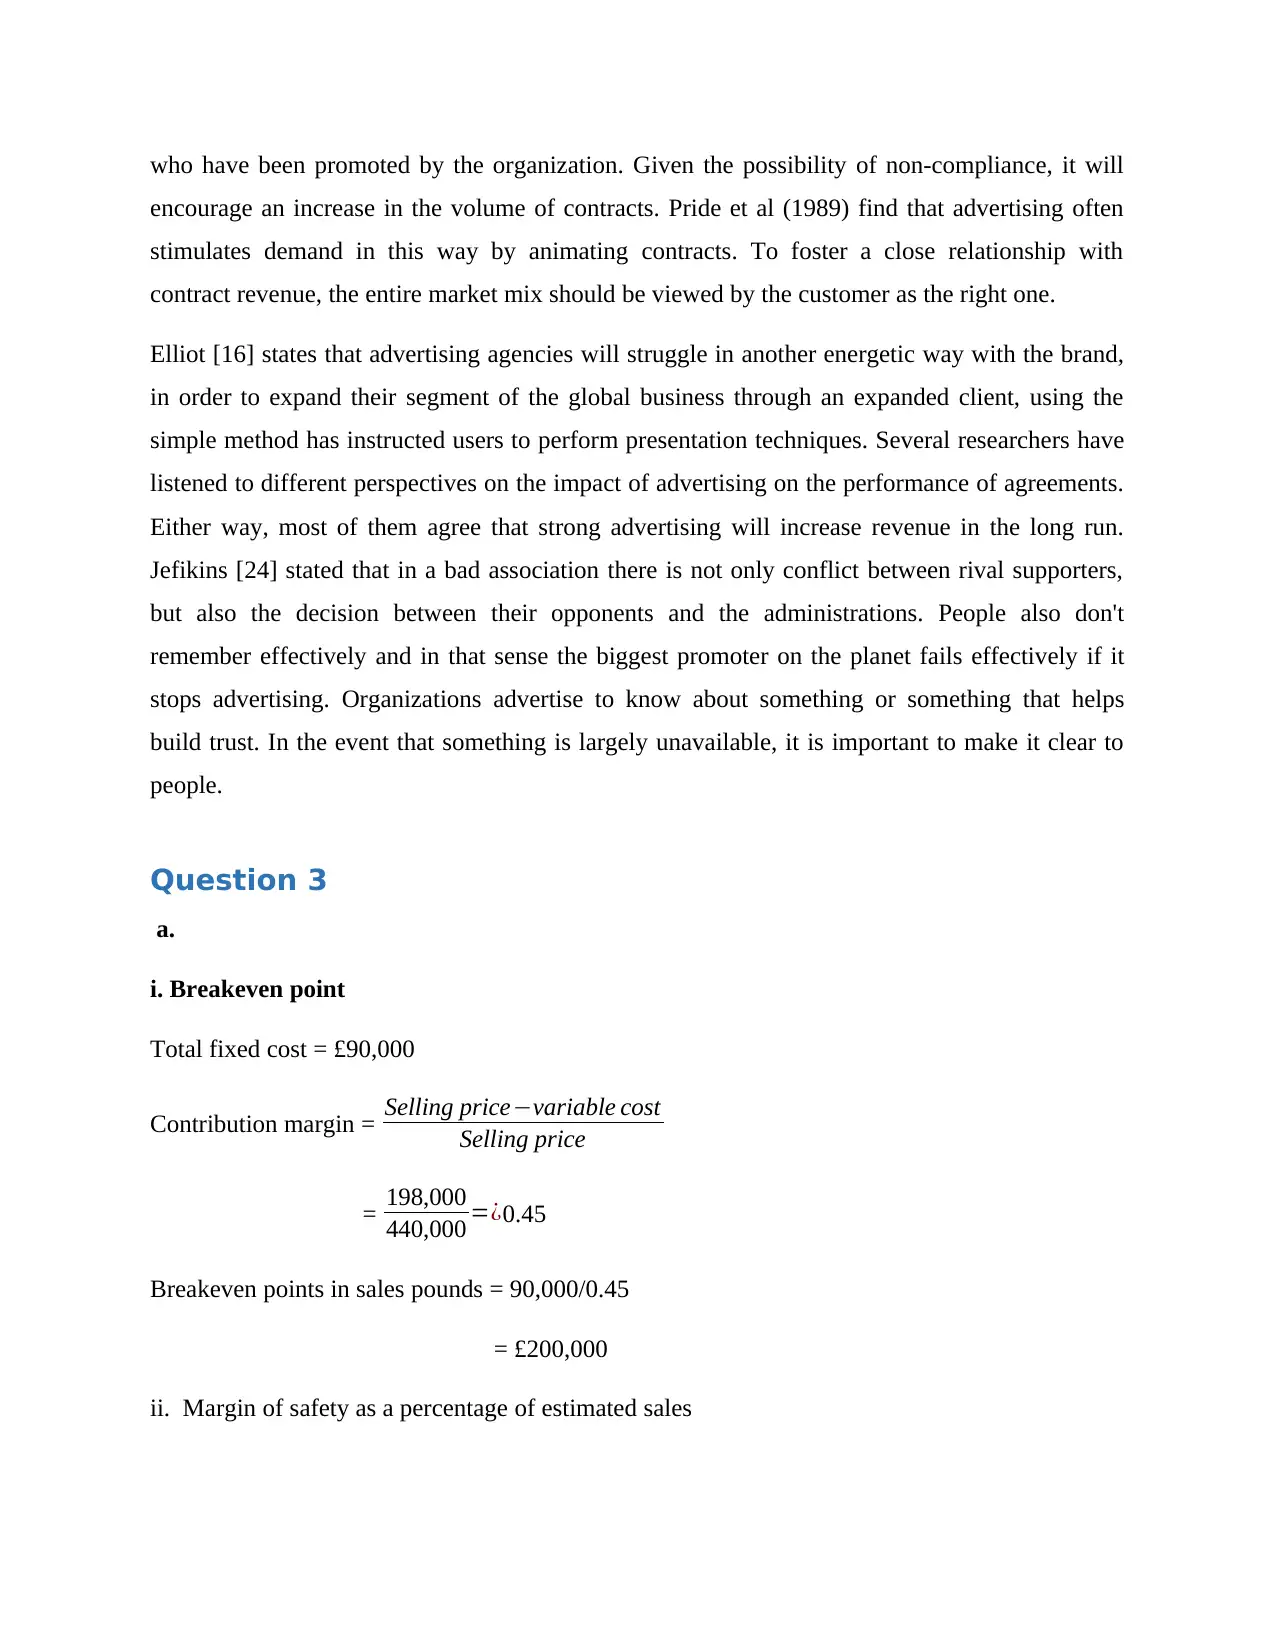
Question 3
a.
i. Breakeven point
Total fixed cost = £90,000
Contribution margin = Selling price−variable cost
Selling price
= 198,000
440,000 =¿0.45
Breakeven points in sales pounds = 90,000/0.45
= £200,000
ii. Margin of safety as a percentage of estimated sales
encourage an increase in the volume of contracts. Pride et al (1989) find that advertising often
stimulates demand in this way by animating contracts. To foster a close relationship with
contract revenue, the entire market mix should be viewed by the customer as the right one.
Elliot [16] states that advertising agencies will struggle in another energetic way with the brand,
in order to expand their segment of the global business through an expanded client, using the
simple method has instructed users to perform presentation techniques. Several researchers have
listened to different perspectives on the impact of advertising on the performance of agreements.
Either way, most of them agree that strong advertising will increase revenue in the long run.
Jefikins [24] stated that in a bad association there is not only conflict between rival supporters,
but also the decision between their opponents and the administrations. People also don't
remember effectively and in that sense the biggest promoter on the planet fails effectively if it
stops advertising. Organizations advertise to know about something or something that helps
build trust. In the event that something is largely unavailable, it is important to make it clear to
people.
Question 3
a.
i. Breakeven point
Total fixed cost = £90,000
Contribution margin = Selling price−variable cost
Selling price
= 198,000
440,000 =¿0.45
Breakeven points in sales pounds = 90,000/0.45
= £200,000
ii. Margin of safety as a percentage of estimated sales
⊘ This is a preview!⊘
Do you want full access?
Subscribe today to unlock all pages.
Trusted by 1+ million students worldwide
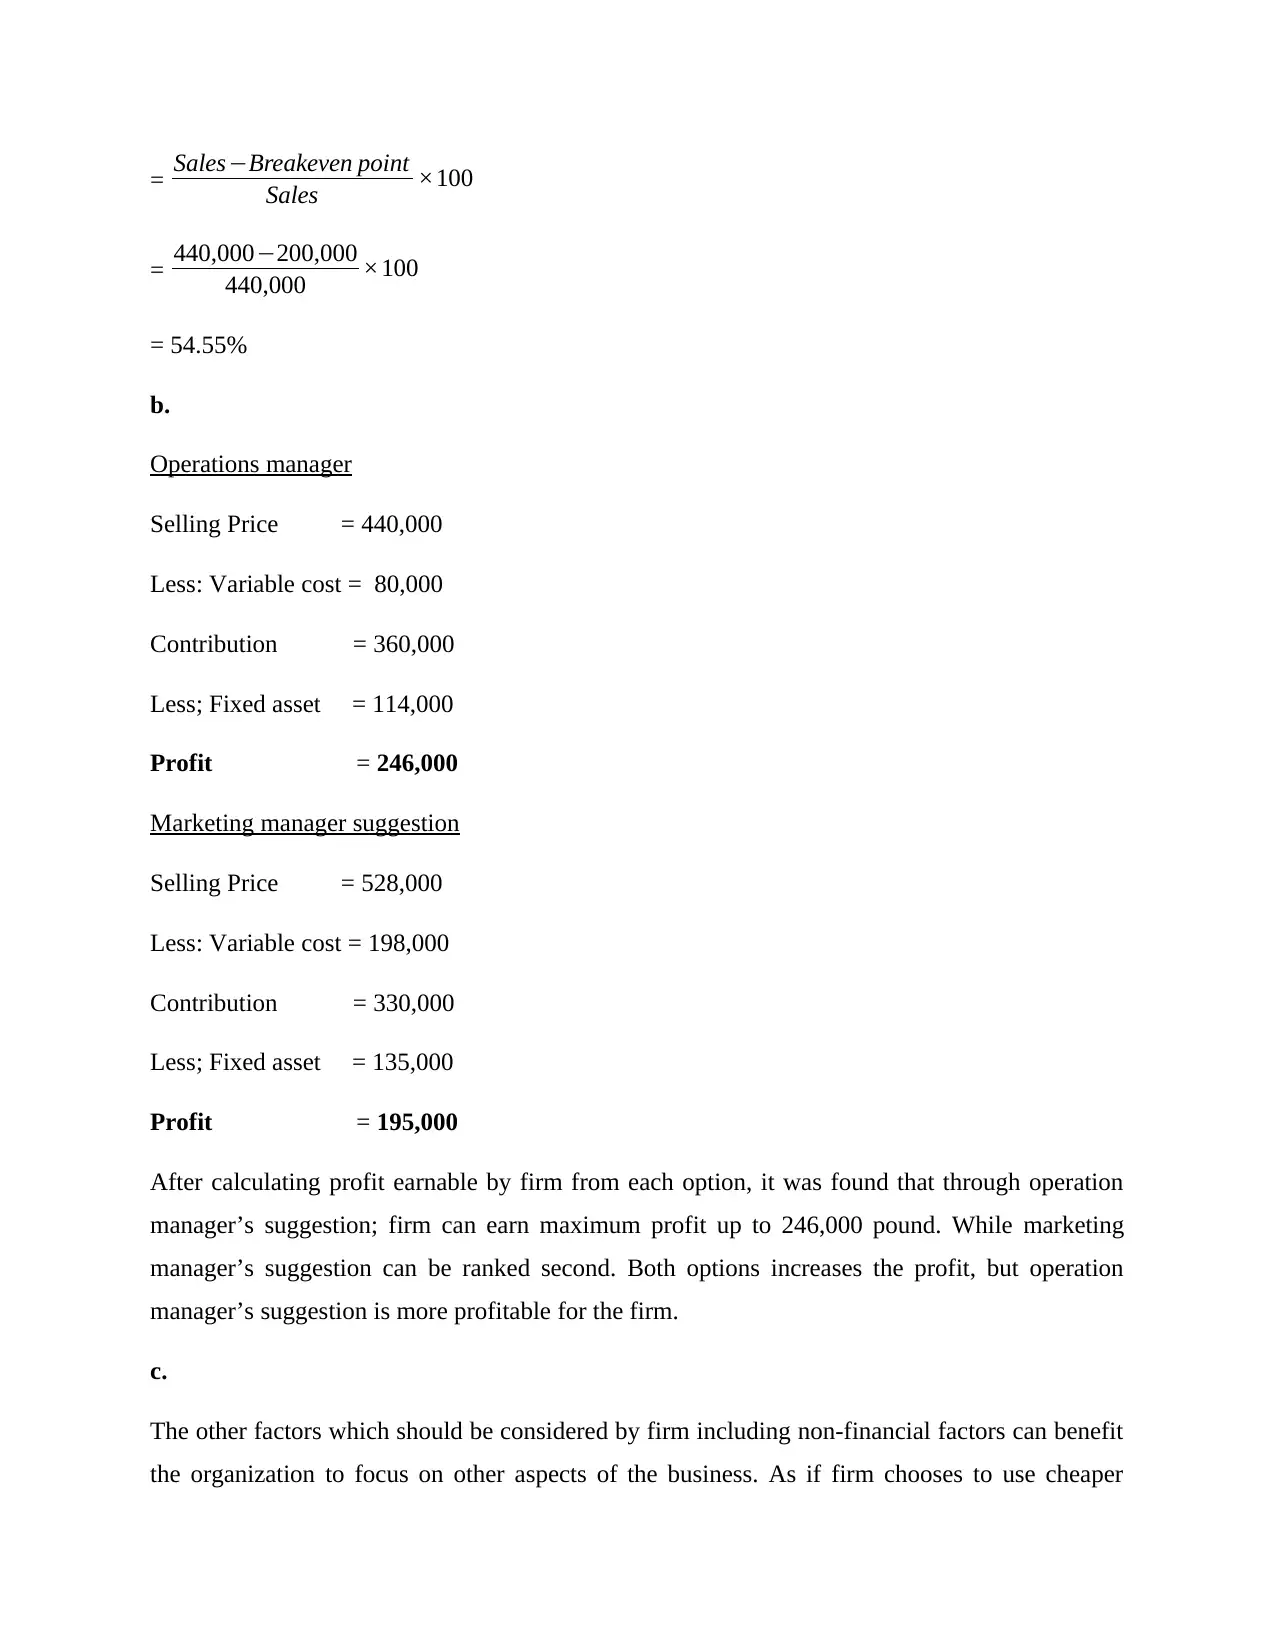
= Sales−Breakeven point
Sales ×100
= 440,000−200,000
440,000 ×100
= 54.55%
b.
Operations manager
Selling Price = 440,000
Less: Variable cost = 80,000
Contribution = 360,000
Less; Fixed asset = 114,000
Profit = 246,000
Marketing manager suggestion
Selling Price = 528,000
Less: Variable cost = 198,000
Contribution = 330,000
Less; Fixed asset = 135,000
Profit = 195,000
After calculating profit earnable by firm from each option, it was found that through operation
manager’s suggestion; firm can earn maximum profit up to 246,000 pound. While marketing
manager’s suggestion can be ranked second. Both options increases the profit, but operation
manager’s suggestion is more profitable for the firm.
c.
The other factors which should be considered by firm including non-financial factors can benefit
the organization to focus on other aspects of the business. As if firm chooses to use cheaper
Paraphrase This Document
Need a fresh take? Get an instant paraphrase of this document with our AI Paraphraser
materials for enhancing its profitability, then it will reduce product quality. This could hamper
company’s image in the market in future. Thus, using cheaper materials is not good for
company’s reputation in the market, and it should be considered by the company before taking
any decision.
d.
The breakeven point is defined as the point where both total expenses and gross income are
equal. It is the level of creation in a collection cycle or accounting period where revenues are
generated and expenses are introduced in a rather similar way, and the net benefit for that period
is zero.
Break-even analysis of the initial investment to consider the cost-benefit ratio is a strategy. The
minimum translation of the term follows the initial investment review back to a warranty
agreement of that level of operation in which the total cost becomes the full cost of sale. The
larger translation refers to the study provision that determines the most likely benefit at any stage
of transition. It can be added to this that the CVP test is also explicitly, though not effectively,
designated as “Fair Analysis”. The difference between the two terms is limited. The CVP study
covers the full potential of welfare provision, and the return of the first study is one of the
methods used in this cycle. However, as mentioned above, the original investment review yield
method is so well known for its CVP analysis that the two terms are used as identical terms.
Furthermore, for the purposes of this study, we made no distinction between these two terms.
The point at which it breaks down total expenditure and selling value is considered fair to reflect
the level of output or business where profit or misfortune will not return to the initial point of
investment. Now, the company's payment is very close to using it. If the creation is developed
above this level, the profit for the company will increase, and if it is reduced from this level, the
company will bear the misfortune.
Benefits
1. The administration can view more data from the recovery in the original investment diagram
than the profit and loss account and expense reports.
2. The link between cost, size and profitability of the organization is presented at a level equal to
the initial investment perspective. Summarize the largest data in a diagram.
3. The diagram is very useful for making important decisions by the administration. The
explanation is that restoring the original investment chart shows the impact on benefits from
changes in fixed costs, variable costs, cost of sales, and contract volume.
4. The image is invaluable for estimating costs and benefits in the different stages of creation and
contract.
5. The administration uses cost control as it reflects the general meaning of fixed costs and
variable costs.
6. The scheme helps the administration determine the productivity of the items and the
combination of the most profitable items.
7. Earnings are obtained in different phases of the movement in the same way.
8. The chart helps to adjust the sales value, which would give a desired advantage.
Limitations
1. Return on return the original investment scheme is withdrawn on suspicion. Be that as it may,
the assumptions do not stand out. Fixed costs can exceed the specified level of activity. In
addition, variable costs do not differ in the direct measurement of the level of activity if the law
of reduction or expansion of output is relevant to the activity.
2. Similarly, the single break-even chart, both the full cost line and the business line look directly
at the lines. Because the assumptions are invalid, these lines were not drawn to straight lines.
This encourages some to return the initial investment as it is aimed at different stages of
transition.
3. Only limited data are available from the first deposit card.
4. A single break-even chart to an initial investment scheme does not allow for a study of the
effect of a variety of factors on benefits.
5. For administrative decisions one has to consider the capital employed. However, the gain from
the original investment diagram does not take into account the capital employed. After that, the
administration options can be hard.
Application
⊘ This is a preview!⊘
Do you want full access?
Subscribe today to unlock all pages.
Trusted by 1+ million students worldwide
1 out of 18
Related Documents


Your All-in-One AI-Powered Toolkit for Academic Success.
+13062052269
info@desklib.com
Available 24*7 on WhatsApp / Email
![[object Object]](/_next/static/media/star-bottom.7253800d.svg)
Unlock your academic potential
Copyright © 2020–2026 A2Z Services. All Rights Reserved. Developed and managed by ZUCOL.