Comprehensive Cost and Revenue Analysis for Marks and Spencer
VerifiedAdded on 2020/12/24
|19
|4300
|341
Report
AI Summary
This report provides a detailed analysis of cost and revenue management within Marks & Spencer (M&S), a major UK-based retail enterprise. It examines internal reporting purposes, different costing systems, and the relationships between responsibility, cost, and investment centers. The report explores various cost classifications, including manufacturing, non-manufacturing, direct, and indirect costs, and differentiates between marginal and absorption costing methods. It covers costing procedures for materials, labor, and expenses, along with inventory stages and valuation using FIFO. The report delves into cost behavior, overhead allocation, and the calculation of overhead absorption rates based on machine and labor hours. Furthermore, it addresses variance analysis, budgeting, and provides insights into future income and cost estimations, including the effects of changing activity levels on unit costs and factors affecting short-term and long-term decision-making within M&S.
Costs and revenues
Paraphrase This Document
Need a fresh take? Get an instant paraphrase of this document with our AI Paraphraser
Table of Contents
INTRODUCTION...........................................................................................................................1
MAIN BODY...................................................................................................................................1
1.1 Purpose of internal reporting and giving accurate information.............................................1
1.2 Relationship among various costing systems within M&S..................................................1
1.3 Responsibility centres, cost centres and investment centres within organisation..................2
1.4 Characteristics of different cost classifications and their usage............................................2
1.5 Difference between marginal and absorption costing............................................................3
2.1 Record Cost information for material, labour and expenses in accordance with the costing
procedures of M&S......................................................................................................................3
2.2 Analyse cost information for material, labour and expenses in accordance with the costing
procedures of M&S......................................................................................................................3
2.3 Different stages of inventory.................................................................................................4
2.4 Value inventory using............................................................................................................4
2.5 Behaviour of costs..................................................................................................................7
2.6 Recording cost information....................................................................................................8
3.1 Attribute overhead costs to service and production costs......................................................8
3.2 Overhead absorption rate.......................................................................................................8
3.3 ................................................................................................................................................9
3.4 Reviewing allocation, apportionment and absorption methods...........................................10
3.5 Resolving queries in overhead cost......................................................................................10
4.1 comparison of actual costs with budget costs......................................................................10
4.2 Analyzing the variances.......................................................................................................10
4.3 Providing information to budget holders of any variances and remedial actions................11
4.4 Management report..............................................................................................................12
5.1 Future income and costs estimates.......................................................................................13
5.2 Effects of changing activity levels on unit costs..................................................................14
5.3 calculating the effects of changing activity levels on unit cost...........................................14
5.4 Factors affecting long-term and short-term decision making..............................................14
CONCLUSION..............................................................................................................................15
REFERENCES .............................................................................................................................16
INTRODUCTION
Costing and revenue generation are two major and key aspects within an organisation that
will support the effective management of financial conditions within a firm. It helps the
organisations to monitor and manage their monetary based operations and handling different
inventories. It is also important to control the expenses that are been carried out within a firm.
The report is based on inventory and cost management of UK based retail enterprise, Marks and
Spencer. It is one of the largest retail enterprise in world with an effective management of large
number of inventories.
The assessment carries the assessment of internal reporting and providing accurate
information with different costing systems. The responsibility centre, profit centre with
evaluation of investment centres and classification of different costs. Also, the costing
procedures and expense management is been performed with various stages of an inventory and
management of different behaviours also the cost information is been evaluated. The overhead
costs will be analysed and measures of allocation, appointment and absorption is taken with
resolving of queries art cost data. Budgeting and management reports are presented with
assessment of various information for decision making and effects of changing activity levels.
MAIN BODY
1.1 Purpose of internal reporting and giving accurate information
Within an organisation, in order to have a good accessibility and management of their
cost operations and inventories, the internal reporting of various operations is very essential. This
process is carried out by almost all the organisation in order to have a significant control over
their operations and management of all sort of expenses.
It helps to monitor data redundancy, predicting future trends, identifying the resource
values and reduce chances of errors. This is vital for suitable decision making and carrying out of
different inventory management operations (Yang and Chen, 2018). The delivery of accurate
information helps to improve decision making and increase efficiency of an organisation's
management to deliver their services.
1.2 Relationship among various costing systems within M&S
Different costing systems are taken within the organisation that helps the firm to improve
the quality of services and improve the quality of services and maintain their expenses within an
organisation. The Unit costing measures the production of an individual unit of a commodity,
⊘ This is a preview!⊘
Do you want full access?
Subscribe today to unlock all pages.
Trusted by 1+ million students worldwide
using it the batch costing is been estimated. Job and Contract costing will be analyses with
process costing in order to identify the expense of producing a product or services. Other than
this, the service costing and composite costing will help in improving the qualities and services
related top the production or manufacturing and helping to evaluate the proper inventory
maintaining of the firm.
1.3 Responsibility centres, cost centres and investment centres within organisation
The responsibility centres are the section of an organisation which are looked after to
handle any sort of responsibilities within organisation and thus facilitates an effective decision
making authorities and individual managers (Weisbach, Hemel and Nou, 2018). In Cost centres,
the financial operations are undertaken by managers and are responsible for the cost management
but not the revenue generation of the firm.
Investment centres, on the other hand, are responsible for both profit or revenue
generation and resources that are invested as an asset within an organisation. It also helps in
management of different inventories and facilitates buying, selling and using divisional assets
within an organisation.
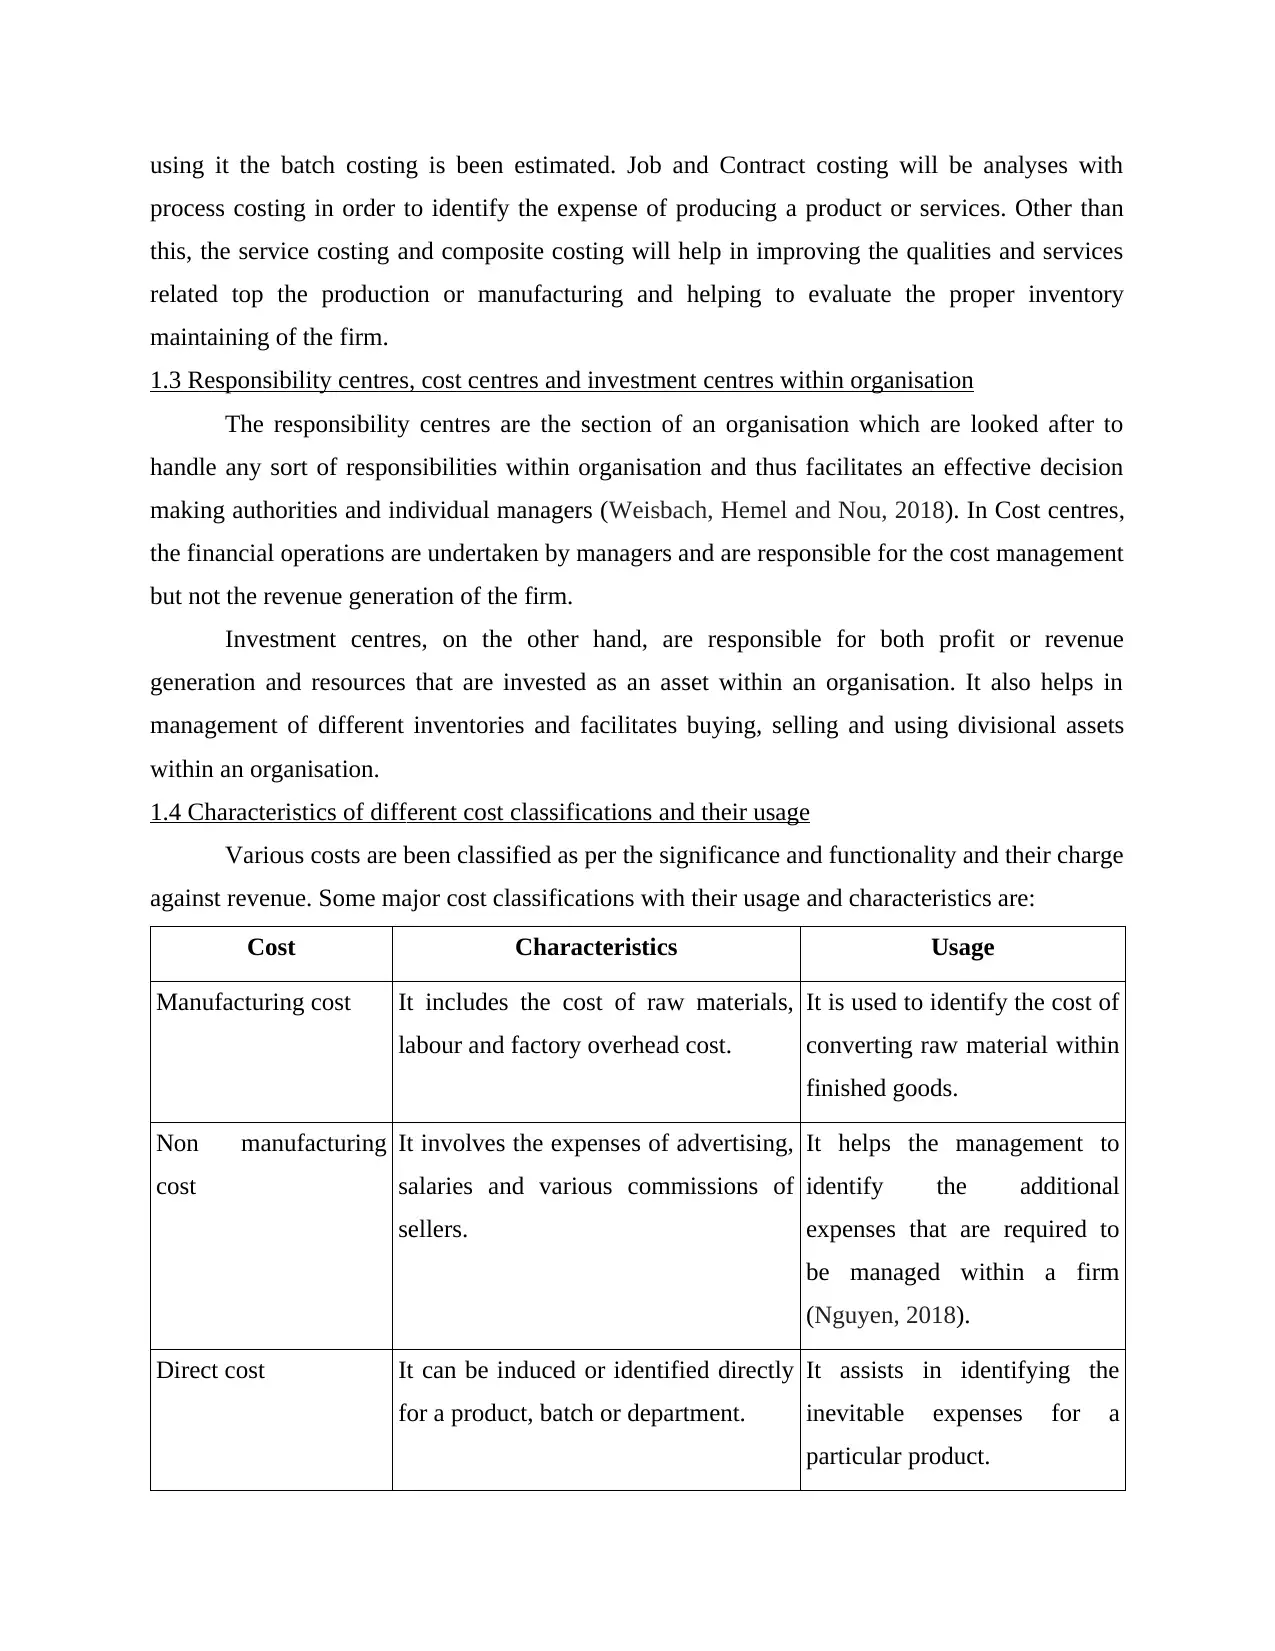
1.4 Characteristics of different cost classifications and their usage
Various costs are been classified as per the significance and functionality and their charge
against revenue. Some major cost classifications with their usage and characteristics are:
Cost Characteristics Usage
Manufacturing cost It includes the cost of raw materials,
labour and factory overhead cost.
It is used to identify the cost of
converting raw material within
finished goods.
Non manufacturing
cost
It involves the expenses of advertising,
salaries and various commissions of
sellers.
It helps the management to
identify the additional
expenses that are required to
be managed within a firm
(Nguyen, 2018).
Direct cost It can be induced or identified directly
for a product, batch or department.
It assists in identifying the
inevitable expenses for a
particular product.
process costing in order to identify the expense of producing a product or services. Other than
this, the service costing and composite costing will help in improving the qualities and services
related top the production or manufacturing and helping to evaluate the proper inventory
maintaining of the firm.
1.3 Responsibility centres, cost centres and investment centres within organisation
The responsibility centres are the section of an organisation which are looked after to
handle any sort of responsibilities within organisation and thus facilitates an effective decision
making authorities and individual managers (Weisbach, Hemel and Nou, 2018). In Cost centres,
the financial operations are undertaken by managers and are responsible for the cost management
but not the revenue generation of the firm.
Investment centres, on the other hand, are responsible for both profit or revenue
generation and resources that are invested as an asset within an organisation. It also helps in
management of different inventories and facilitates buying, selling and using divisional assets
within an organisation.
1.4 Characteristics of different cost classifications and their usage
Various costs are been classified as per the significance and functionality and their charge
against revenue. Some major cost classifications with their usage and characteristics are:
Cost Characteristics Usage
Manufacturing cost It includes the cost of raw materials,
labour and factory overhead cost.
It is used to identify the cost of
converting raw material within
finished goods.
Non manufacturing
cost
It involves the expenses of advertising,
salaries and various commissions of
sellers.
It helps the management to
identify the additional
expenses that are required to
be managed within a firm
(Nguyen, 2018).
Direct cost It can be induced or identified directly
for a product, batch or department.
It assists in identifying the
inevitable expenses for a
particular product.
Paraphrase This Document
Need a fresh take? Get an instant paraphrase of this document with our AI Paraphraser
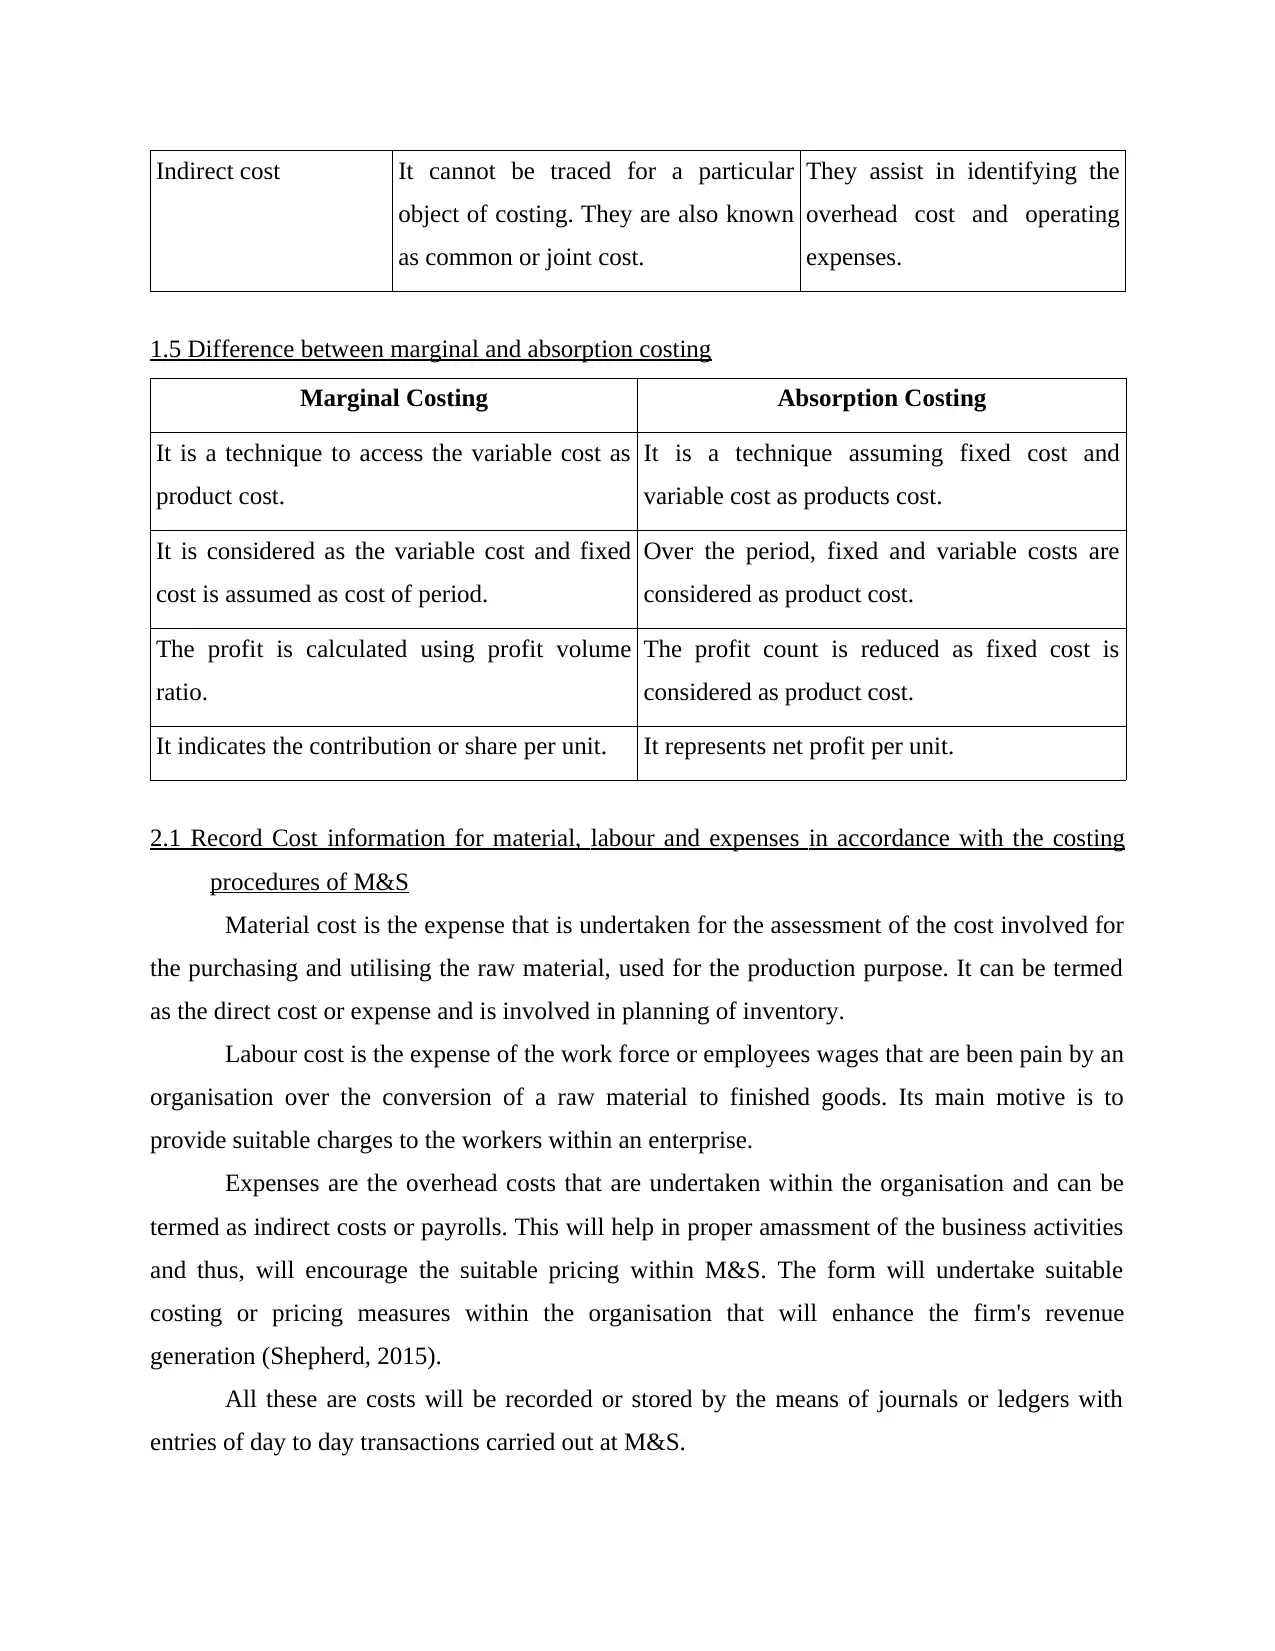
Indirect cost It cannot be traced for a particular
object of costing. They are also known
as common or joint cost.
They assist in identifying the
overhead cost and operating
expenses.
1.5 Difference between marginal and absorption costing
Marginal Costing Absorption Costing
It is a technique to access the variable cost as
product cost.
It is a technique assuming fixed cost and
variable cost as products cost.
It is considered as the variable cost and fixed
cost is assumed as cost of period.
Over the period, fixed and variable costs are
considered as product cost.
The profit is calculated using profit volume
ratio.
The profit count is reduced as fixed cost is
considered as product cost.
It indicates the contribution or share per unit. It represents net profit per unit.
2.1 Record Cost information for material, labour and expenses in accordance with the costing
procedures of M&S
Material cost is the expense that is undertaken for the assessment of the cost involved for
the purchasing and utilising the raw material, used for the production purpose. It can be termed
as the direct cost or expense and is involved in planning of inventory.
Labour cost is the expense of the work force or employees wages that are been pain by an
organisation over the conversion of a raw material to finished goods. Its main motive is to
provide suitable charges to the workers within an enterprise.
Expenses are the overhead costs that are undertaken within the organisation and can be
termed as indirect costs or payrolls. This will help in proper amassment of the business activities
and thus, will encourage the suitable pricing within M&S. The form will undertake suitable
costing or pricing measures within the organisation that will enhance the firm's revenue
generation (Shepherd, 2015).
All these are costs will be recorded or stored by the means of journals or ledgers with
entries of day to day transactions carried out at M&S.
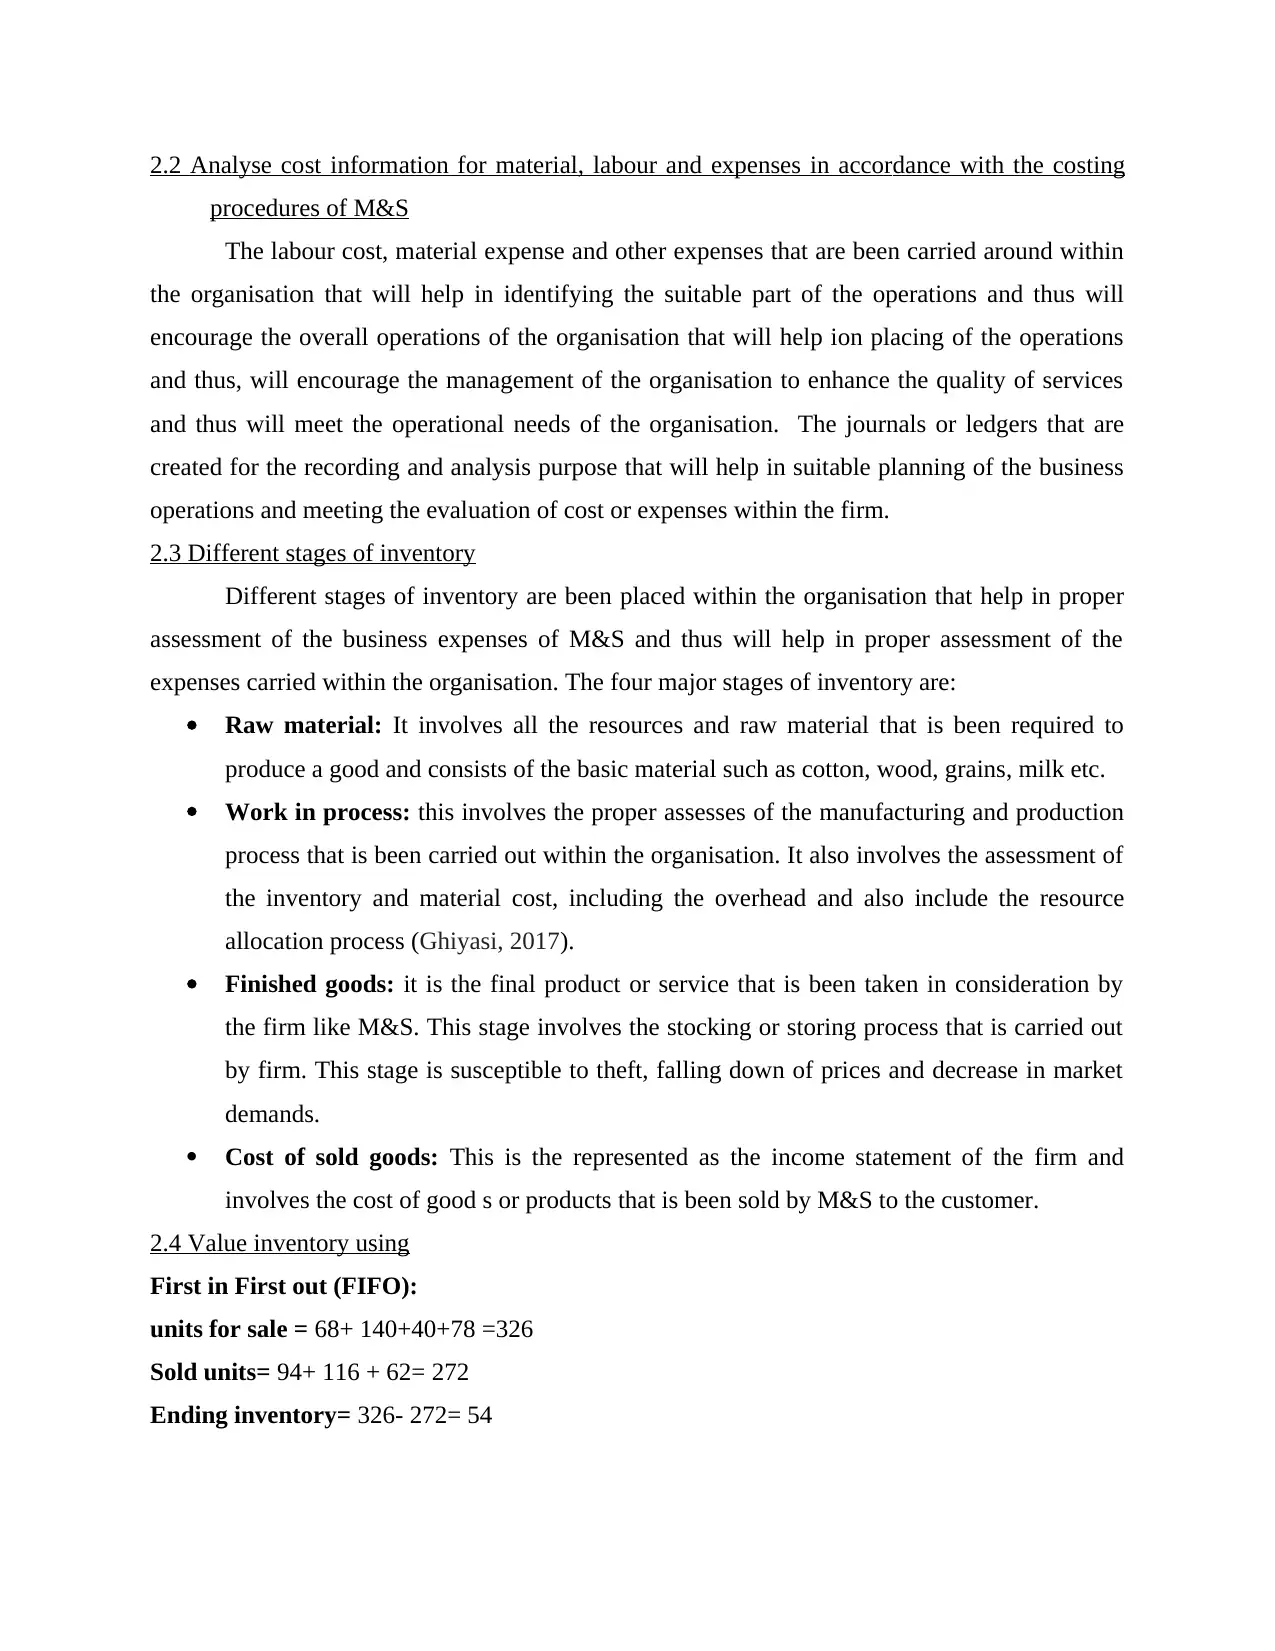
2.2 Analyse cost information for material, labour and expenses in accordance with the costing
procedures of M&S
The labour cost, material expense and other expenses that are been carried around within
the organisation that will help in identifying the suitable part of the operations and thus will
encourage the overall operations of the organisation that will help ion placing of the operations
and thus, will encourage the management of the organisation to enhance the quality of services
and thus will meet the operational needs of the organisation. The journals or ledgers that are
created for the recording and analysis purpose that will help in suitable planning of the business
operations and meeting the evaluation of cost or expenses within the firm.
2.3 Different stages of inventory
Different stages of inventory are been placed within the organisation that help in proper
assessment of the business expenses of M&S and thus will help in proper assessment of the
expenses carried within the organisation. The four major stages of inventory are:
Raw material: It involves all the resources and raw material that is been required to
produce a good and consists of the basic material such as cotton, wood, grains, milk etc.
Work in process: this involves the proper assesses of the manufacturing and production
process that is been carried out within the organisation. It also involves the assessment of
the inventory and material cost, including the overhead and also include the resource
allocation process (Ghiyasi, 2017).
Finished goods: it is the final product or service that is been taken in consideration by
the firm like M&S. This stage involves the stocking or storing process that is carried out
by firm. This stage is susceptible to theft, falling down of prices and decrease in market
demands.
Cost of sold goods: This is the represented as the income statement of the firm and
involves the cost of good s or products that is been sold by M&S to the customer.
2.4 Value inventory using
First in First out (FIFO):
units for sale = 68+ 140+40+78 =326
Sold units= 94+ 116 + 62= 272
Ending inventory= 326- 272= 54
⊘ This is a preview!⊘
Do you want full access?
Subscribe today to unlock all pages.
Trusted by 1+ million students worldwide
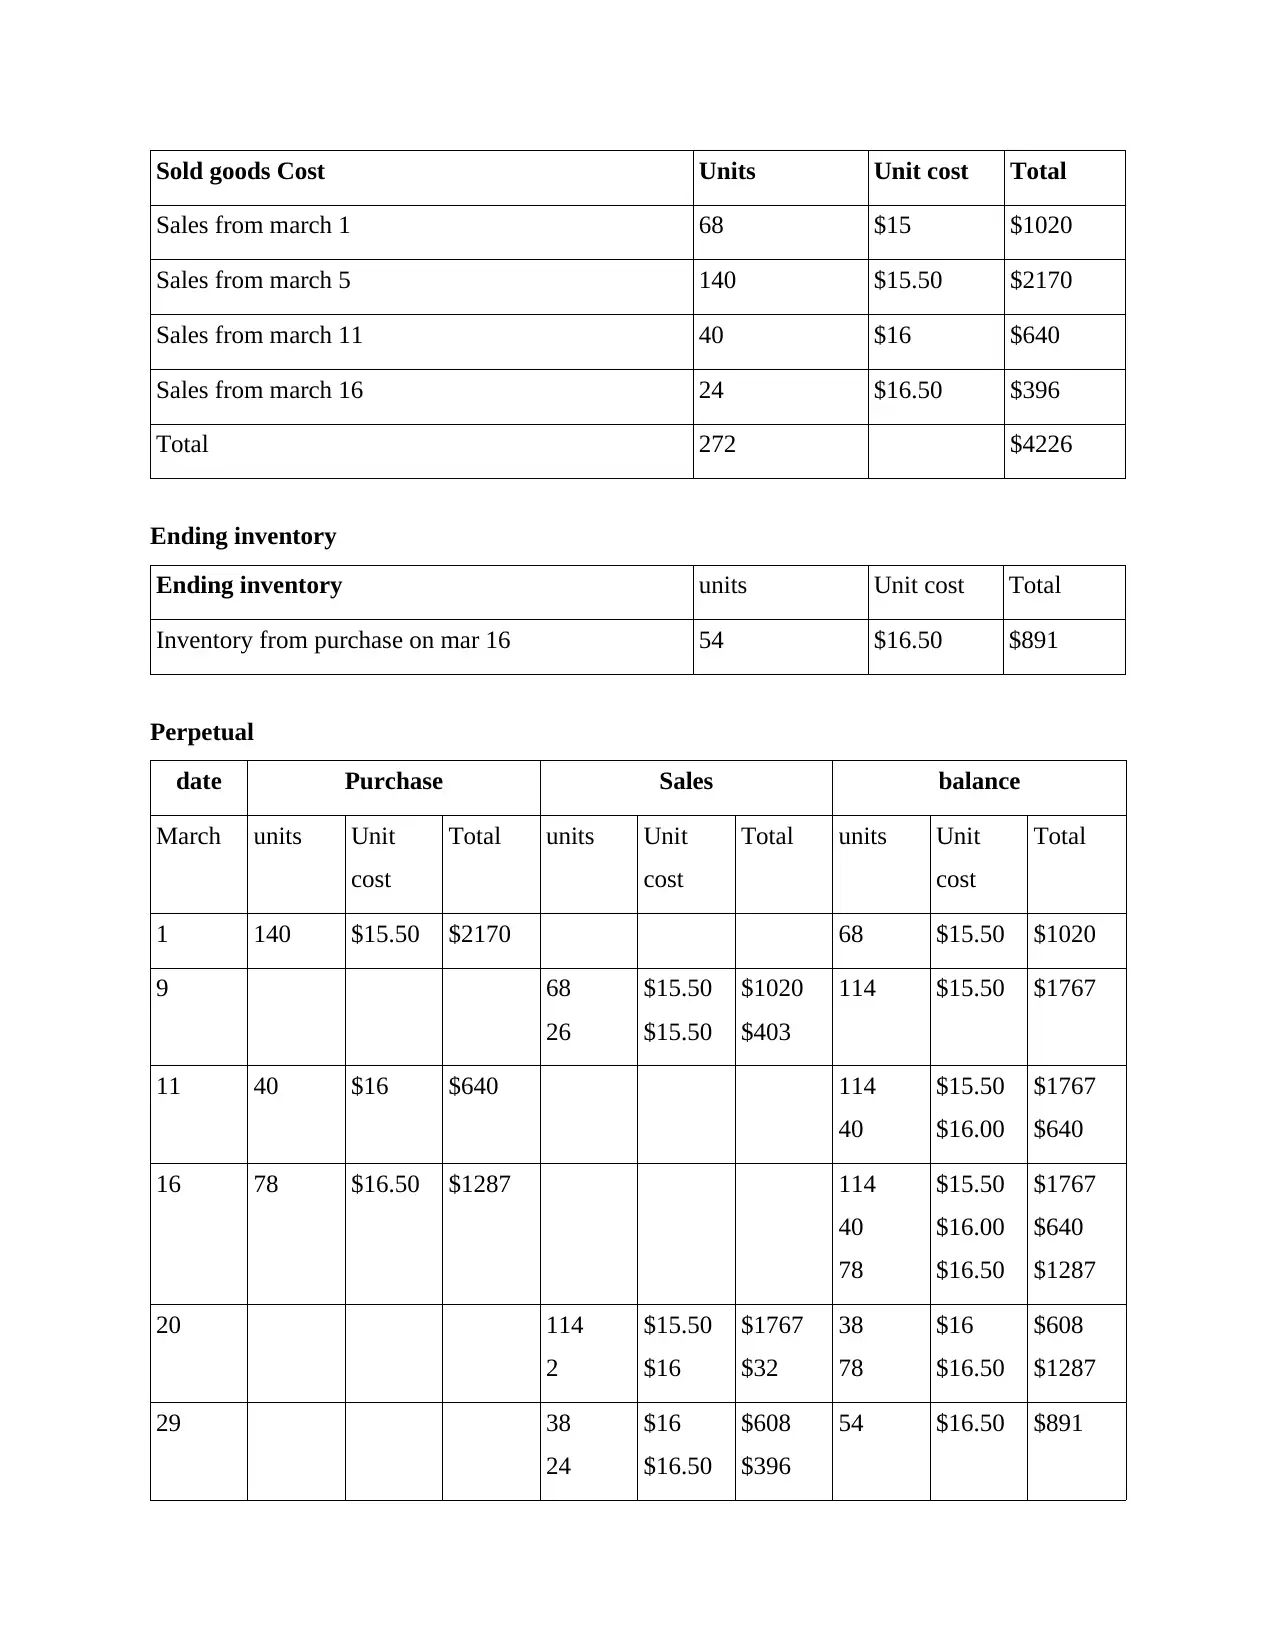
Sold goods Cost Units Unit cost Total
Sales from march 1 68 $15 $1020
Sales from march 5 140 $15.50 $2170
Sales from march 11 40 $16 $640
Sales from march 16 24 $16.50 $396
Total 272 $4226
Ending inventory
Ending inventory units Unit cost Total
Inventory from purchase on mar 16 54 $16.50 $891
Perpetual
date Purchase Sales balance
March units Unit
cost
Total units Unit
cost
Total units Unit
cost
Total
1 140 $15.50 $2170 68 $15.50 $1020
9 68
26
$15.50
$15.50
$1020
$403
114 $15.50 $1767
11 40 $16 $640 114
40
$15.50
$16.00
$1767
$640
16 78 $16.50 $1287 114
40
78
$15.50
$16.00
$16.50
$1767
$640
$1287
20 114
2
$15.50
$16
$1767
$32
38
78
$16
$16.50
$608
$1287
29 38
24
$16
$16.50
$608
$396
54 $16.50 $891
Paraphrase This Document
Need a fresh take? Get an instant paraphrase of this document with our AI Paraphraser
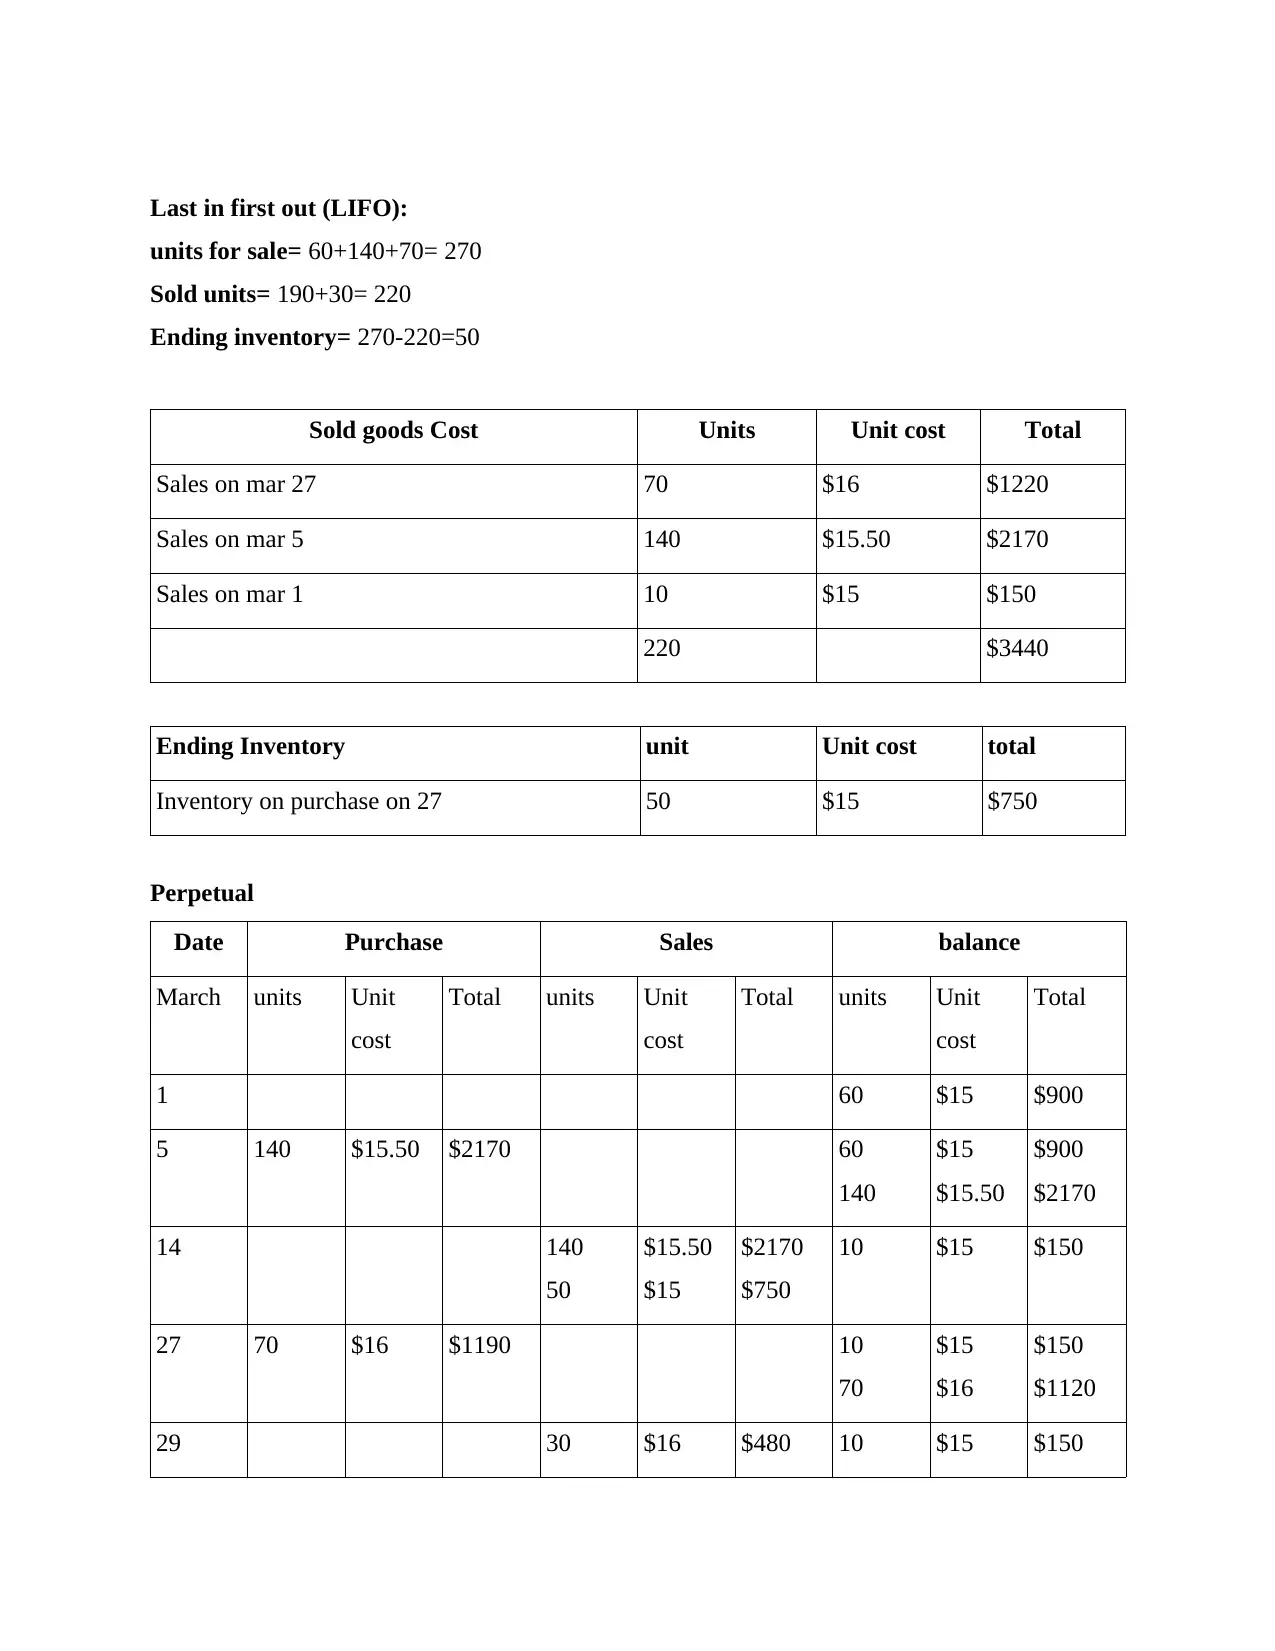
Last in first out (LIFO):
units for sale= 60+140+70= 270
Sold units= 190+30= 220
Ending inventory= 270-220=50
Sold goods Cost Units Unit cost Total
Sales on mar 27 70 $16 $1220
Sales on mar 5 140 $15.50 $2170
Sales on mar 1 10 $15 $150
220 $3440
Ending Inventory unit Unit cost total
Inventory on purchase on 27 50 $15 $750
Perpetual
Date Purchase Sales balance
March units Unit
cost
Total units Unit
cost
Total units Unit
cost
Total
1 60 $15 $900
5 140 $15.50 $2170 60
140
$15
$15.50
$900
$2170
14 140
50
$15.50
$15
$2170
$750
10 $15 $150
27 70 $16 $1190 10
70
$15
$16
$150
$1120
29 30 $16 $480 10 $15 $150
40 $16 $640
31 10
40
$15
$16
$150
$640
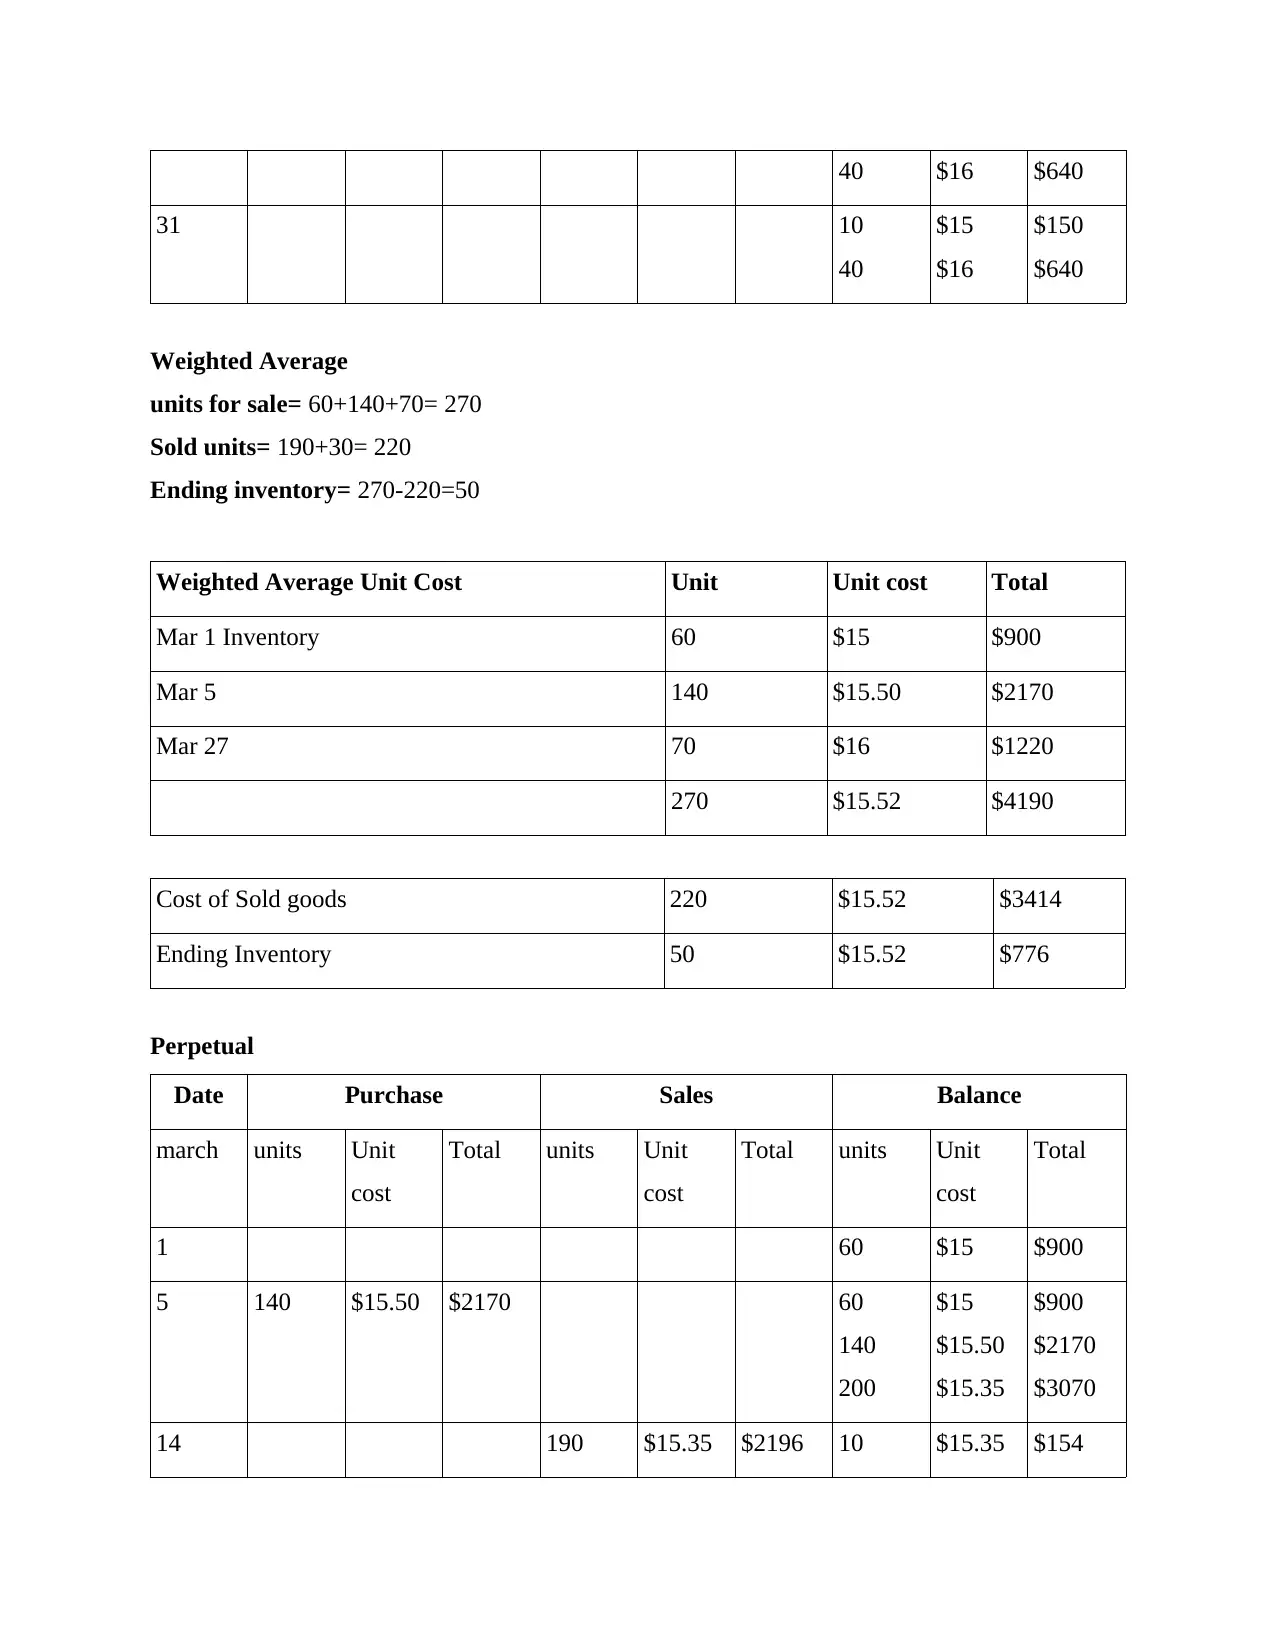
Weighted Average
units for sale= 60+140+70= 270
Sold units= 190+30= 220
Ending inventory= 270-220=50
Weighted Average Unit Cost Unit Unit cost Total
Mar 1 Inventory 60 $15 $900
Mar 5 140 $15.50 $2170
Mar 27 70 $16 $1220
270 $15.52 $4190
Cost of Sold goods 220 $15.52 $3414
Ending Inventory 50 $15.52 $776
Perpetual
Date Purchase Sales Balance
march units Unit
cost
Total units Unit
cost
Total units Unit
cost
Total
1 60 $15 $900
5 140 $15.50 $2170 60
140
200
$15
$15.50
$15.35
$900
$2170
$3070
14 190 $15.35 $2196 10 $15.35 $154
31 10
40
$15
$16
$150
$640
Weighted Average
units for sale= 60+140+70= 270
Sold units= 190+30= 220
Ending inventory= 270-220=50
Weighted Average Unit Cost Unit Unit cost Total
Mar 1 Inventory 60 $15 $900
Mar 5 140 $15.50 $2170
Mar 27 70 $16 $1220
270 $15.52 $4190
Cost of Sold goods 220 $15.52 $3414
Ending Inventory 50 $15.52 $776
Perpetual
Date Purchase Sales Balance
march units Unit
cost
Total units Unit
cost
Total units Unit
cost
Total
1 60 $15 $900
5 140 $15.50 $2170 60
140
200
$15
$15.50
$15.35
$900
$2170
$3070
14 190 $15.35 $2196 10 $15.35 $154
⊘ This is a preview!⊘
Do you want full access?
Subscribe today to unlock all pages.
Trusted by 1+ million students worldwide
27 70 $16 $1220 10
70
80
$15.35
$16
$15.92
$154
$1120
$1274
29 30 $15.92 $478 50 $15.92 $796
31 50 $15.92 $796
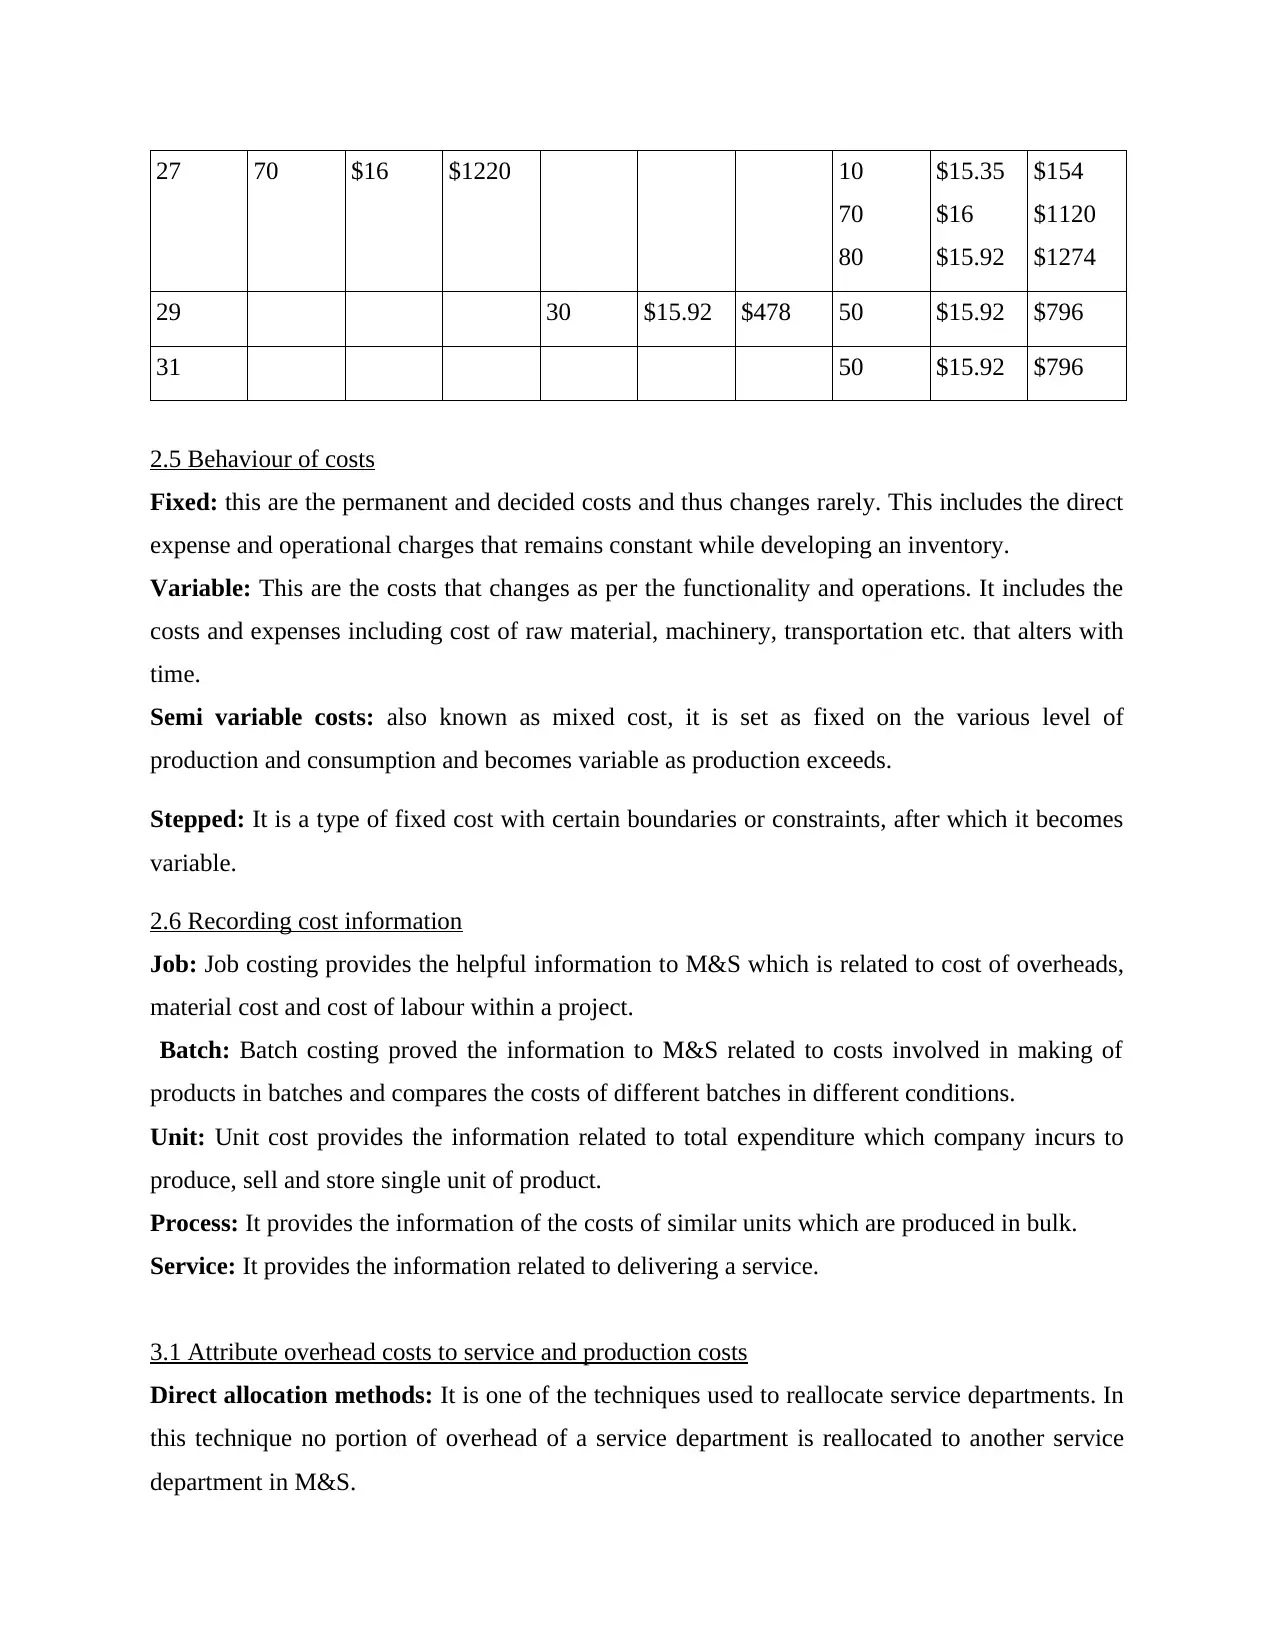
2.5 Behaviour of costs
Fixed: this are the permanent and decided costs and thus changes rarely. This includes the direct
expense and operational charges that remains constant while developing an inventory.
Variable: This are the costs that changes as per the functionality and operations. It includes the
costs and expenses including cost of raw material, machinery, transportation etc. that alters with
time.
Semi variable costs: also known as mixed cost, it is set as fixed on the various level of
production and consumption and becomes variable as production exceeds.
Stepped: It is a type of fixed cost with certain boundaries or constraints, after which it becomes
variable.
2.6 Recording cost information
Job: Job costing provides the helpful information to M&S which is related to cost of overheads,
material cost and cost of labour within a project.
Batch: Batch costing proved the information to M&S related to costs involved in making of
products in batches and compares the costs of different batches in different conditions.
Unit: Unit cost provides the information related to total expenditure which company incurs to
produce, sell and store single unit of product.
Process: It provides the information of the costs of similar units which are produced in bulk.
Service: It provides the information related to delivering a service.
3.1 Attribute overhead costs to service and production costs
Direct allocation methods: It is one of the techniques used to reallocate service departments. In
this technique no portion of overhead of a service department is reallocated to another service
department in M&S.
70
80
$15.35
$16
$15.92
$154
$1120
$1274
29 30 $15.92 $478 50 $15.92 $796
31 50 $15.92 $796
2.5 Behaviour of costs
Fixed: this are the permanent and decided costs and thus changes rarely. This includes the direct
expense and operational charges that remains constant while developing an inventory.
Variable: This are the costs that changes as per the functionality and operations. It includes the
costs and expenses including cost of raw material, machinery, transportation etc. that alters with
time.
Semi variable costs: also known as mixed cost, it is set as fixed on the various level of
production and consumption and becomes variable as production exceeds.
Stepped: It is a type of fixed cost with certain boundaries or constraints, after which it becomes
variable.
2.6 Recording cost information
Job: Job costing provides the helpful information to M&S which is related to cost of overheads,
material cost and cost of labour within a project.
Batch: Batch costing proved the information to M&S related to costs involved in making of
products in batches and compares the costs of different batches in different conditions.
Unit: Unit cost provides the information related to total expenditure which company incurs to
produce, sell and store single unit of product.
Process: It provides the information of the costs of similar units which are produced in bulk.
Service: It provides the information related to delivering a service.
3.1 Attribute overhead costs to service and production costs
Direct allocation methods: It is one of the techniques used to reallocate service departments. In
this technique no portion of overhead of a service department is reallocated to another service
department in M&S.
Paraphrase This Document
Need a fresh take? Get an instant paraphrase of this document with our AI Paraphraser
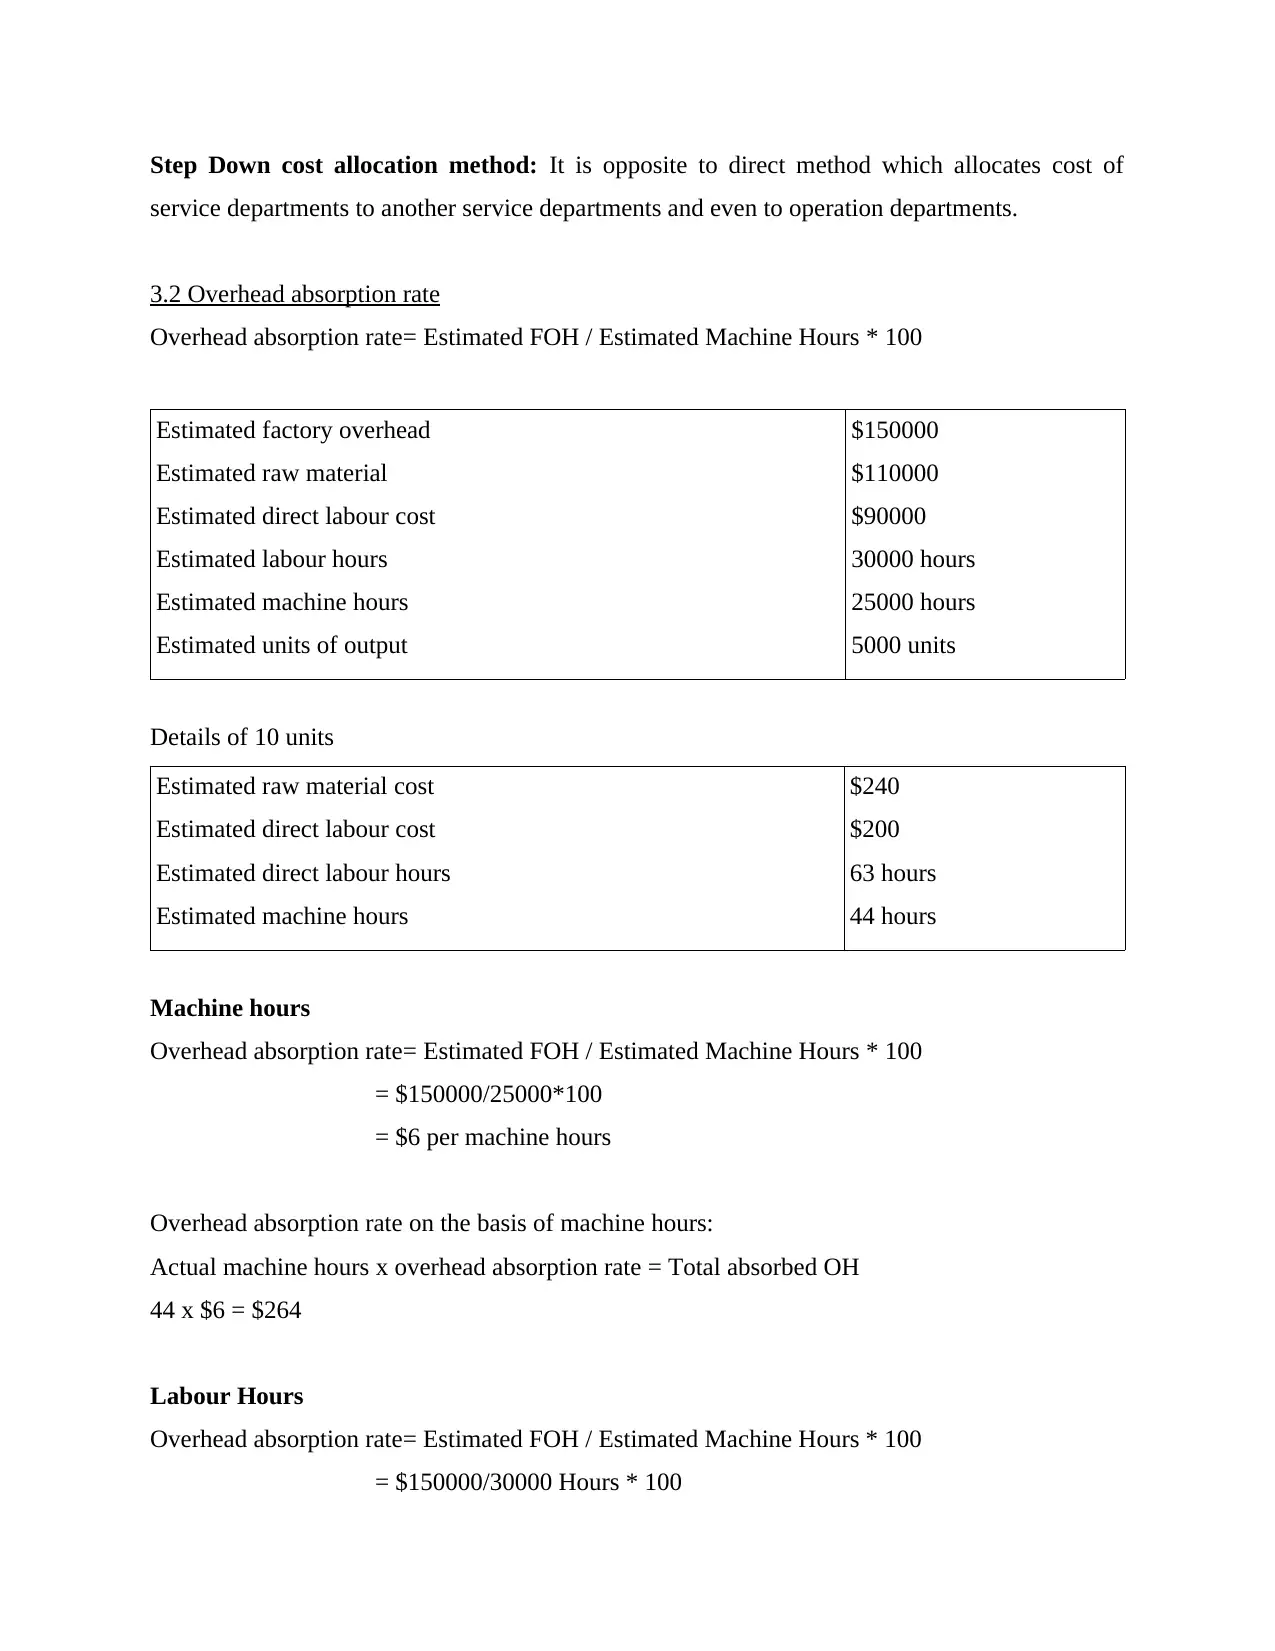
Step Down cost allocation method: It is opposite to direct method which allocates cost of
service departments to another service departments and even to operation departments.
3.2 Overhead absorption rate
Overhead absorption rate= Estimated FOH / Estimated Machine Hours * 100
Estimated factory overhead
Estimated raw material
Estimated direct labour cost
Estimated labour hours
Estimated machine hours
Estimated units of output
$150000
$110000
$90000
30000 hours
25000 hours
5000 units
Details of 10 units
Estimated raw material cost
Estimated direct labour cost
Estimated direct labour hours
Estimated machine hours
$240
$200
63 hours
44 hours
Machine hours
Overhead absorption rate= Estimated FOH / Estimated Machine Hours * 100
= $150000/25000*100
= $6 per machine hours
Overhead absorption rate on the basis of machine hours:
Actual machine hours x overhead absorption rate = Total absorbed OH
44 x $6 = $264
Labour Hours
Overhead absorption rate= Estimated FOH / Estimated Machine Hours * 100
= $150000/30000 Hours * 100
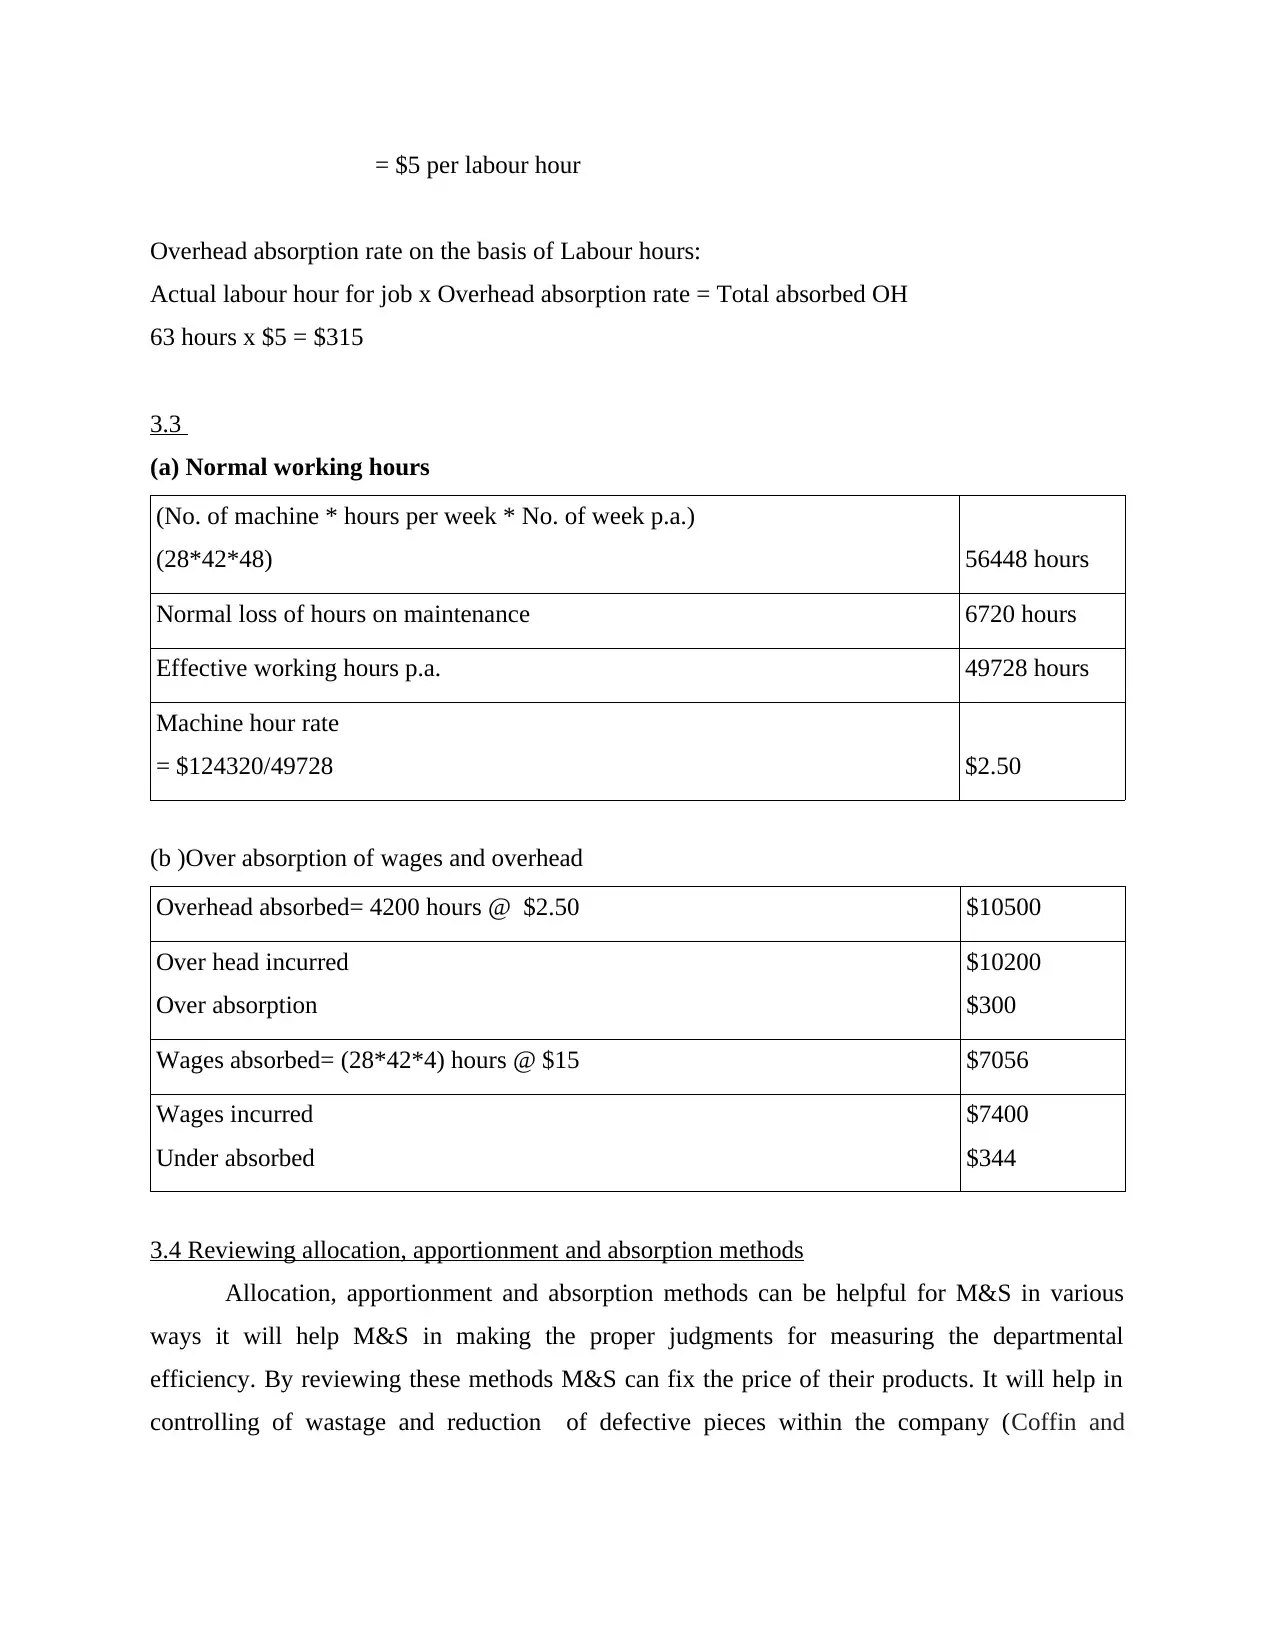
= $5 per labour hour
Overhead absorption rate on the basis of Labour hours:
Actual labour hour for job x Overhead absorption rate = Total absorbed OH
63 hours x $5 = $315
3.3
(a) Normal working hours
(No. of machine * hours per week * No. of week p.a.)
(28*42*48) 56448 hours
Normal loss of hours on maintenance 6720 hours
Effective working hours p.a. 49728 hours
Machine hour rate
= $124320/49728 $2.50
(b )Over absorption of wages and overhead
Overhead absorbed= 4200 hours @ $2.50 $10500
Over head incurred
Over absorption
$10200
$300
Wages absorbed= (28*42*4) hours @ $15 $7056
Wages incurred
Under absorbed
$7400
$344
3.4 Reviewing allocation, apportionment and absorption methods
Allocation, apportionment and absorption methods can be helpful for M&S in various
ways it will help M&S in making the proper judgments for measuring the departmental
efficiency. By reviewing these methods M&S can fix the price of their products. It will help in
controlling of wastage and reduction of defective pieces within the company (Coffin and
⊘ This is a preview!⊘
Do you want full access?
Subscribe today to unlock all pages.
Trusted by 1+ million students worldwide
1 out of 19
Related Documents


Your All-in-One AI-Powered Toolkit for Academic Success.
+13062052269
info@desklib.com
Available 24*7 on WhatsApp / Email
![[object Object]](/_next/static/media/star-bottom.7253800d.svg)
Unlock your academic potential
Copyright © 2020–2026 A2Z Services. All Rights Reserved. Developed and managed by ZUCOL.