Detailed Financial Performance Analysis: Wittgenstein Pty Ltd Budget
VerifiedAdded on 2020/05/04
|11
|2527
|84
Report
AI Summary
This report presents a comprehensive financial analysis of Wittgenstein Pty Ltd, encompassing sales, production, direct materials, direct labor, and manufacturing overhead budgets. It includes detailed calculations for each budget component, such as the sales budget, production budget, direct material purchase budget, direct labor budget, manufacturing overhead budget, and ending finished goods inventory budget. The report then delves into the cost structure analysis, evaluating relevant costs and benefits of a potential investment. Furthermore, it compares budgeted versus actual outcomes, calculating variances to assess the company's performance against its plans. Finally, the report discusses participative and imposed budgeting approaches, offering insights for the production manager. The analysis covers key financial statements like the cost of goods sold budget, budgeted income statement, and cash budget, providing a holistic view of the company's financial position and performance.
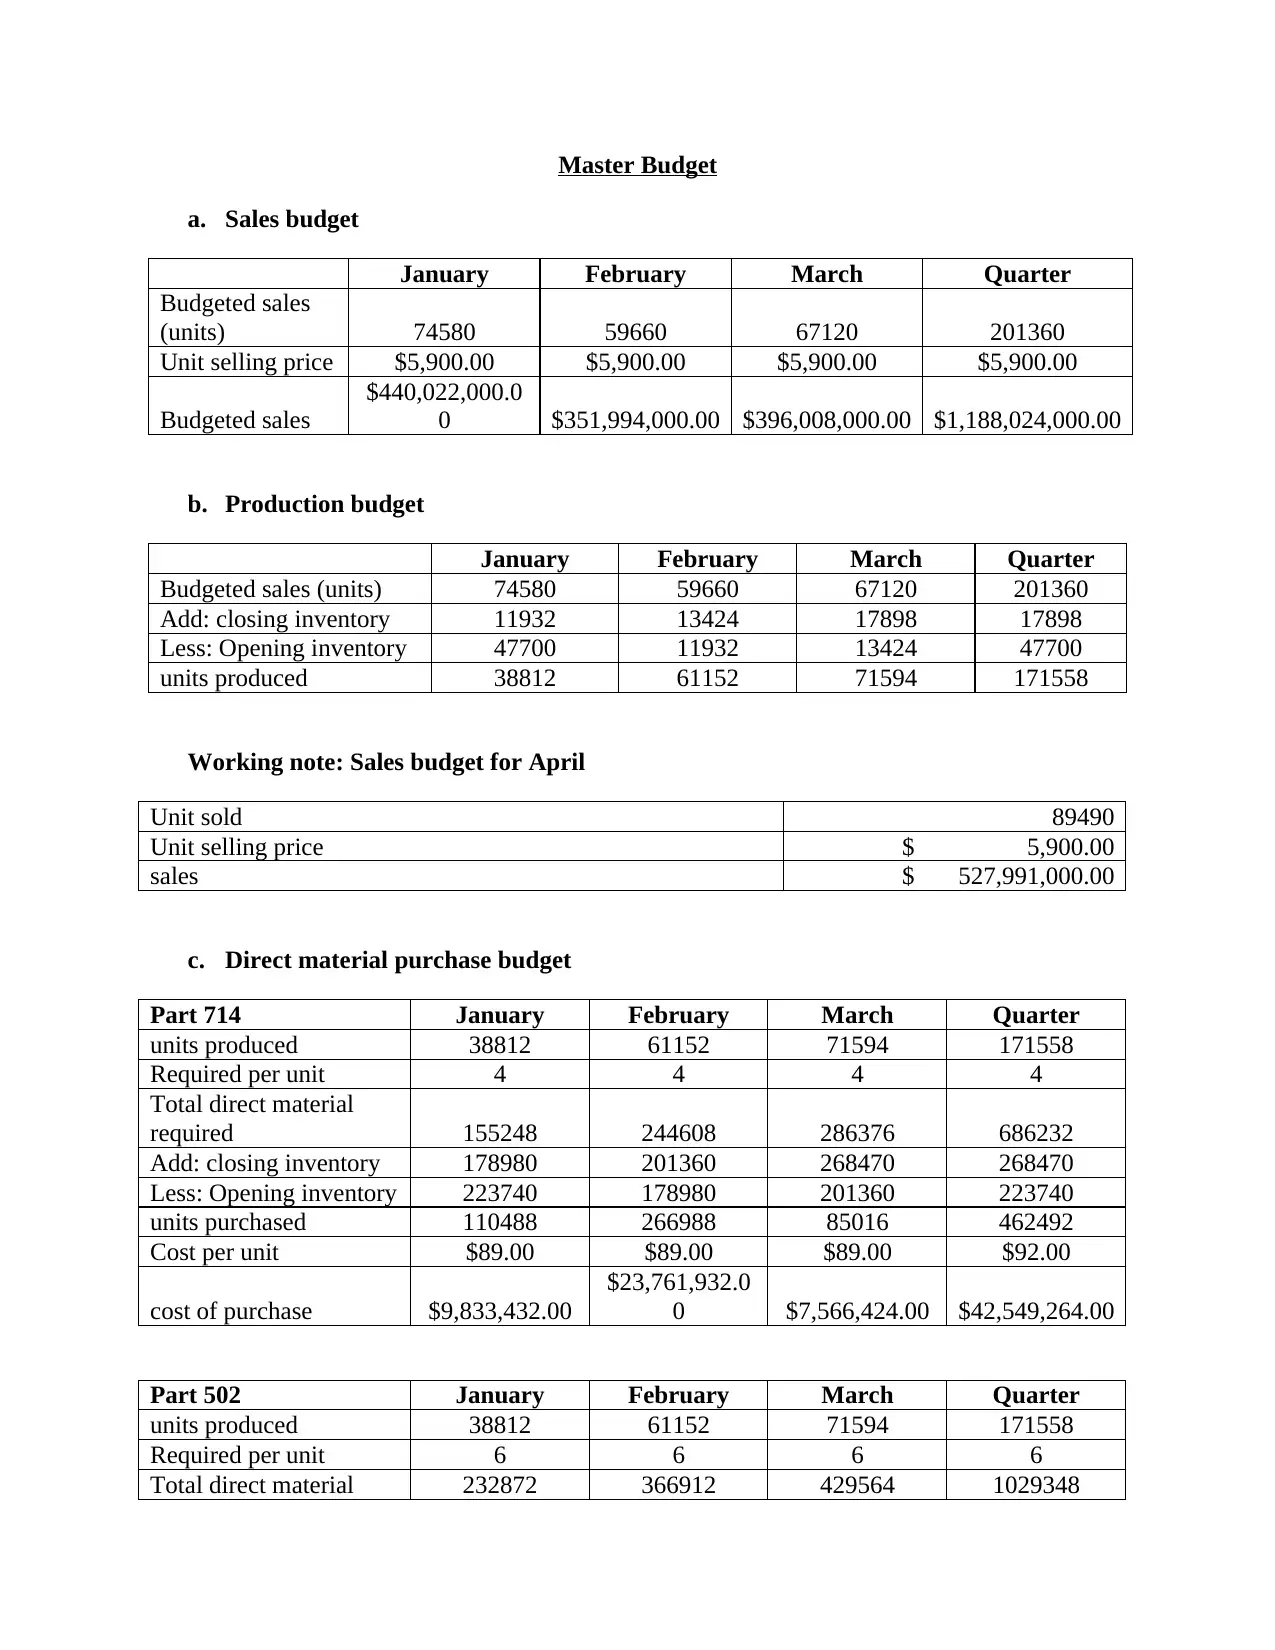
Master Budget
a. Sales budget
January February March Quarter
Budgeted sales
(units) 74580 59660 67120 201360
Unit selling price $5,900.00 $5,900.00 $5,900.00 $5,900.00
Budgeted sales
$440,022,000.0
0 $351,994,000.00 $396,008,000.00 $1,188,024,000.00
b. Production budget
January February March Quarter
Budgeted sales (units) 74580 59660 67120 201360
Add: closing inventory 11932 13424 17898 17898
Less: Opening inventory 47700 11932 13424 47700
units produced 38812 61152 71594 171558
Working note: Sales budget for April
Unit sold 89490
Unit selling price $ 5,900.00
sales $ 527,991,000.00
c. Direct material purchase budget
Part 714 January February March Quarter
units produced 38812 61152 71594 171558
Required per unit 4 4 4 4
Total direct material
required 155248 244608 286376 686232
Add: closing inventory 178980 201360 268470 268470
Less: Opening inventory 223740 178980 201360 223740
units purchased 110488 266988 85016 462492
Cost per unit $89.00 $89.00 $89.00 $92.00
cost of purchase $9,833,432.00
$23,761,932.0
0 $7,566,424.00 $42,549,264.00
Part 502 January February March Quarter
units produced 38812 61152 71594 171558
Required per unit 6 6 6 6
Total direct material 232872 366912 429564 1029348
Paraphrase This Document
Need a fresh take? Get an instant paraphrase of this document with our AI Paraphraser
required
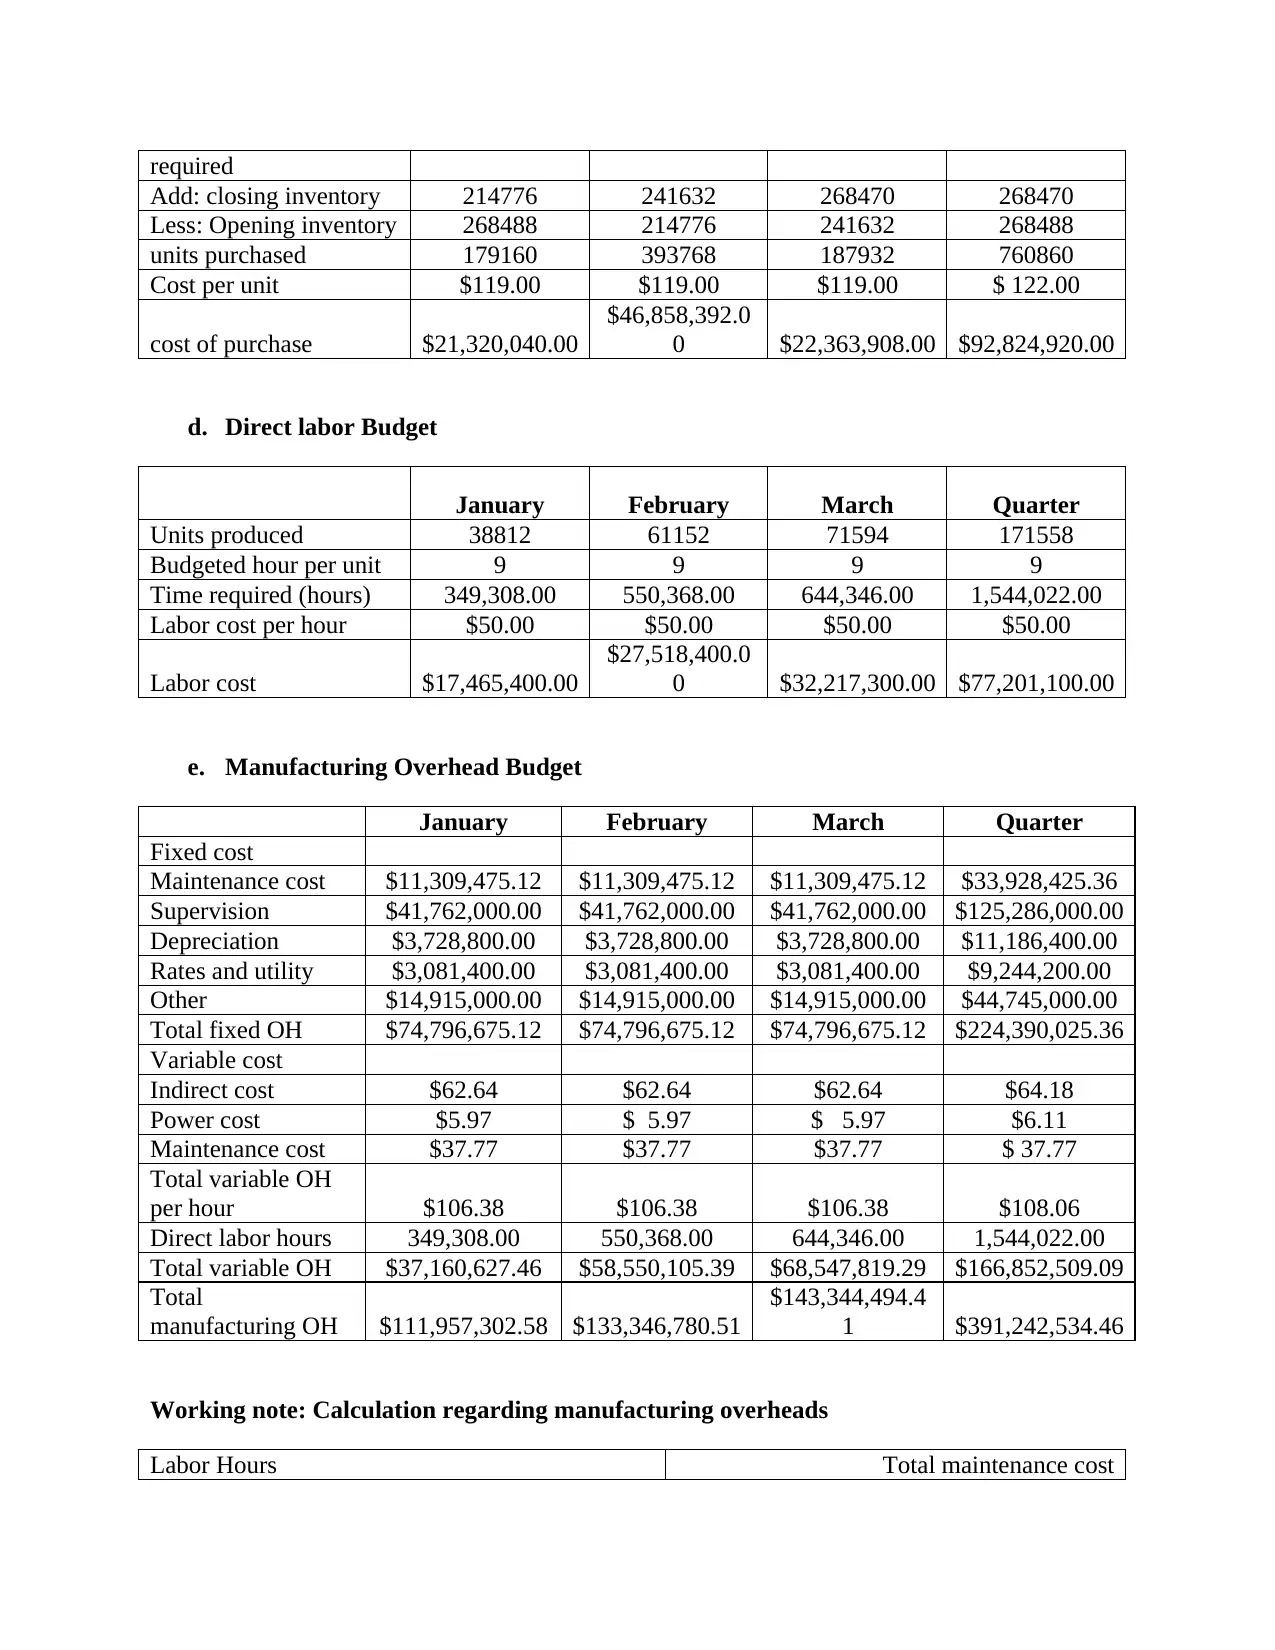
Add: closing inventory 214776 241632 268470 268470
Less: Opening inventory 268488 214776 241632 268488
units purchased 179160 393768 187932 760860
Cost per unit $119.00 $119.00 $119.00 $ 122.00
cost of purchase $21,320,040.00
$46,858,392.0
0 $22,363,908.00 $92,824,920.00
d. Direct labor Budget
January February March Quarter
Units produced 38812 61152 71594 171558
Budgeted hour per unit 9 9 9 9
Time required (hours) 349,308.00 550,368.00 644,346.00 1,544,022.00
Labor cost per hour $50.00 $50.00 $50.00 $50.00
Labor cost $17,465,400.00
$27,518,400.0
0 $32,217,300.00 $77,201,100.00
e. Manufacturing Overhead Budget
January February March Quarter
Fixed cost
Maintenance cost $11,309,475.12 $11,309,475.12 $11,309,475.12 $33,928,425.36
Supervision $41,762,000.00 $41,762,000.00 $41,762,000.00 $125,286,000.00
Depreciation $3,728,800.00 $3,728,800.00 $3,728,800.00 $11,186,400.00
Rates and utility $3,081,400.00 $3,081,400.00 $3,081,400.00 $9,244,200.00
Other $14,915,000.00 $14,915,000.00 $14,915,000.00 $44,745,000.00
Total fixed OH $74,796,675.12 $74,796,675.12 $74,796,675.12 $224,390,025.36
Variable cost
Indirect cost $62.64 $62.64 $62.64 $64.18
Power cost $5.97 $ 5.97 $ 5.97 $6.11
Maintenance cost $37.77 $37.77 $37.77 $ 37.77
Total variable OH
per hour $106.38 $106.38 $106.38 $108.06
Direct labor hours 349,308.00 550,368.00 644,346.00 1,544,022.00
Total variable OH $37,160,627.46 $58,550,105.39 $68,547,819.29 $166,852,509.09
Total
manufacturing OH $111,957,302.58 $133,346,780.51
$143,344,494.4
1 $391,242,534.46
Working note: Calculation regarding manufacturing overheads
Labor Hours Total maintenance cost
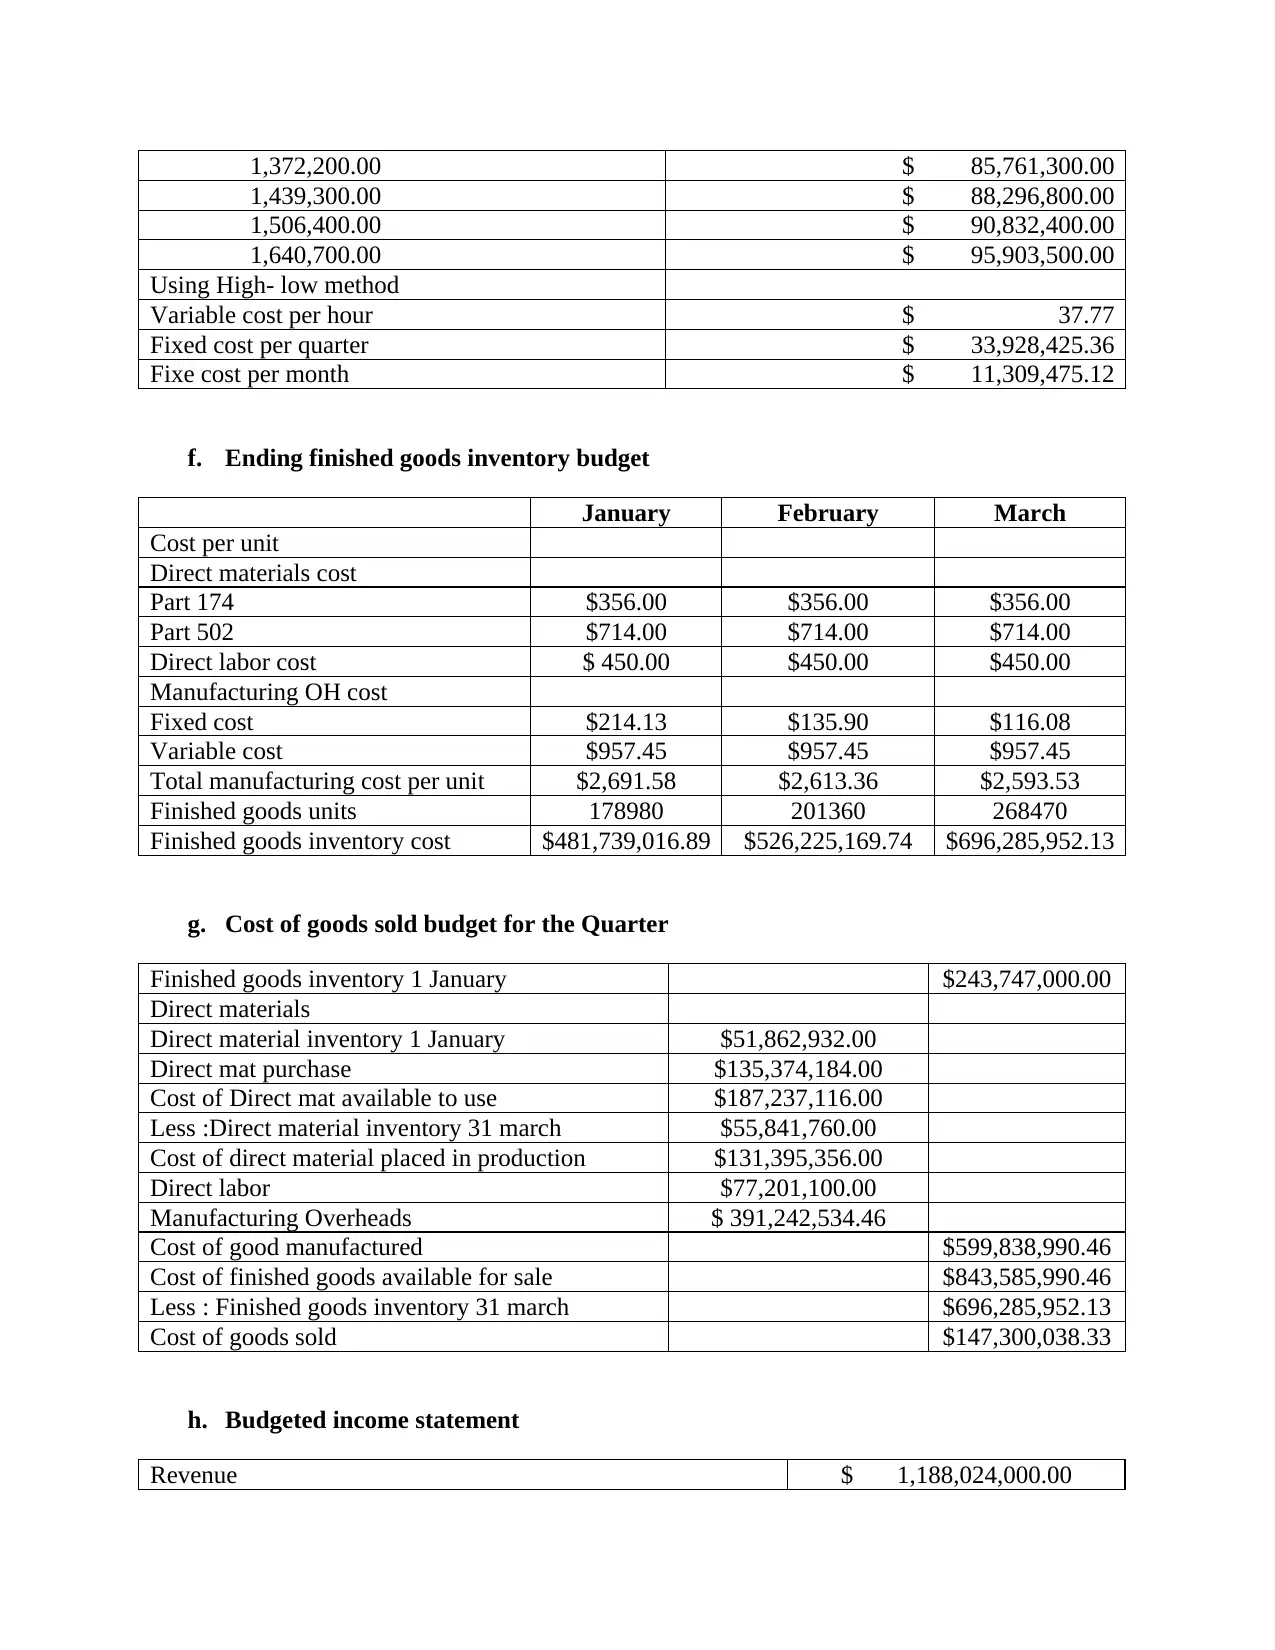
1,372,200.00 $ 85,761,300.00
1,439,300.00 $ 88,296,800.00
1,506,400.00 $ 90,832,400.00
1,640,700.00 $ 95,903,500.00
Using High- low method
Variable cost per hour $ 37.77
Fixed cost per quarter $ 33,928,425.36
Fixe cost per month $ 11,309,475.12
f. Ending finished goods inventory budget
January February March
Cost per unit
Direct materials cost
Part 174 $356.00 $356.00 $356.00
Part 502 $714.00 $714.00 $714.00
Direct labor cost $ 450.00 $450.00 $450.00
Manufacturing OH cost
Fixed cost $214.13 $135.90 $116.08
Variable cost $957.45 $957.45 $957.45
Total manufacturing cost per unit $2,691.58 $2,613.36 $2,593.53
Finished goods units 178980 201360 268470
Finished goods inventory cost $481,739,016.89 $526,225,169.74 $696,285,952.13
g. Cost of goods sold budget for the Quarter
Finished goods inventory 1 January $243,747,000.00
Direct materials
Direct material inventory 1 January $51,862,932.00
Direct mat purchase $135,374,184.00
Cost of Direct mat available to use $187,237,116.00
Less :Direct material inventory 31 march $55,841,760.00
Cost of direct material placed in production $131,395,356.00
Direct labor $77,201,100.00
Manufacturing Overheads $ 391,242,534.46
Cost of good manufactured $599,838,990.46
Cost of finished goods available for sale $843,585,990.46
Less : Finished goods inventory 31 march $696,285,952.13
Cost of goods sold $147,300,038.33
h. Budgeted income statement
Revenue $ 1,188,024,000.00
⊘ This is a preview!⊘
Do you want full access?
Subscribe today to unlock all pages.
Trusted by 1+ million students worldwide
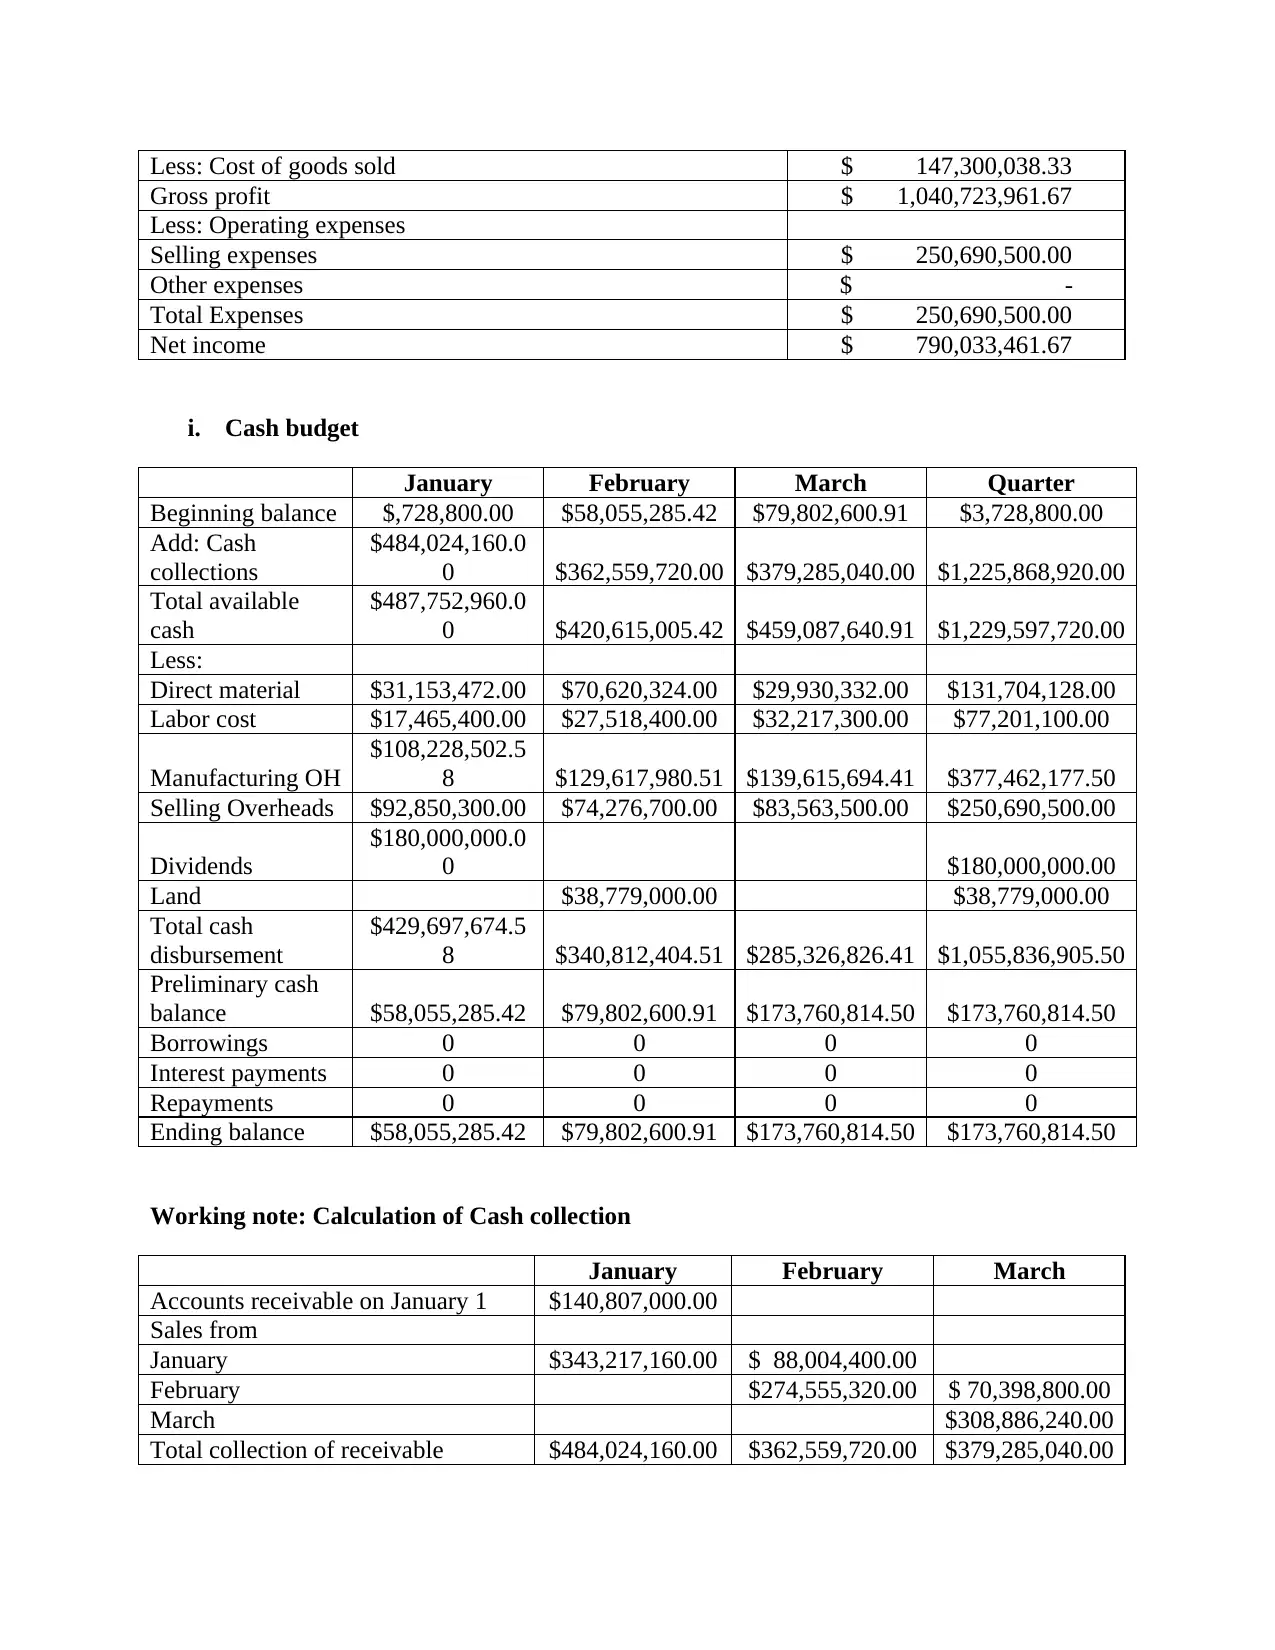
Less: Cost of goods sold $ 147,300,038.33
Gross profit $ 1,040,723,961.67
Less: Operating expenses
Selling expenses $ 250,690,500.00
Other expenses $ -
Total Expenses $ 250,690,500.00
Net income $ 790,033,461.67
i. Cash budget
January February March Quarter
Beginning balance $,728,800.00 $58,055,285.42 $79,802,600.91 $3,728,800.00
Add: Cash
collections
$484,024,160.0
0 $362,559,720.00 $379,285,040.00 $1,225,868,920.00
Total available
cash
$487,752,960.0
0 $420,615,005.42 $459,087,640.91 $1,229,597,720.00
Less:
Direct material $31,153,472.00 $70,620,324.00 $29,930,332.00 $131,704,128.00
Labor cost $17,465,400.00 $27,518,400.00 $32,217,300.00 $77,201,100.00
Manufacturing OH
$108,228,502.5
8 $129,617,980.51 $139,615,694.41 $377,462,177.50
Selling Overheads $92,850,300.00 $74,276,700.00 $83,563,500.00 $250,690,500.00
Dividends
$180,000,000.0
0 $180,000,000.00
Land $38,779,000.00 $38,779,000.00
Total cash
disbursement
$429,697,674.5
8 $340,812,404.51 $285,326,826.41 $1,055,836,905.50
Preliminary cash
balance $58,055,285.42 $79,802,600.91 $173,760,814.50 $173,760,814.50
Borrowings 0 0 0 0
Interest payments 0 0 0 0
Repayments 0 0 0 0
Ending balance $58,055,285.42 $79,802,600.91 $173,760,814.50 $173,760,814.50
Working note: Calculation of Cash collection
January February March
Accounts receivable on January 1 $140,807,000.00
Sales from
January $343,217,160.00 $ 88,004,400.00
February $274,555,320.00 $ 70,398,800.00
March $308,886,240.00
Total collection of receivable $484,024,160.00 $362,559,720.00 $379,285,040.00
Paraphrase This Document
Need a fresh take? Get an instant paraphrase of this document with our AI Paraphraser
Report on the impact of Cost Structures
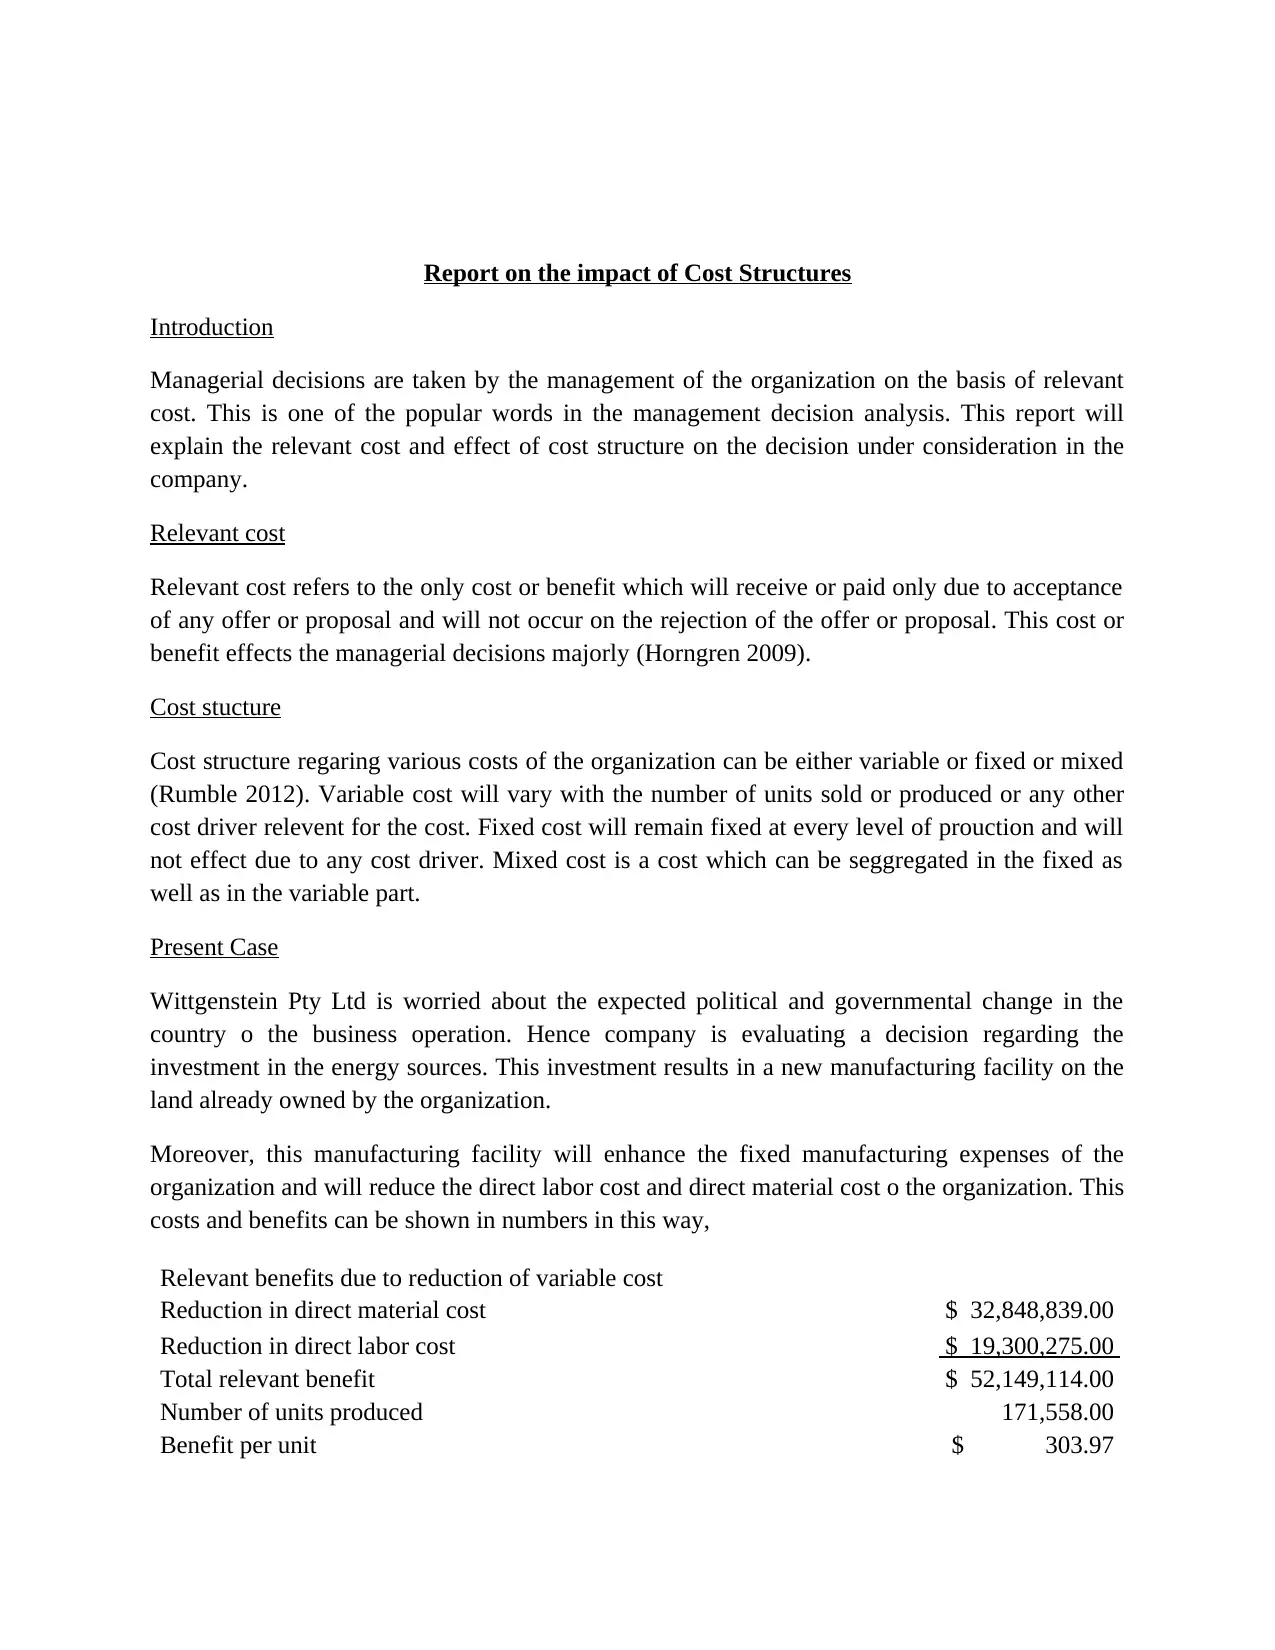
Introduction
Managerial decisions are taken by the management of the organization on the basis of relevant
cost. This is one of the popular words in the management decision analysis. This report will
explain the relevant cost and effect of cost structure on the decision under consideration in the
company.
Relevant cost
Relevant cost refers to the only cost or benefit which will receive or paid only due to acceptance
of any offer or proposal and will not occur on the rejection of the offer or proposal. This cost or
benefit effects the managerial decisions majorly (Horngren 2009).
Cost stucture
Cost structure regaring various costs of the organization can be either variable or fixed or mixed
(Rumble 2012). Variable cost will vary with the number of units sold or produced or any other
cost driver relevent for the cost. Fixed cost will remain fixed at every level of prouction and will
not effect due to any cost driver. Mixed cost is a cost which can be seggregated in the fixed as
well as in the variable part.
Present Case
Wittgenstein Pty Ltd is worried about the expected political and governmental change in the
country o the business operation. Hence company is evaluating a decision regarding the
investment in the energy sources. This investment results in a new manufacturing facility on the
land already owned by the organization.
Moreover, this manufacturing facility will enhance the fixed manufacturing expenses of the
organization and will reduce the direct labor cost and direct material cost o the organization. This
costs and benefits can be shown in numbers in this way,
Relevant benefits due to reduction of variable cost
Reduction in direct material cost $ 32,848,839.00
Reduction in direct labor cost $ 19,300,275.00
Total relevant benefit $ 52,149,114.00
Number of units produced 171,558.00
Benefit per unit $ 303.97
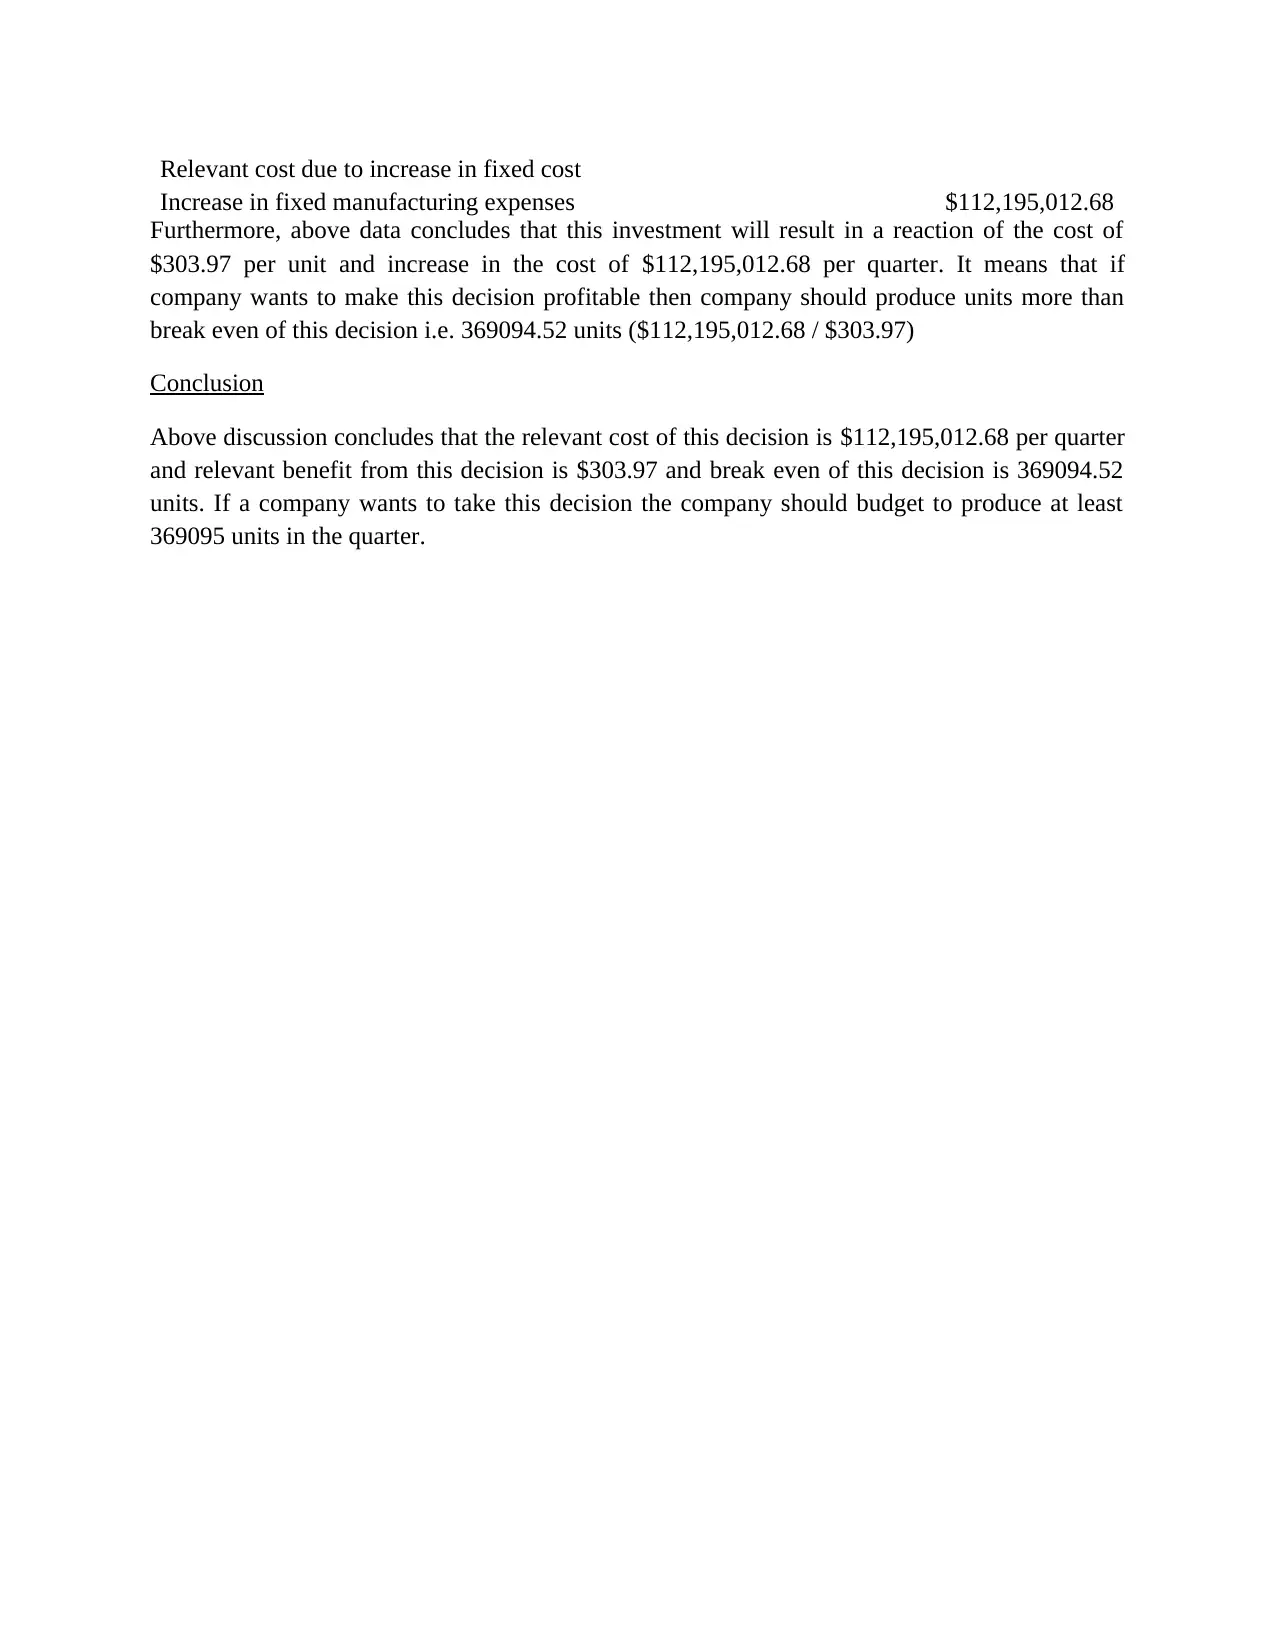
Relevant cost due to increase in fixed cost
Increase in fixed manufacturing expenses $112,195,012.68
Furthermore, above data concludes that this investment will result in a reaction of the cost of
$303.97 per unit and increase in the cost of $112,195,012.68 per quarter. It means that if
company wants to make this decision profitable then company should produce units more than
break even of this decision i.e. 369094.52 units ($112,195,012.68 / $303.97)
Conclusion
Above discussion concludes that the relevant cost of this decision is $112,195,012.68 per quarter
and relevant benefit from this decision is $303.97 and break even of this decision is 369094.52
units. If a company wants to take this decision the company should budget to produce at least
369095 units in the quarter.
⊘ This is a preview!⊘
Do you want full access?
Subscribe today to unlock all pages.
Trusted by 1+ million students worldwide
Report on the Budgeted versus Actual Outcomes
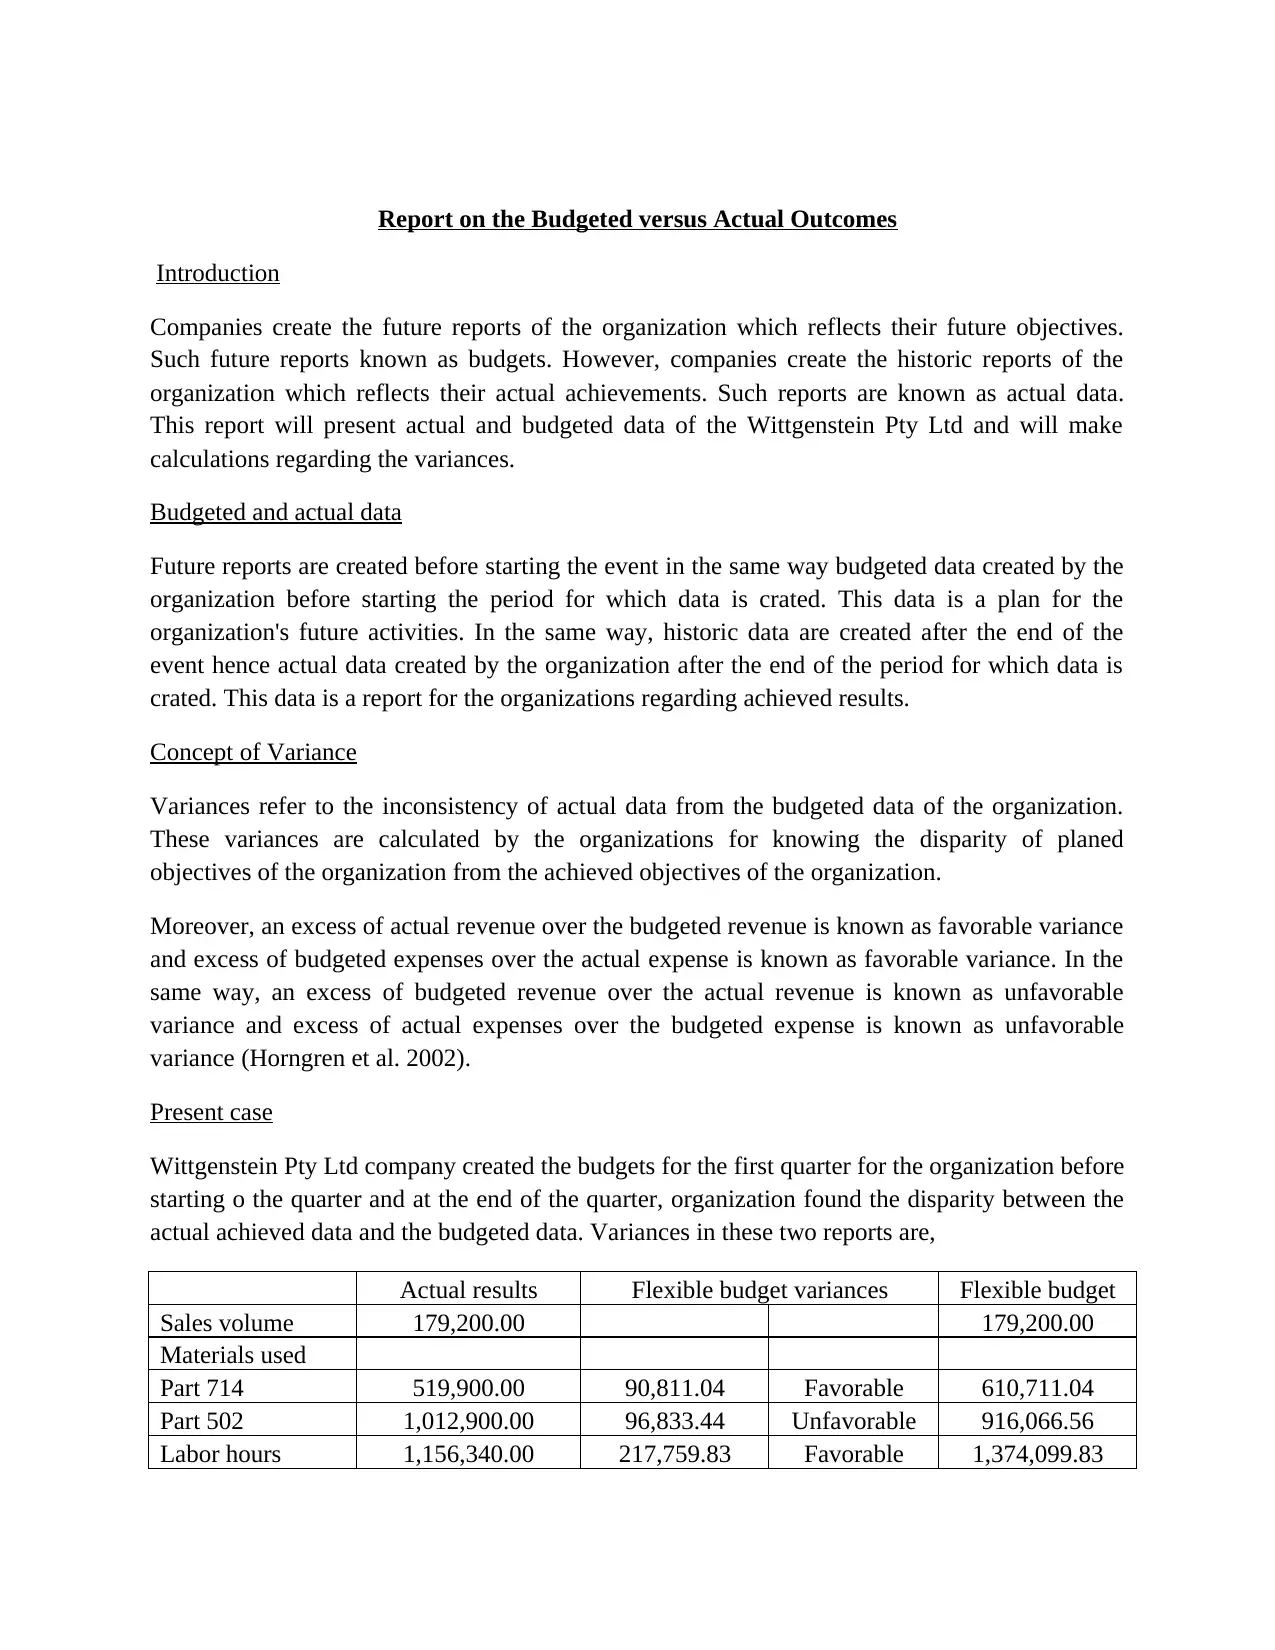
Introduction
Companies create the future reports of the organization which reflects their future objectives.
Such future reports known as budgets. However, companies create the historic reports of the
organization which reflects their actual achievements. Such reports are known as actual data.
This report will present actual and budgeted data of the Wittgenstein Pty Ltd and will make
calculations regarding the variances.
Budgeted and actual data
Future reports are created before starting the event in the same way budgeted data created by the
organization before starting the period for which data is crated. This data is a plan for the
organization's future activities. In the same way, historic data are created after the end of the
event hence actual data created by the organization after the end of the period for which data is
crated. This data is a report for the organizations regarding achieved results.
Concept of Variance
Variances refer to the inconsistency of actual data from the budgeted data of the organization.
These variances are calculated by the organizations for knowing the disparity of planed
objectives of the organization from the achieved objectives of the organization.
Moreover, an excess of actual revenue over the budgeted revenue is known as favorable variance
and excess of budgeted expenses over the actual expense is known as favorable variance. In the
same way, an excess of budgeted revenue over the actual revenue is known as unfavorable
variance and excess of actual expenses over the budgeted expense is known as unfavorable
variance (Horngren et al. 2002).
Present case
Wittgenstein Pty Ltd company created the budgets for the first quarter for the organization before
starting o the quarter and at the end of the quarter, organization found the disparity between the
actual achieved data and the budgeted data. Variances in these two reports are,
Actual results Flexible budget variances Flexible budget
Sales volume 179,200.00 179,200.00
Materials used
Part 714 519,900.00 90,811.04 Favorable 610,711.04
Part 502 1,012,900.00 96,833.44 Unfavorable 916,066.56
Labor hours 1,156,340.00 217,759.83 Favorable 1,374,099.83
Paraphrase This Document
Need a fresh take? Get an instant paraphrase of this document with our AI Paraphraser
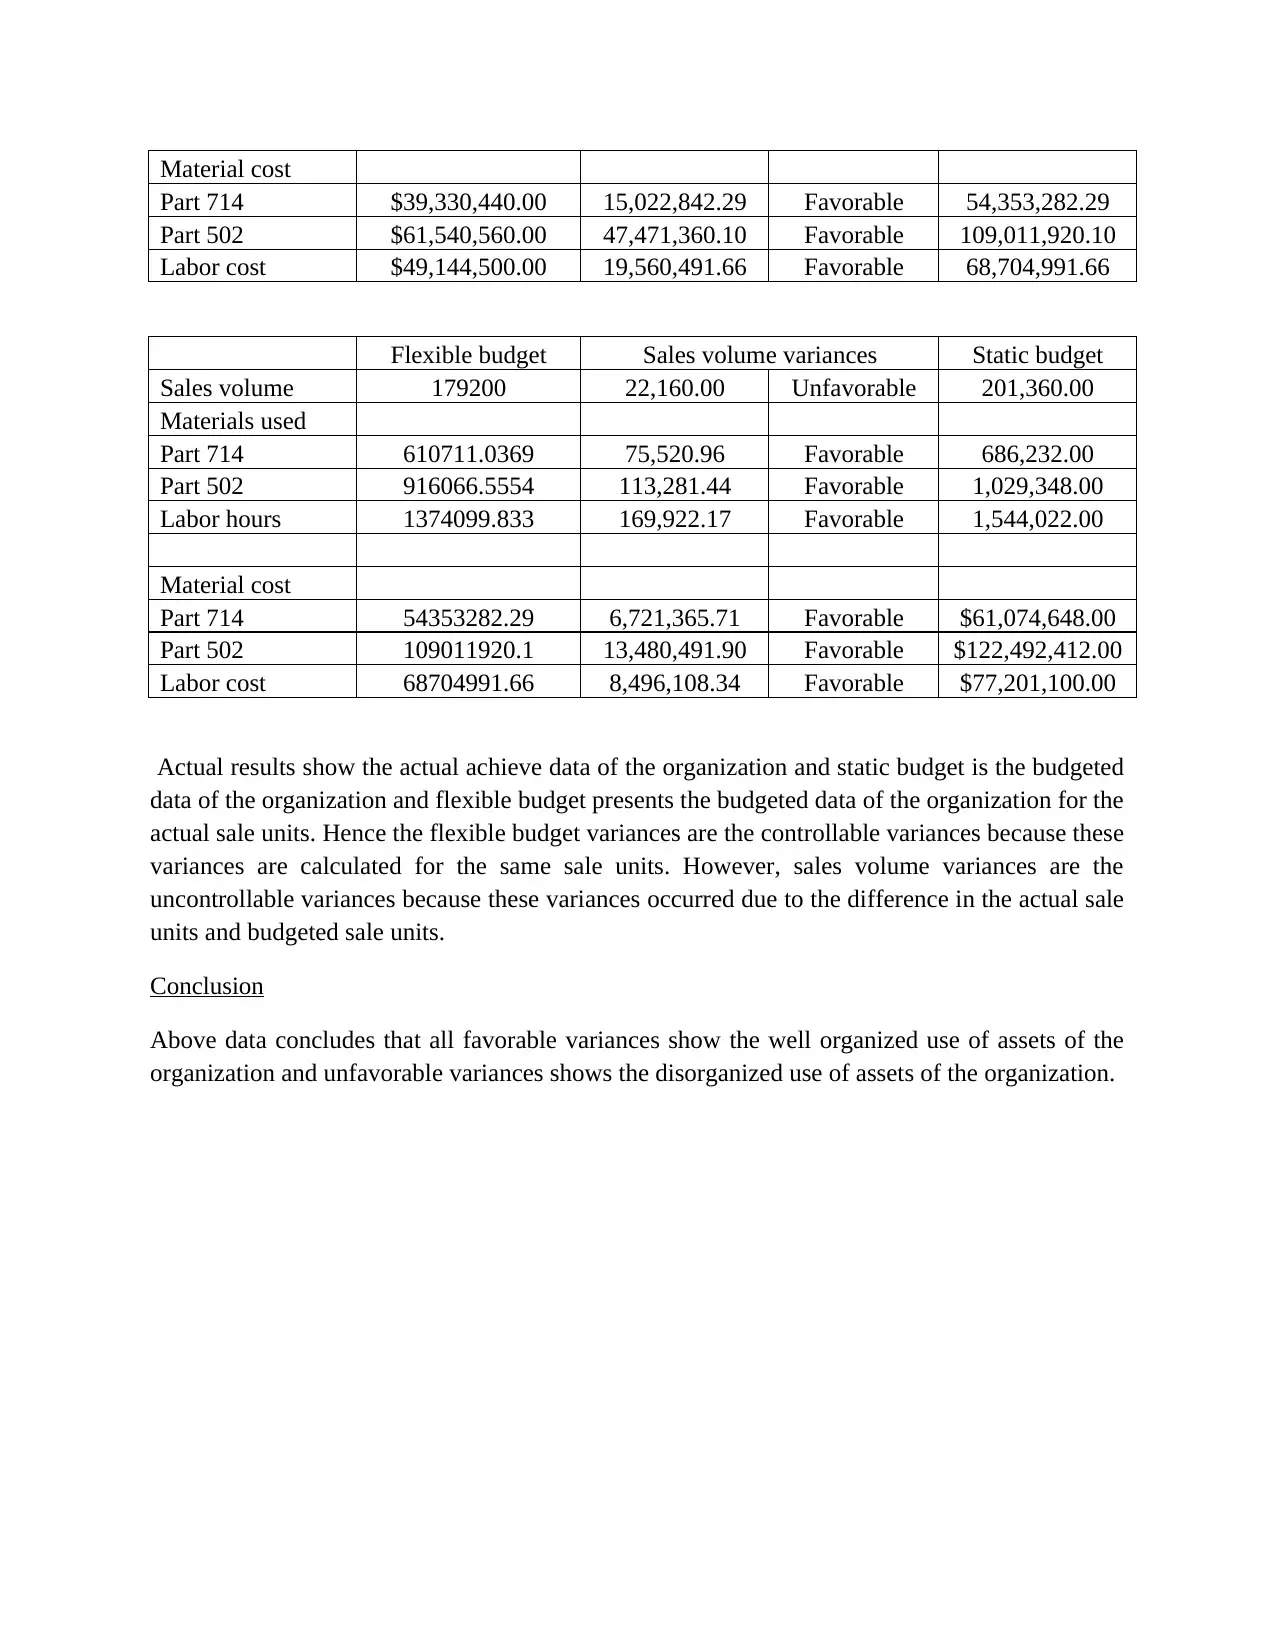
Material cost
Part 714 $39,330,440.00 15,022,842.29 Favorable 54,353,282.29
Part 502 $61,540,560.00 47,471,360.10 Favorable 109,011,920.10
Labor cost $49,144,500.00 19,560,491.66 Favorable 68,704,991.66
Flexible budget Sales volume variances Static budget
Sales volume 179200 22,160.00 Unfavorable 201,360.00
Materials used
Part 714 610711.0369 75,520.96 Favorable 686,232.00
Part 502 916066.5554 113,281.44 Favorable 1,029,348.00
Labor hours 1374099.833 169,922.17 Favorable 1,544,022.00
Material cost
Part 714 54353282.29 6,721,365.71 Favorable $61,074,648.00
Part 502 109011920.1 13,480,491.90 Favorable $122,492,412.00
Labor cost 68704991.66 8,496,108.34 Favorable $77,201,100.00
Actual results show the actual achieve data of the organization and static budget is the budgeted
data of the organization and flexible budget presents the budgeted data of the organization for the
actual sale units. Hence the flexible budget variances are the controllable variances because these
variances are calculated for the same sale units. However, sales volume variances are the
uncontrollable variances because these variances occurred due to the difference in the actual sale
units and budgeted sale units.
Conclusion
Above data concludes that all favorable variances show the well organized use of assets of the
organization and unfavorable variances shows the disorganized use of assets of the organization.
Discussion on Participative and imposed Budgeting
Introduction
Participatory approach and the imposed approach are two approaches which can be used by the
organization for budget formation process. The imposed budgetary approach means the
approach in which budgets are prepared by the top management of the organization and followed
by the all levels of the management. The participatory budgetary approach means the approach
in which budgets are prepared by the all management level of the organization and followed by
the all levels of the management. This report will explain regarding this two budgeting approach
and will explain to the production manager of the Wittgenstein Pty Ltd regarding the responses
after using these two approaches.
Participatory budgetary approach
Under this approach, budgets are applied and created by the same people because participatory
budgetary approach means the approach in which budgets are prepared by the all management
level of the organization and followed by all levels of the management (Shah 2007). This budget
includes the person going to affect directly from the budget in the budget creation process. Such
thing will enhance the motivation of employees because they feel emotionally attached to the
organization. Such enhancement of motivation creates a feeling that goals specified in the
budgets are their personal goals and they must give their 100% potential to achieve those goals.
The participatory budgetary approach is known as the bottom up approach of budget creation.
However, this approach makes budget creation process as costly and time taking process due to
the administration of all management level.
Moreover, if this budget will create by using participatory budgeting approach then production
manager of the organization should consider the fact that company’s budget was not achieved by
the organization in terms of budgeted sales volume. The Higher motivation of all employees of
the organization becomes unable to achieve objectives.
Imposed budgetary approach
Under this approach, budgets are applied and created by the different people imposed budgetary
approach means the approach in which budgets are prepared by the top management of the
organization and followed by the all levels of the management (Hansen, Mowen & Guan 2007).
This budget does not include the person going to affect directly from the budget in the budget
creation process. Such thing will reduce the motivation of employees because they feel less
irrelevant for the organization. The imposed budgetary approach is known as the top down
approach of budget creation. This approach makes budget creation process as economic and less
time taking process due to less requirement of the administration for top management. The
⊘ This is a preview!⊘
Do you want full access?
Subscribe today to unlock all pages.
Trusted by 1+ million students worldwide
imposed budgetary approach worked as the device of communication between the top
management and the other level of the management of the organization.
Moreover, if this budget will create by using imposed budgeting approach then production
manager of the organization should consider the fact that company’s budget was not achieved by
the organization in terms of budgeted sales volume. Hence top management of the organization
was expected higher sales volume with the lower resources.
Paraphrase This Document
Need a fresh take? Get an instant paraphrase of this document with our AI Paraphraser
Bibliography
Hansen, D, Mowen, M & Guan, L 2007, Cost Management: Accounting and Control, Cengage
Learning.
Horngren, CT 2009, Cost Accounting: A Managerial Emphasis, Pearson Education India.
Horngren, CT, Bhimani, A, Datar, SM & Foster, G 2002, Management and cost accounting,
Pearson Educati, New York.
Rumble, G 2012, The costs and economics of open and distance learning, Routledge.
Shah, A 2007, Participatory Budgeting, World Bank Publications.
1 out of 11
Related Documents


Your All-in-One AI-Powered Toolkit for Academic Success.
+13062052269
info@desklib.com
Available 24*7 on WhatsApp / Email
![[object Object]](/_next/static/media/star-bottom.7253800d.svg)
Unlock your academic potential
Copyright © 2020–2026 A2Z Services. All Rights Reserved. Developed and managed by ZUCOL.