ACCY801 - Cost-Volume-Profit Analysis & Capital Investment

Verified

Added on  2023/06/18

|9
|1423
|498
Report
AI Summary
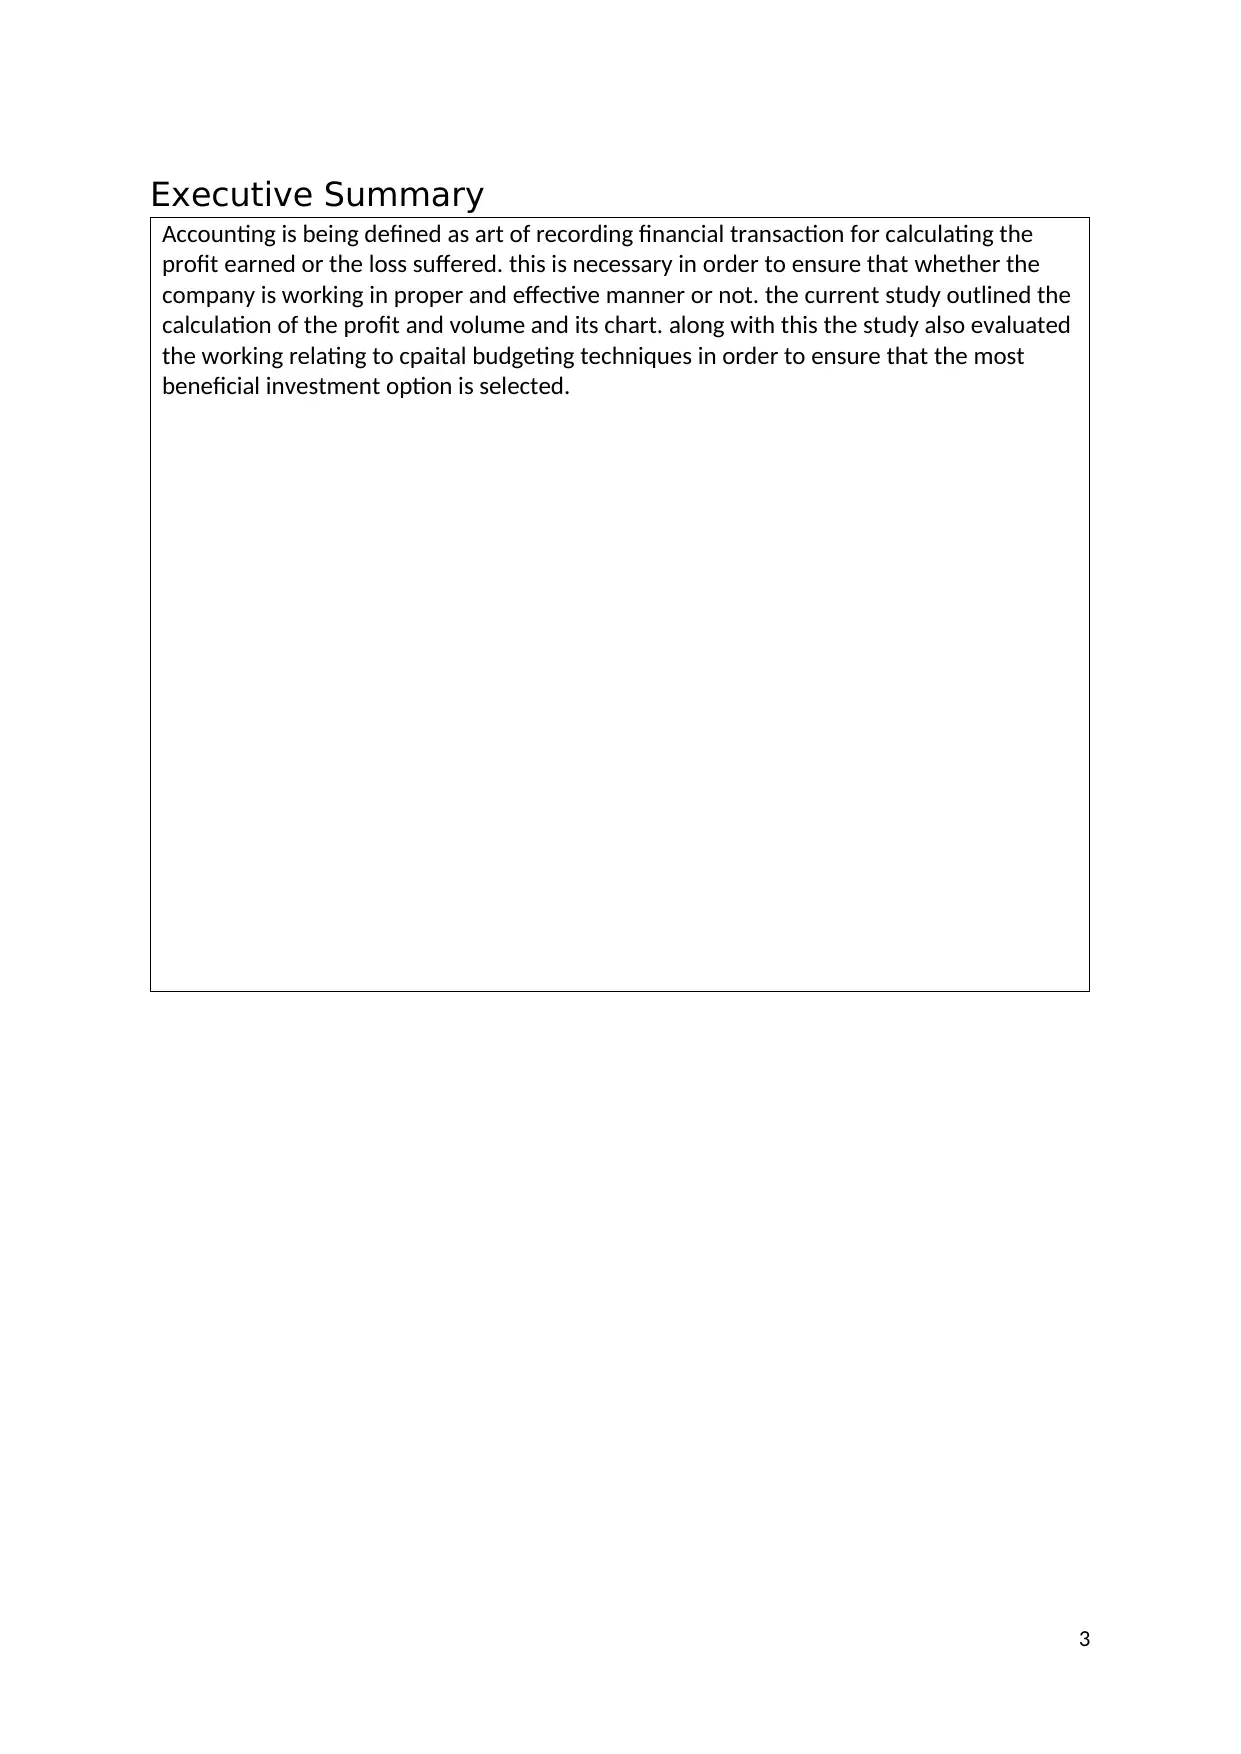
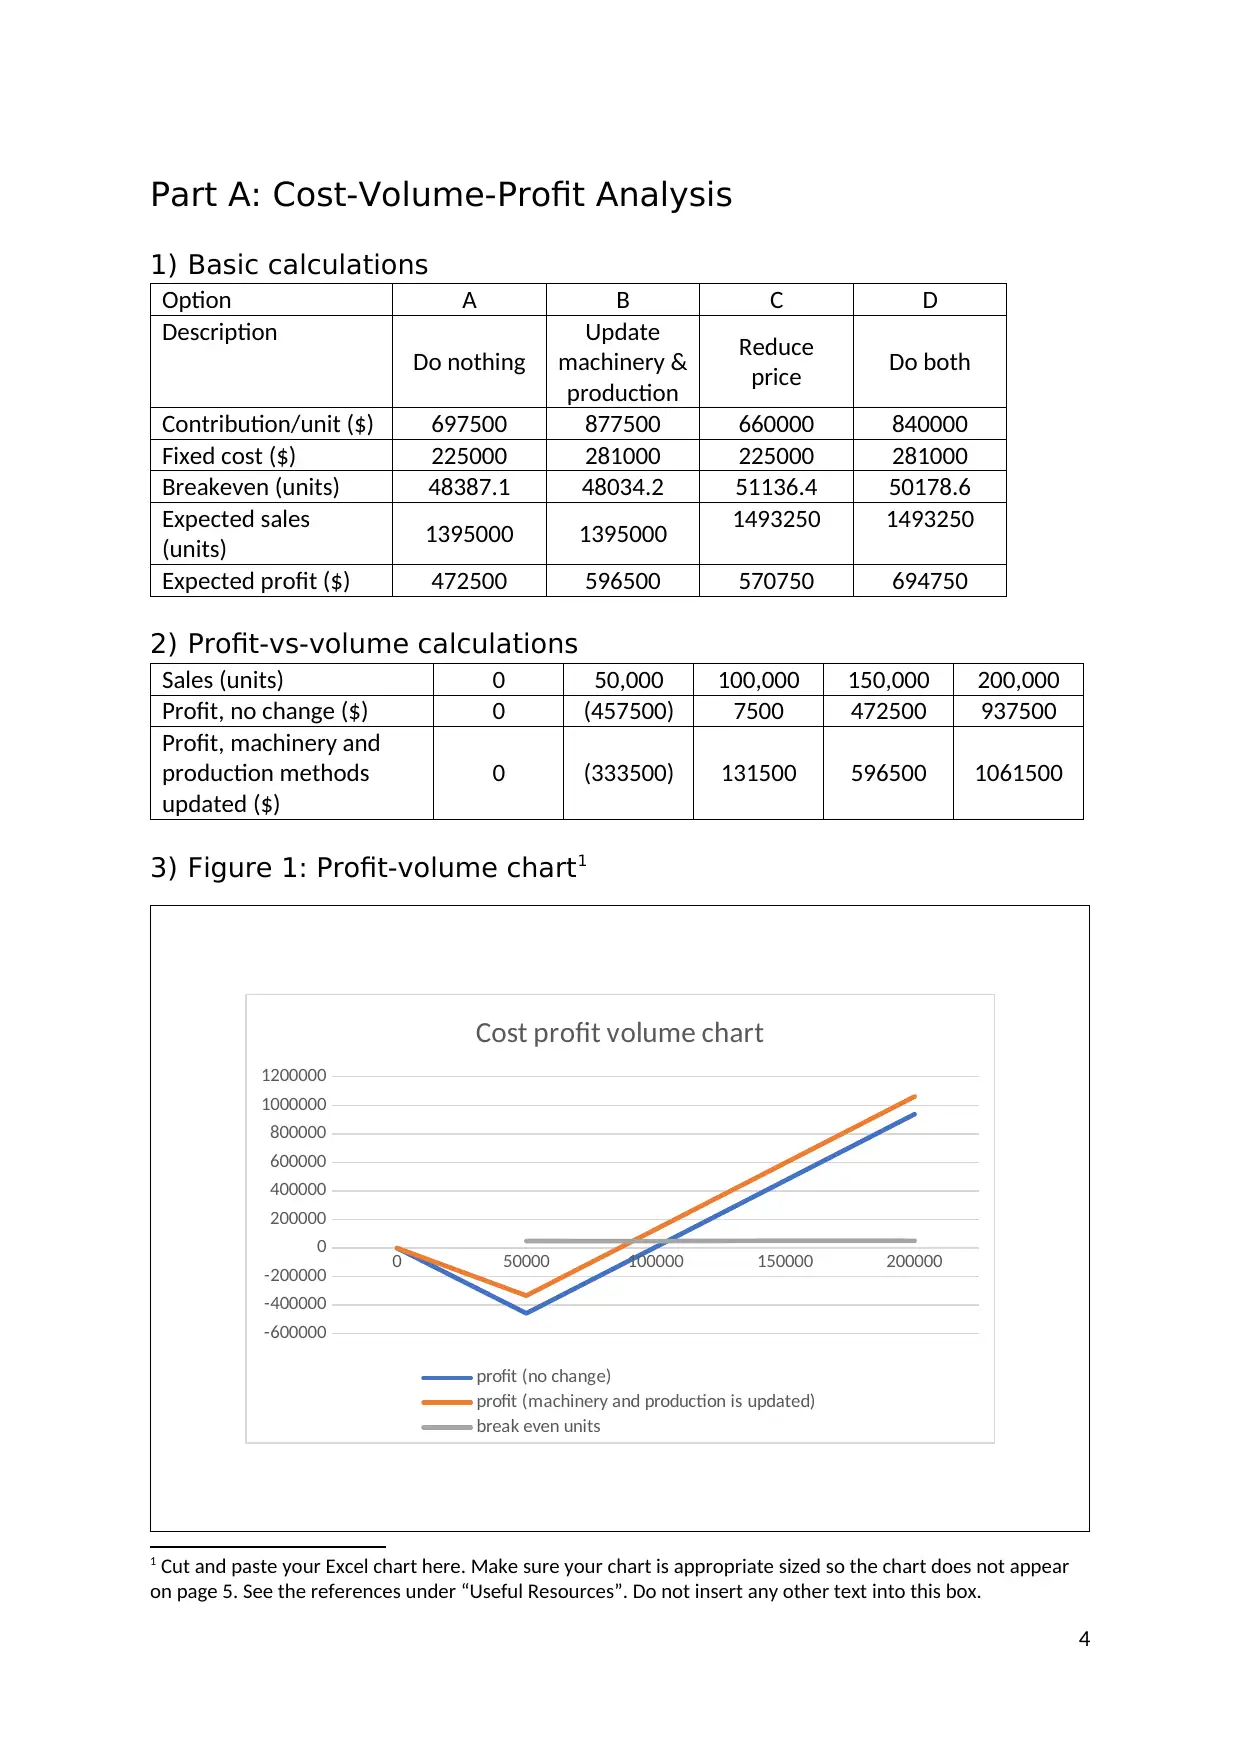
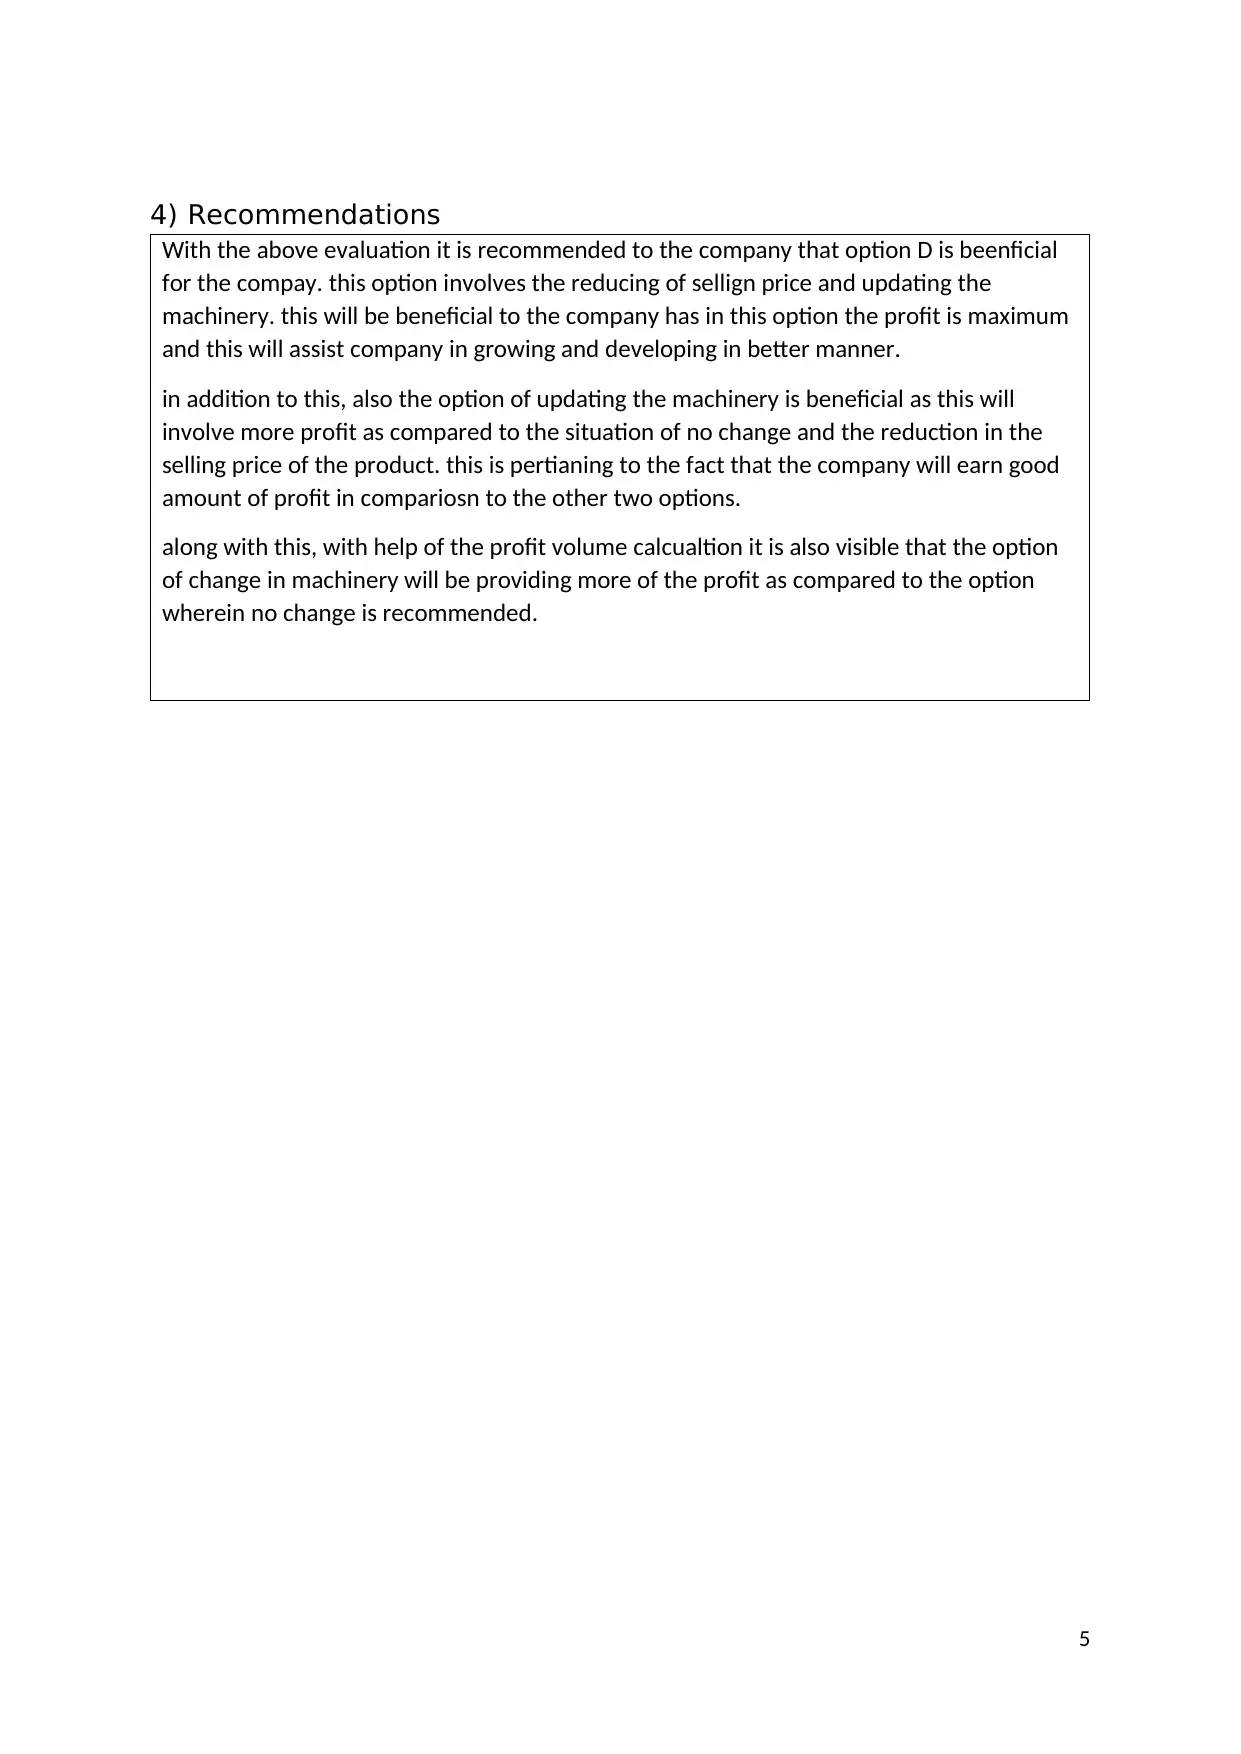
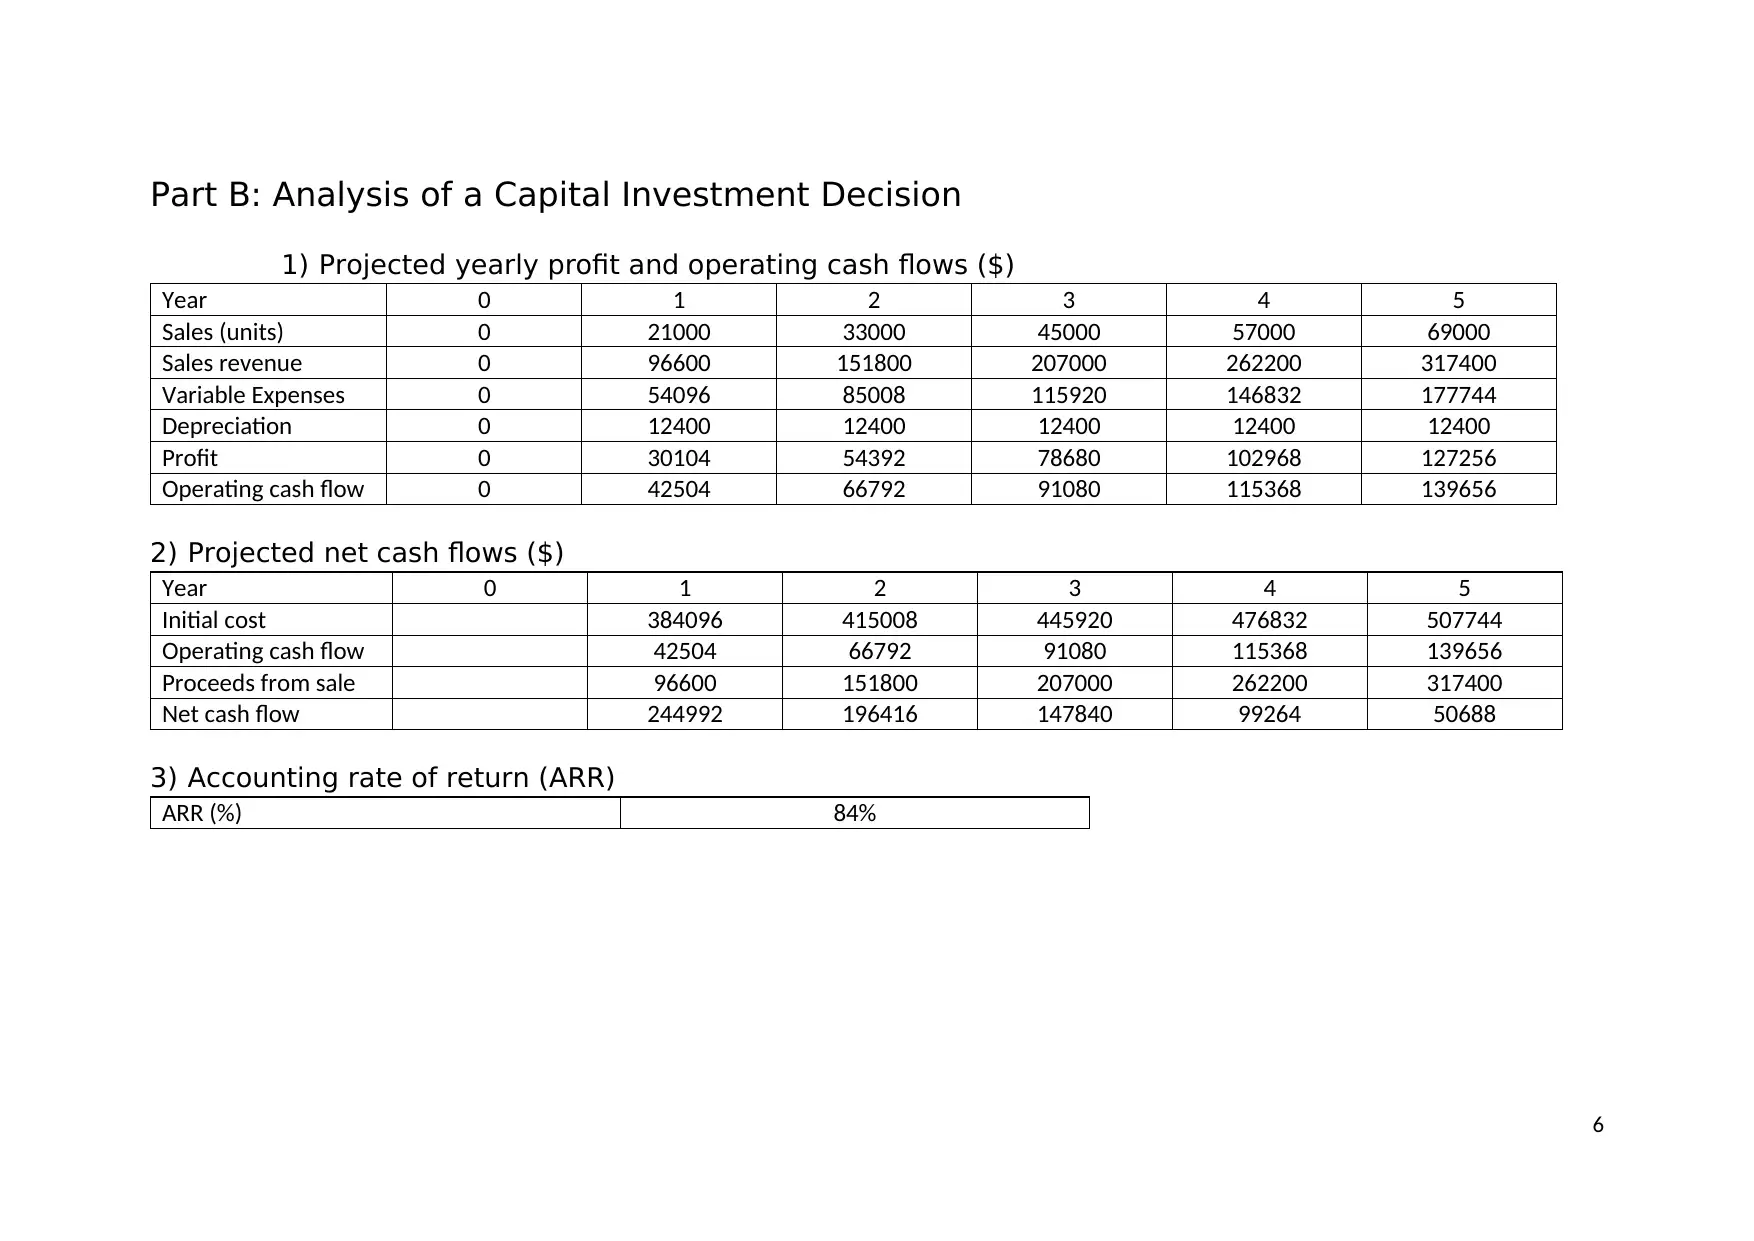
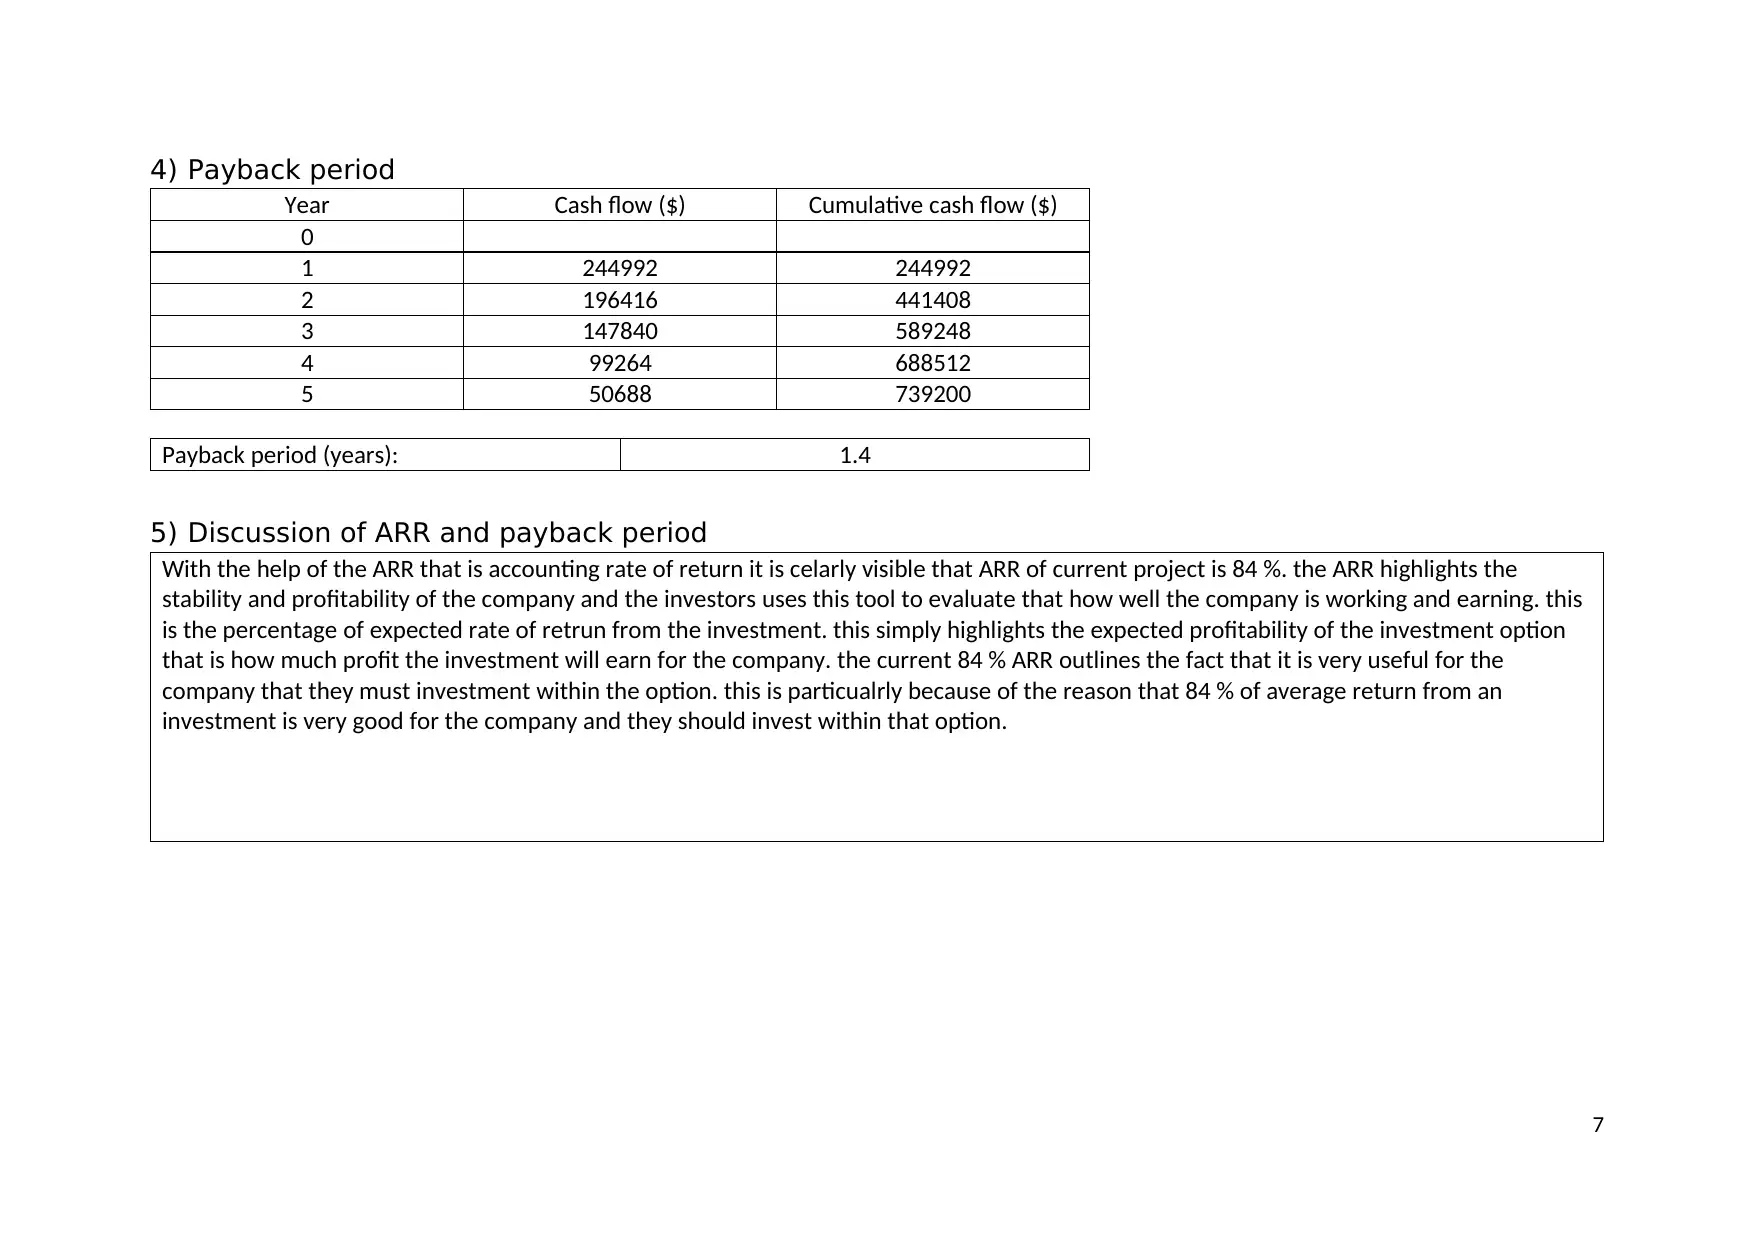
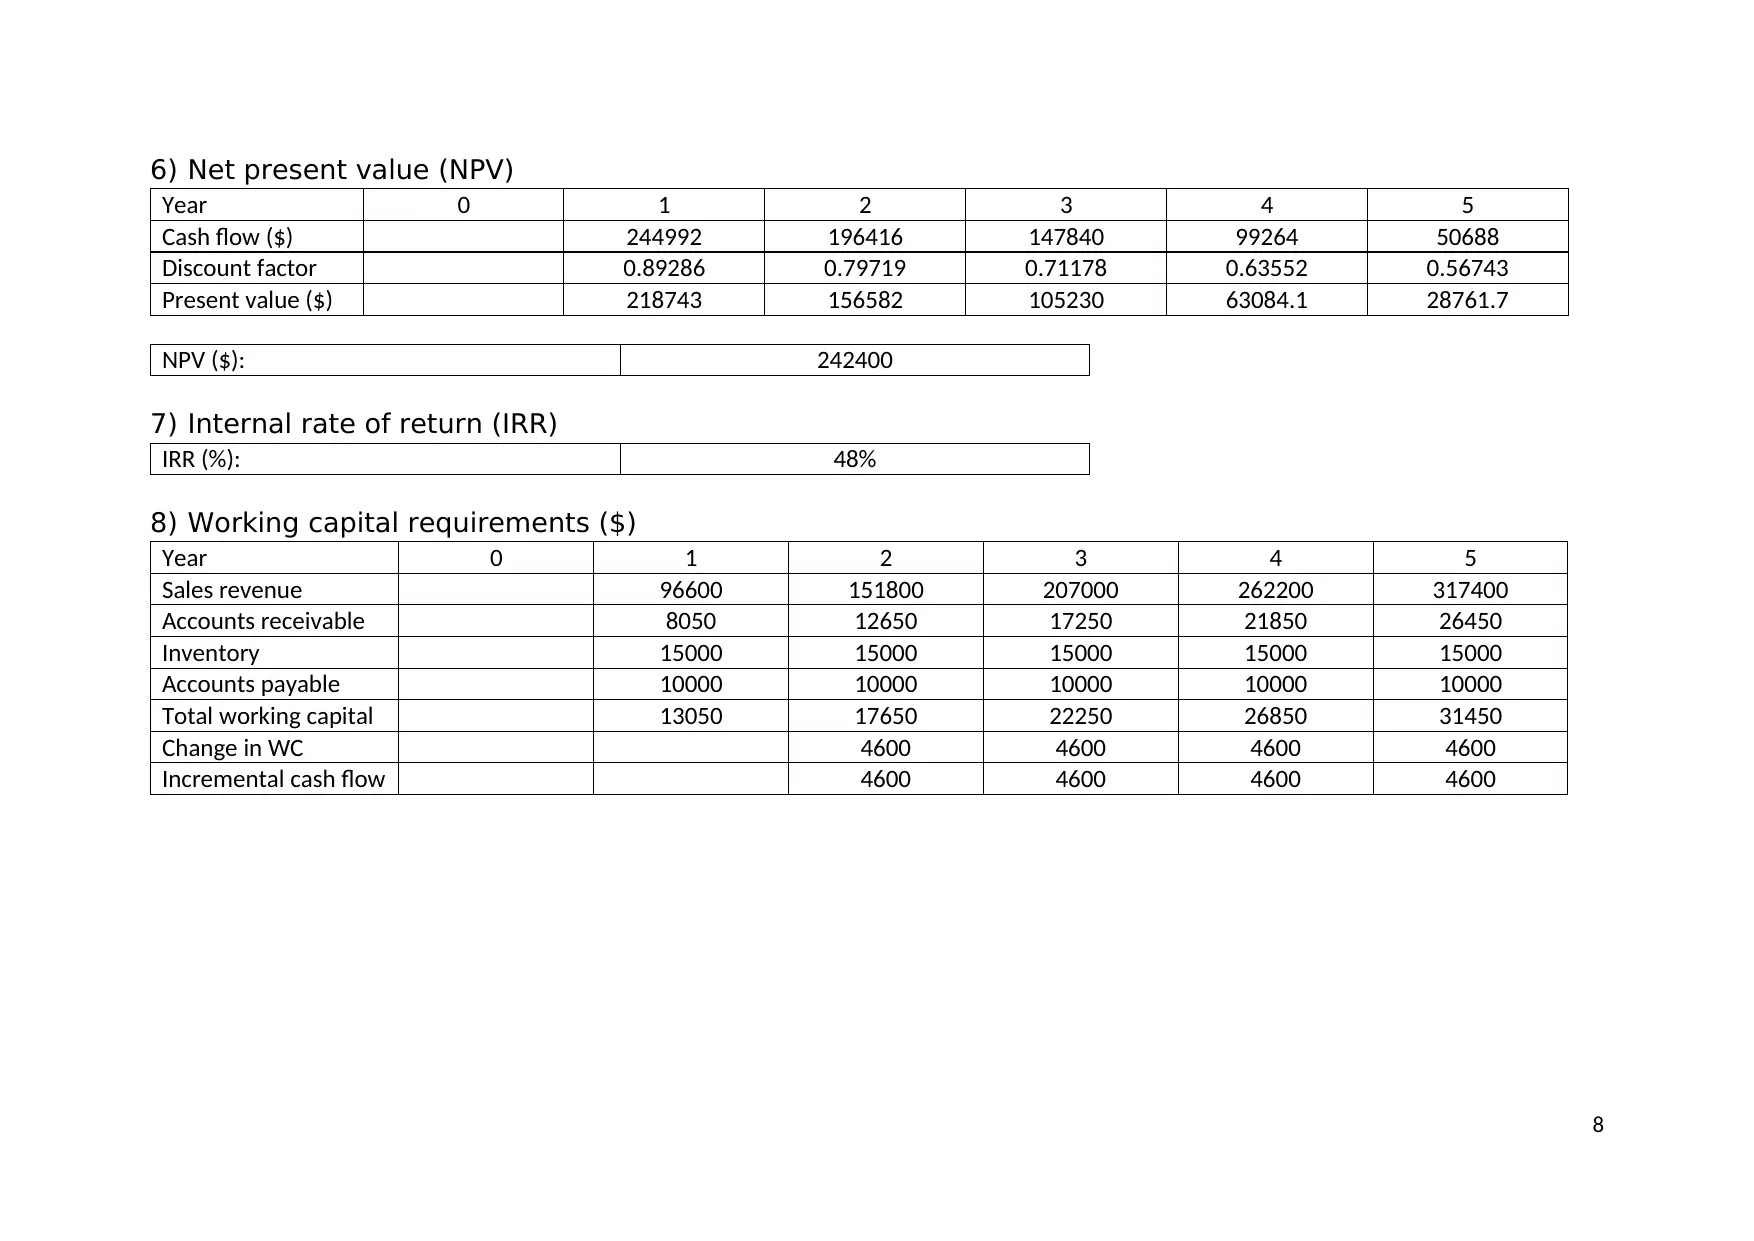
This report provides a comprehensive analysis of cost-volume-profit (CVP) scenarios and a capital investment decision. The CVP analysis explores different options, including updating machinery and reducing prices, to maximize profitability. The capital investment section evaluates projected profits, cash flows, accounting rate of return (ARR), payback period, net present value (NPV), internal rate of return (IRR), and working capital requirements to determine the viability of the investment. The report concludes with recommendations based on the financial analysis, suggesting investment in the project while closely monitoring working capital.
Document Page
ACCY801
Accounting and Financial Management
Trimester 2, 2021
Business Report
Student Name:
Student Number:
1
tabler-icon-diamond-filled.svg

Paraphrase This Document

Need a fresh take? Get an instant paraphrase of this document with our AI Paraphraser
Document Page
Contents
Executive Summary...............................................................................................................................3
Part A: Cost-Volume-Profit Analysis......................................................................................................4
1) Basic calculations.......................................................................................................................4
2) Profit-vs-volume calculations.....................................................................................................4
3) Figure 1: Profit-volume chart.....................................................................................................4
4) Recommendations.....................................................................................................................5
Part B: Analysis of a Capital Investment Decision..................................................................................6
1) Projected yearly profit and operating cash flows ($).................................................................6
2) Projected net cash flows ($)......................................................................................................6
3) Accounting rate of return (ARR)................................................................................................6
4) Payback period..........................................................................................................................7
5) Discussion of ARR and payback period......................................................................................7
6) Net present value (NPV)............................................................................................................8
7) Internal rate of return (IRR).......................................................................................................8
8) Working capital requirements ($)..............................................................................................8
9) Discussion of the effects of working capital...............................................................................9
10) Conclusion and recommendations........................................................................................9
2
Document Page
Executive Summary
Accounting is being defined as art of recording financial transaction for calculating the
profit earned or the loss suffered. this is necessary in order to ensure that whether the
company is working in proper and effective manner or not. the current study outlined the
calculation of the profit and volume and its chart. along with this the study also evaluated
the working relating to cpaital budgeting techniques in order to ensure that the most
beneficial investment option is selected.
3
Document Page
Part A: Cost-Volume-Profit Analysis
1) Basic calculations
Option A B C D
Description
Do nothing
Update
machinery &
production
Reduce
price Do both
Contribution/unit ($) 697500 877500 660000 840000
Fixed cost ($) 225000 281000 225000 281000
Breakeven (units) 48387.1 48034.2 51136.4 50178.6
Expected sales
(units) 1395000 1395000 1493250 1493250
Expected profit ($) 472500 596500 570750 694750
2) Profit-vs-volume calculations
Sales (units) 0 50,000 100,000 150,000 200,000
Profit, no change ($) 0 (457500) 7500 472500 937500
Profit, machinery and
production methods
updated ($)
0 (333500) 131500 596500 1061500
3) Figure 1: Profit-volume chart1
0 50000 100000 150000 200000
-600000
-400000
-200000
0
200000
400000
600000
800000
1000000
1200000
Cost profit volume chart
profit (no change)
profit (machinery and production is updated)
break even units
1 Cut and paste your Excel chart here. Make sure your chart is appropriate sized so the chart does not appear
on page 5. See the references under “Useful Resources”. Do not insert any other text into this box.
4
tabler-icon-diamond-filled.svg

Paraphrase This Document

Need a fresh take? Get an instant paraphrase of this document with our AI Paraphraser
Document Page
4) Recommendations
With the above evaluation it is recommended to the company that option D is beenficial
for the compay. this option involves the reducing of sellign price and updating the
machinery. this will be beneficial to the company has in this option the profit is maximum
and this will assist company in growing and developing in better manner.
in addition to this, also the option of updating the machinery is beneficial as this will
involve more profit as compared to the situation of no change and the reduction in the
selling price of the product. this is pertianing to the fact that the company will earn good
amount of profit in compariosn to the other two options.
along with this, with help of the profit volume calcualtion it is also visible that the option
of change in machinery will be providing more of the profit as compared to the option
wherein no change is recommended.
5
Document Page
Part B: Analysis of a Capital Investment Decision
1) Projected yearly profit and operating cash flows ($)
Year 0 1 2 3 4 5
Sales (units) 0 21000 33000 45000 57000 69000
Sales revenue 0 96600 151800 207000 262200 317400
Variable Expenses 0 54096 85008 115920 146832 177744
Depreciation 0 12400 12400 12400 12400 12400
Profit 0 30104 54392 78680 102968 127256
Operating cash flow 0 42504 66792 91080 115368 139656
2) Projected net cash flows ($)
Year 0 1 2 3 4 5
Initial cost 384096 415008 445920 476832 507744
Operating cash flow 42504 66792 91080 115368 139656
Proceeds from sale 96600 151800 207000 262200 317400
Net cash flow 244992 196416 147840 99264 50688
3) Accounting rate of return (ARR)
ARR (%) 84%
6
Document Page
4) Payback period
Year Cash flow ($) Cumulative cash flow ($)
0
1 244992 244992
2 196416 441408
3 147840 589248
4 99264 688512
5 50688 739200
Payback period (years): 1.4
5) Discussion of ARR and payback period
With the help of the ARR that is accounting rate of return it is celarly visible that ARR of current project is 84 %. the ARR highlights the
stability and profitability of the company and the investors uses this tool to evaluate that how well the company is working and earning. this
is the percentage of expected rate of retrun from the investment. this simply highlights the expected profitability of the investment option
that is how much profit the investment will earn for the company. the current 84 % ARR outlines the fact that it is very useful for the
company that they must investment within the option. this is particualrly because of the reason that 84 % of average return from an
investment is very good for the company and they should invest within that option.
7
tabler-icon-diamond-filled.svg

Paraphrase This Document

Need a fresh take? Get an instant paraphrase of this document with our AI Paraphraser
Document Page
6) Net present value (NPV)
Year 0 1 2 3 4 5
Cash flow ($) 244992 196416 147840 99264 50688
Discount factor 0.89286 0.79719 0.71178 0.63552 0.56743
Present value ($) 218743 156582 105230 63084.1 28761.7
NPV ($): 242400
7) Internal rate of return (IRR)
IRR (%): 48%
8) Working capital requirements ($)
Year 0 1 2 3 4 5
Sales revenue 96600 151800 207000 262200 317400
Accounts receivable 8050 12650 17250 21850 26450
Inventory 15000 15000 15000 15000 15000
Accounts payable 10000 10000 10000 10000 10000
Total working capital 13050 17650 22250 26850 31450
Change in WC 4600 4600 4600 4600
Incremental cash flow 4600 4600 4600 4600
8
Document Page
9) Discussion of the effects of working capital
With the above calcualtion, it is clear that the total working capital of the company is increasing year after year. this is particularly because
of the reason that with increase in operations of company the need of working capital also increases. hence the above working capital
highlights the fact that the changes witihn the working capital is contant that is 4600 for every year. hence, this simply implies that every
year the working capital requirement of company increases by 4600. this is pertianing to the reason that the payables and inventory are
constant for the company and because of this there is constant rise in working capital.
Assumption- since monthly sales are not provided, so it is assumed that in every month sales will be constant that is yearly sales divided by
12.
10) Conclusion and recommendations
In the end it is conlcuded that the company must invest within the project. this is pertaining to the fact that the amount of investment will
be recovered witihn the time frame of 1.4 years. hence it can be stated that the money will recovered in very less time and after that
company will start earning profit. in addition to this also the ARR of company is 84 % which is good for the company. along with this the NPV
of the project was 242400 which is good. this implies that the present value of the future cash flow is 242400 which is good. hence, company
must invest in the project.
furthermore, it is recommended to the company that they must invest within the project but they must try to improve the working capital
situation. this is pertianing to the fact that a onstant change in working capital is not possible practically. hence, at time of investment it is
necessary for the company that they must evaluate the working capital of the company.
9
chevron_up_icon
1 out of 9
circle_padding
hide_on_mobile
zoom_out_icon
[object Object]