PO313 Statistical Portfolio: Inequality, Ideology, Economy, Politics
VerifiedAdded on 2023/06/15
|10
|834
|214
Portfolio
AI Summary
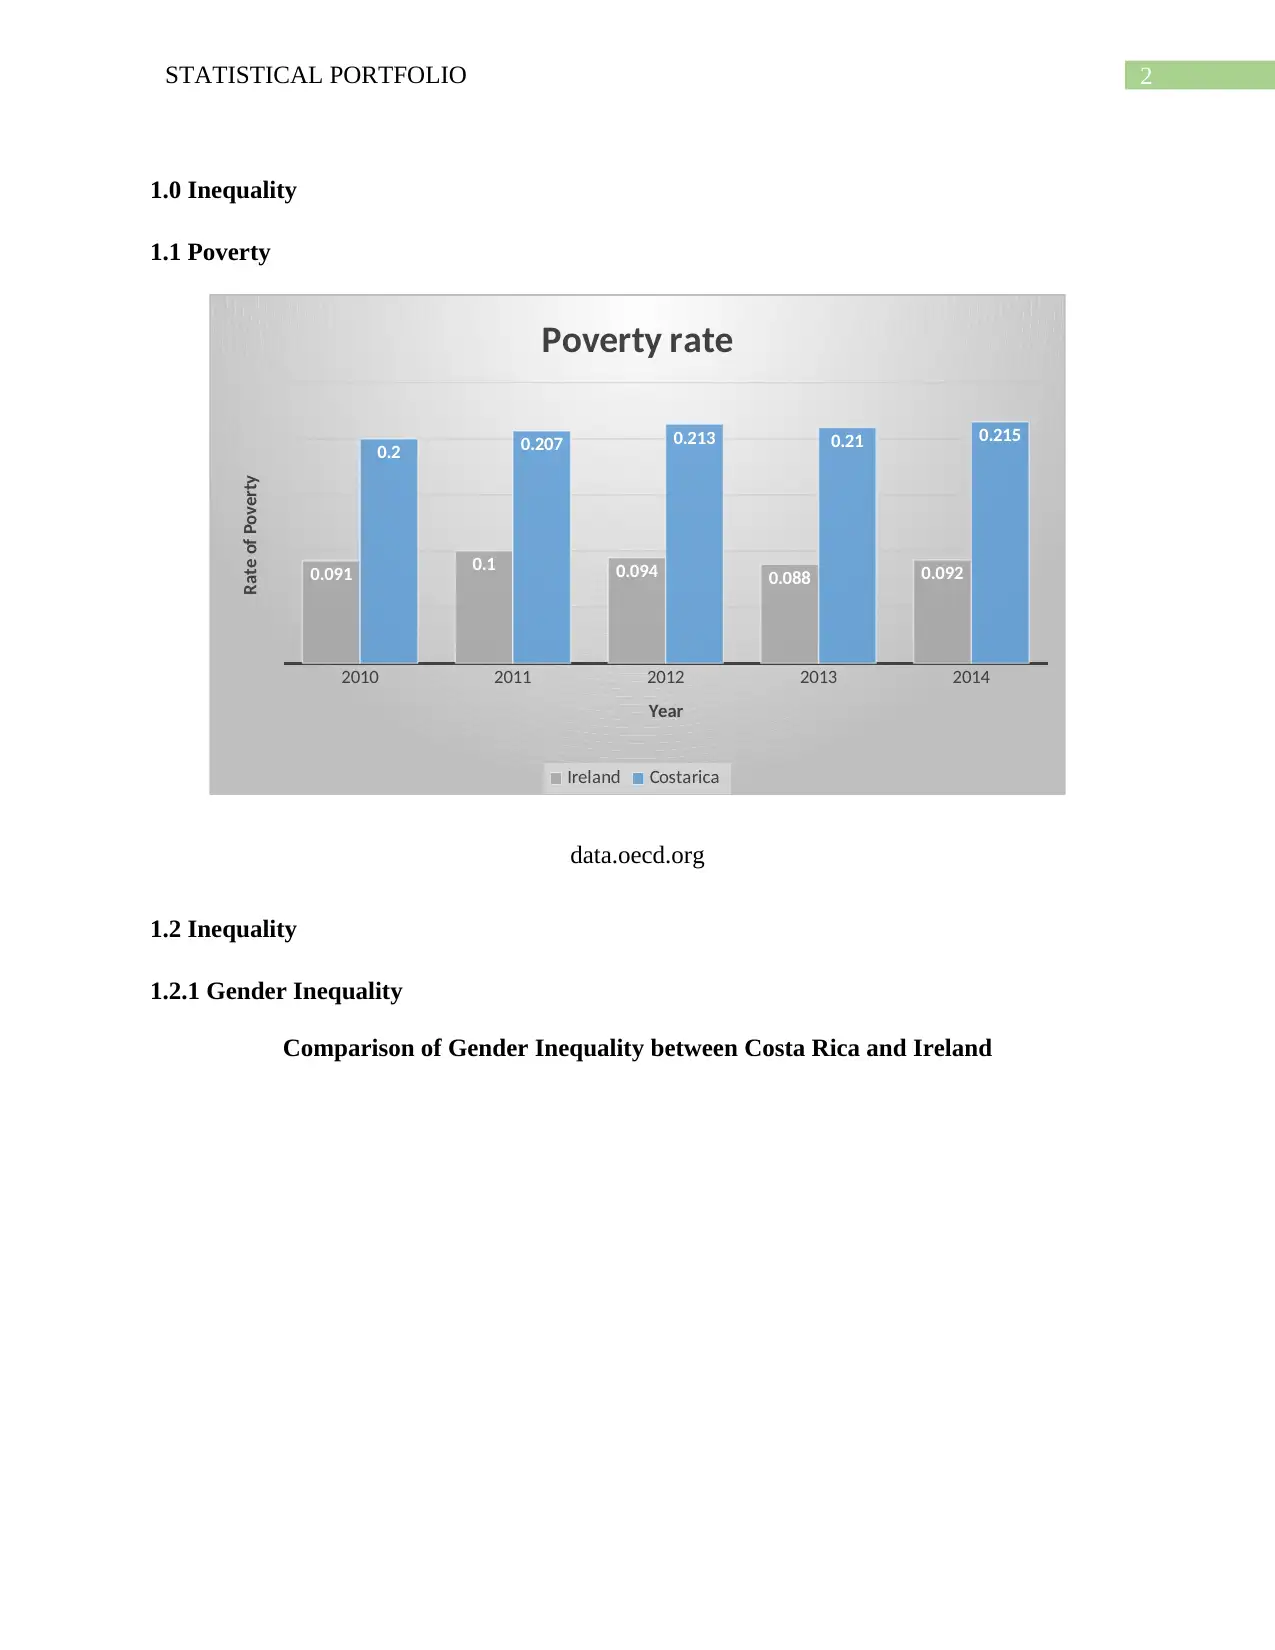
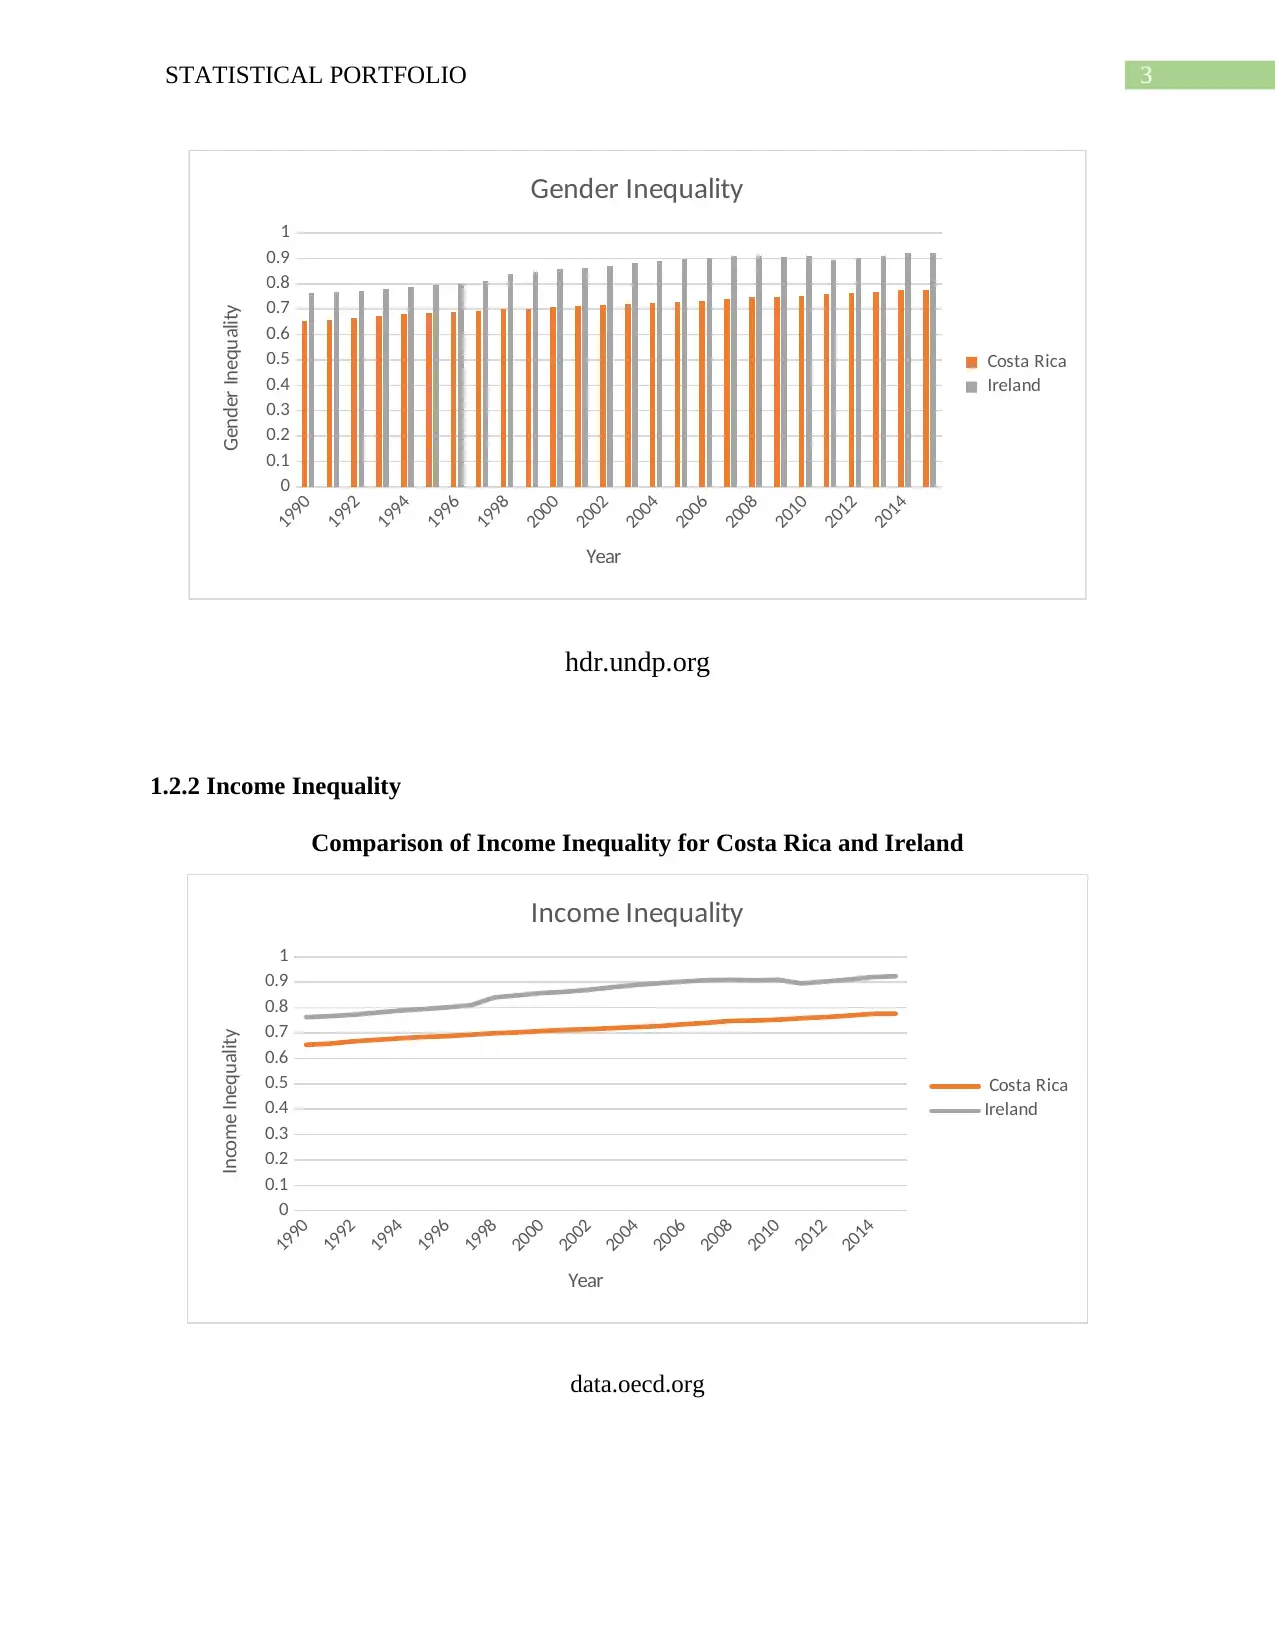
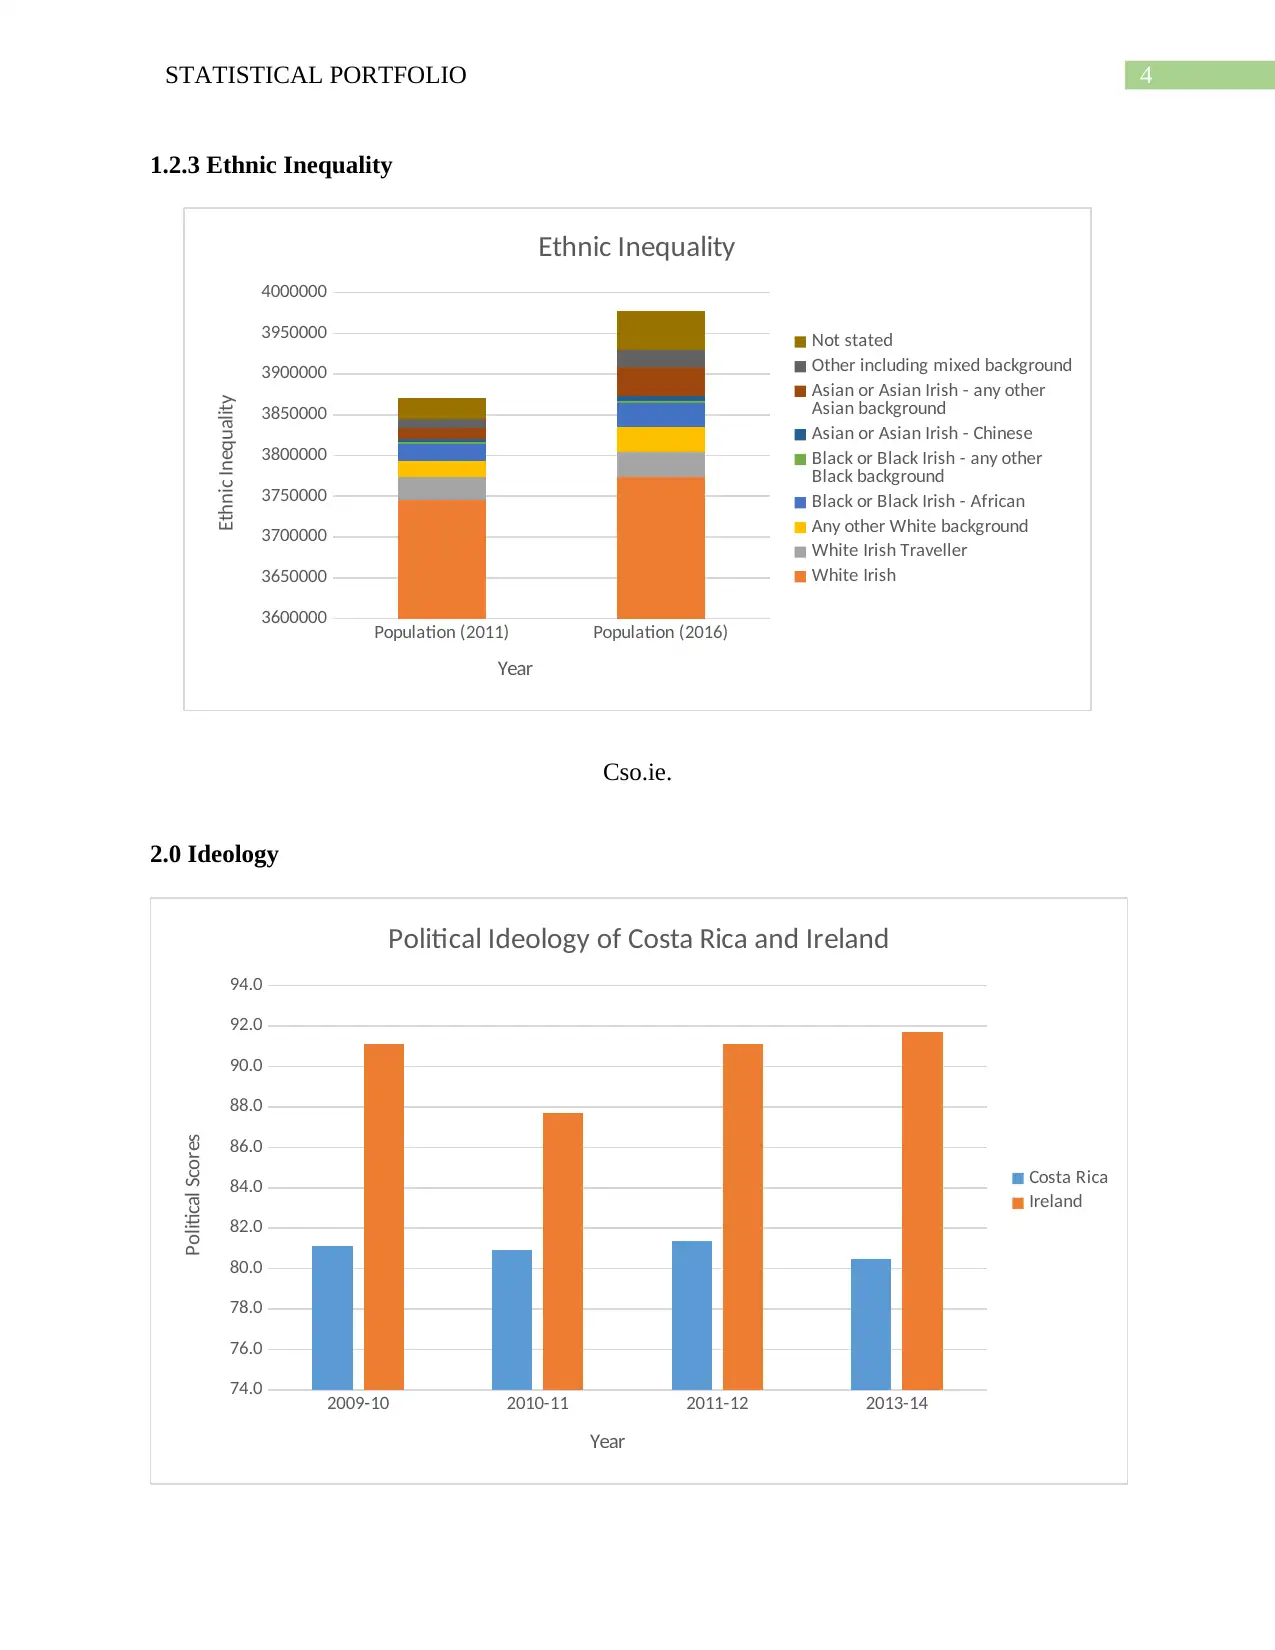
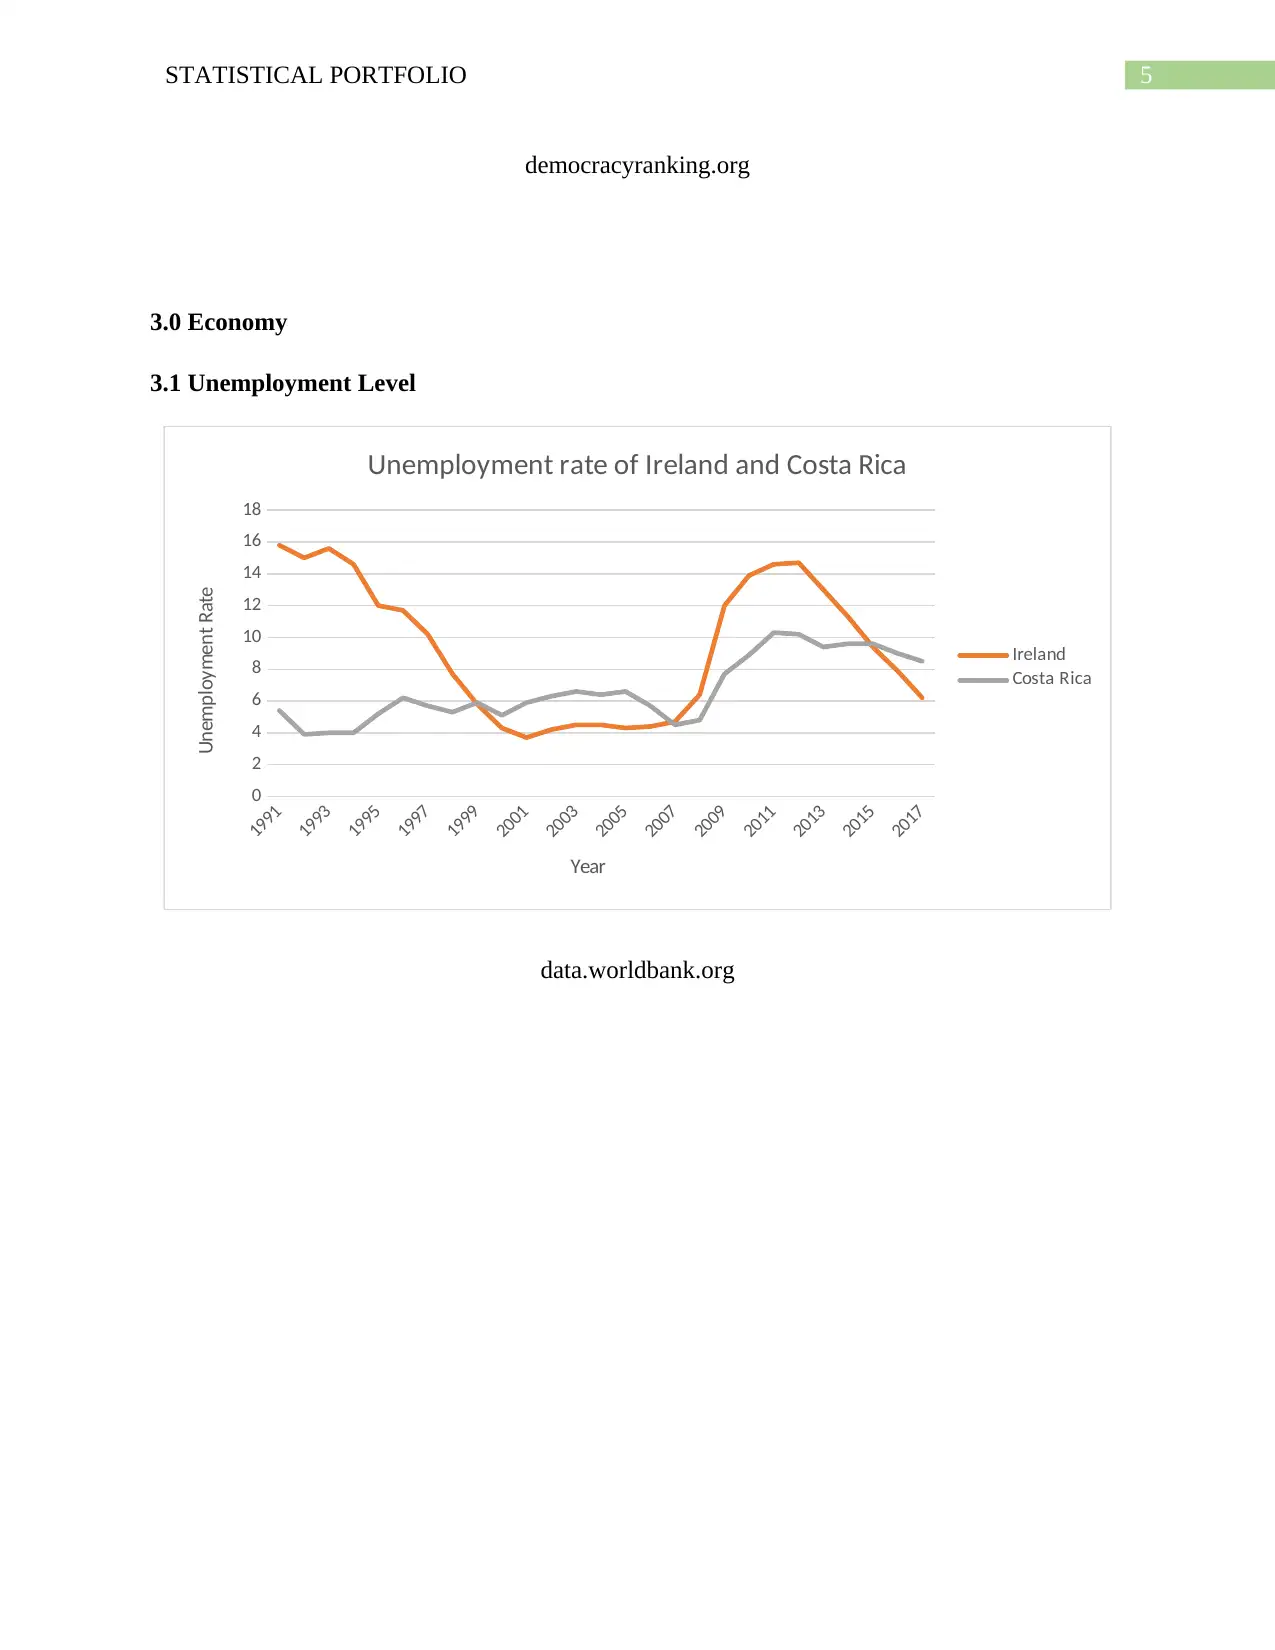
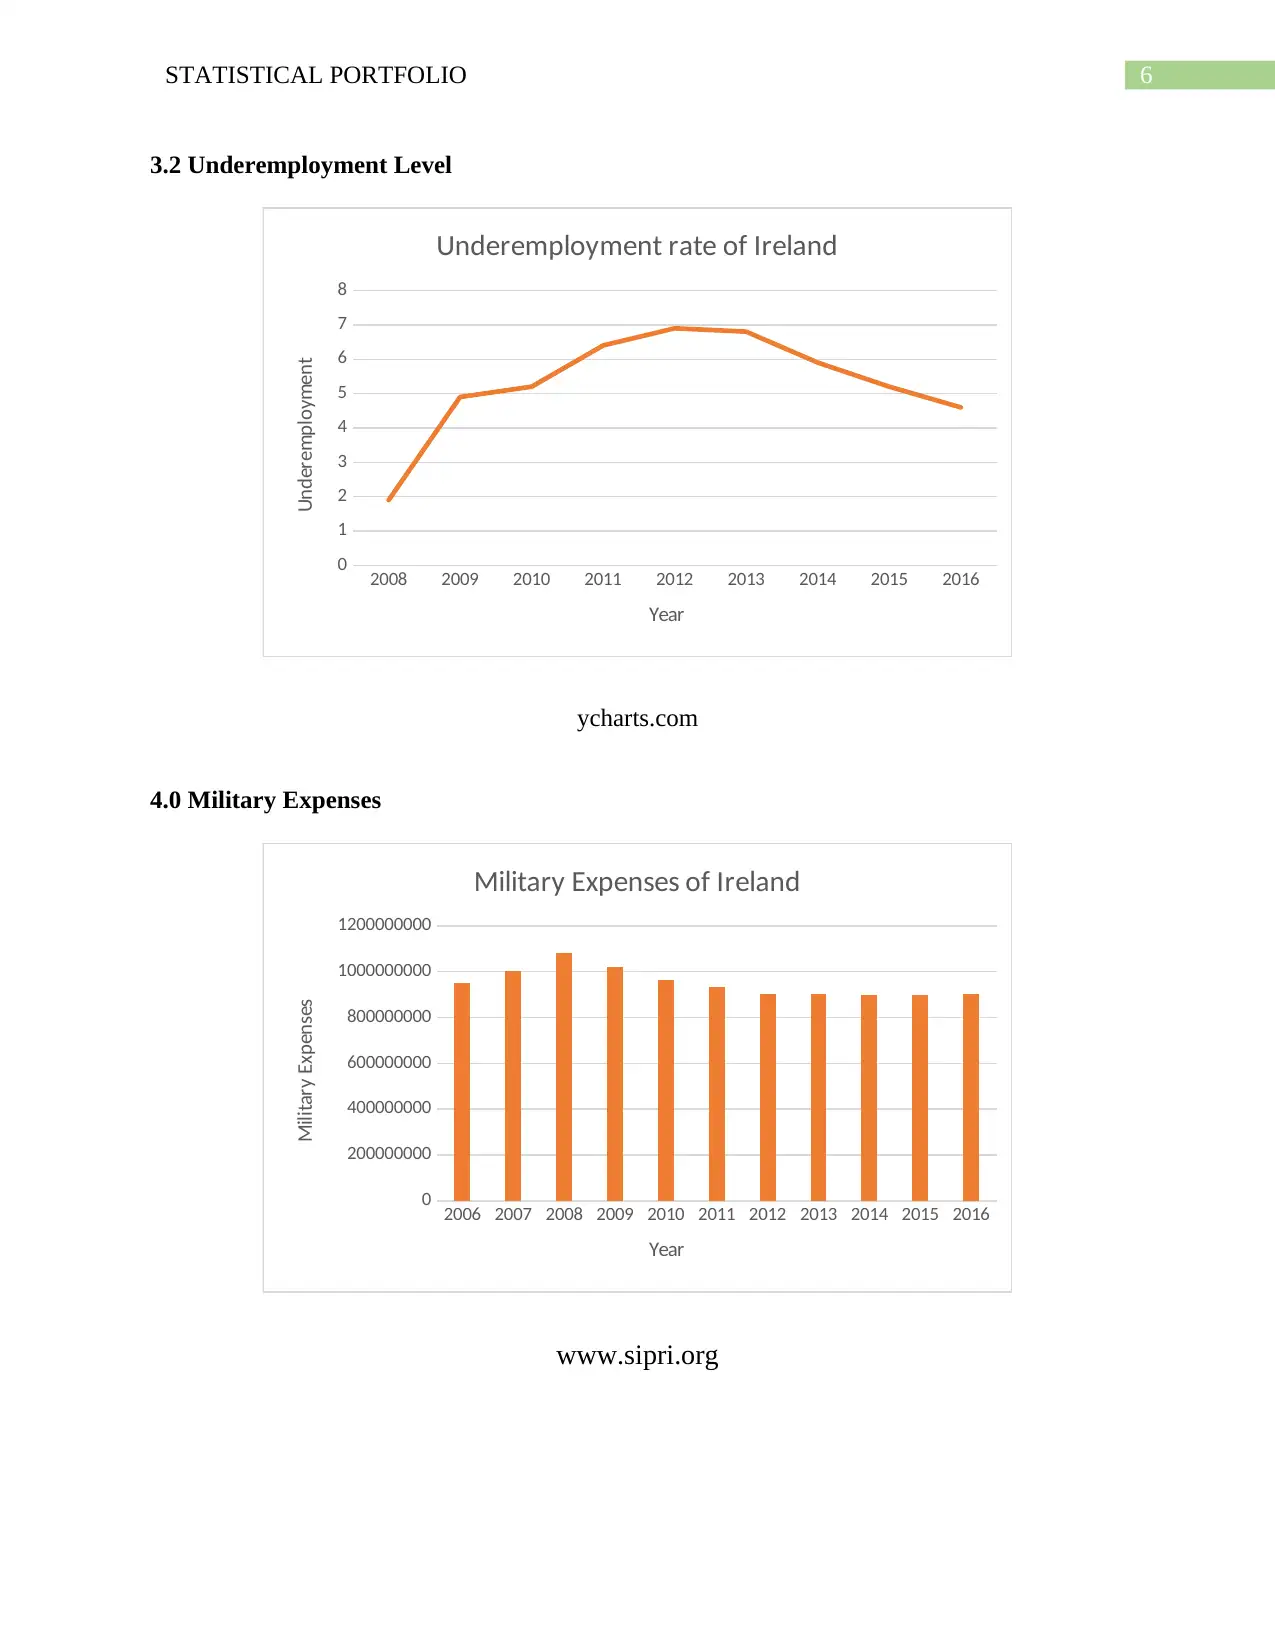
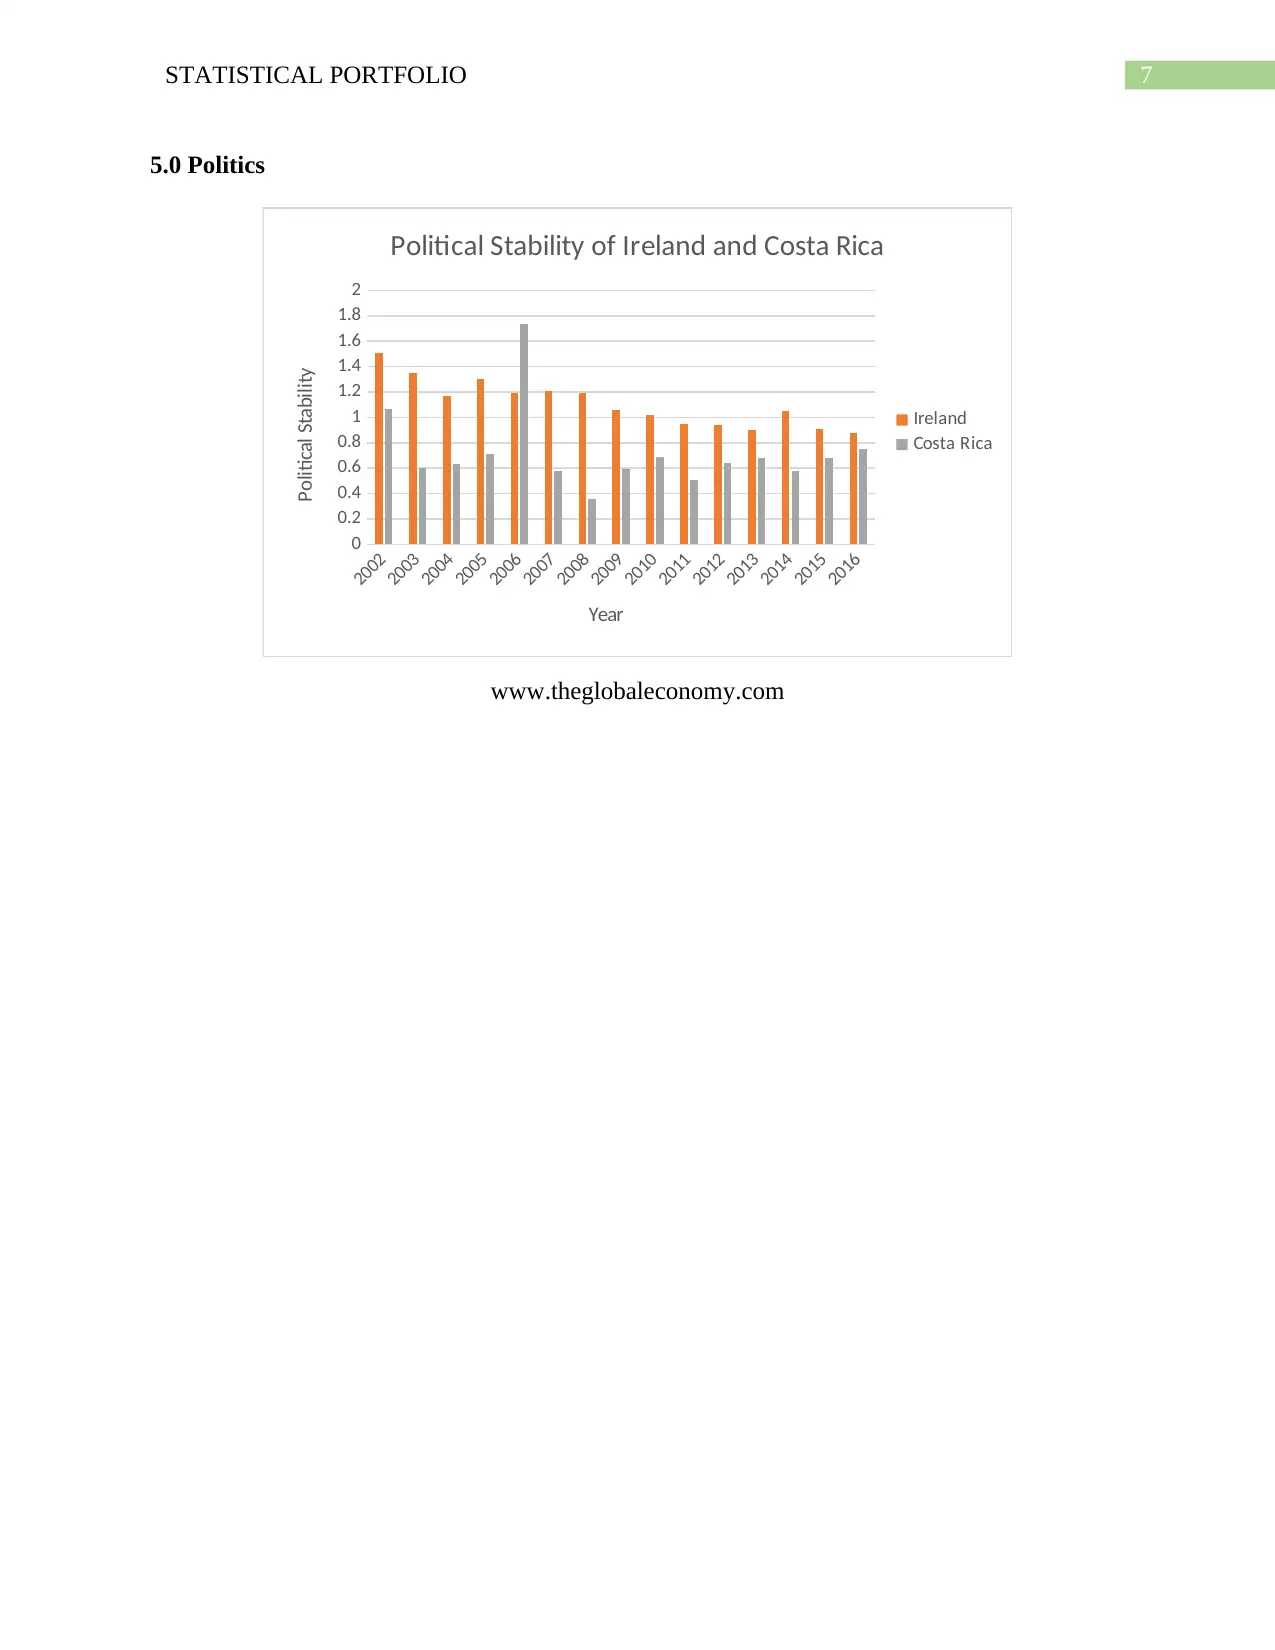
This statistical portfolio provides a comparative analysis of Costa Rica and Ireland, focusing on key areas such as inequality (poverty, gender, income, and ethnic disparities), ideology, economics (unemployment and underemployment levels), military expenses, and politics (political stability). The an...

Running Head: STATISTICAL PORTFOLIO
Statistical Portfolio
Name of the Student
Name of the University
Author Note
Statistical Portfolio
Name of the Student
Name of the University
Author Note
Secure Best Marks with AI Grader
Need help grading? Try our AI Grader for instant feedback on your assignments.

1STATISTICAL PORTFOLIO
Table of Contents
1.0 Inequality...................................................................................................................................2
1.1 Poverty...................................................................................................................................2
1.2 Inequality...............................................................................................................................2
1.2.1 Gender Inequality...........................................................................................................2
1.2.2 Income Inequality...........................................................................................................3
1.2.3 Ethnic Inequality.............................................................................................................4
2.0 Ideology.....................................................................................................................................4
3.0 Economy....................................................................................................................................5
3.1 Unemployment Level............................................................................................................5
3.2 Underemployment Level.......................................................................................................6
4.0 Military Expenses......................................................................................................................6
5.0 Politics.......................................................................................................................................7
References........................................................................................................................................8

2STATISTICAL PORTFOLIO
1.0 Inequality
1.1 Poverty
2010 2011 2012 2013 2014
0.091 0.1 0.094 0.088 0.092
0.2 0.207 0.213 0.21 0.215
Poverty rate
Ireland Costarica
Year
Rate of Poverty
data.oecd.org
1.2 Inequality
1.2.1 Gender Inequality
Comparison of Gender Inequality between Costa Rica and Ireland
1.0 Inequality
1.1 Poverty
2010 2011 2012 2013 2014
0.091 0.1 0.094 0.088 0.092
0.2 0.207 0.213 0.21 0.215
Poverty rate
Ireland Costarica
Year
Rate of Poverty
data.oecd.org
1.2 Inequality
1.2.1 Gender Inequality
Comparison of Gender Inequality between Costa Rica and Ireland

3STATISTICAL PORTFOLIO
1990
1992
1994
1996
1998
2000
2002
2004
2006
2008
2010
2012
2014
0
0.1
0.2
0.3
0.4
0.5
0.6
0.7
0.8
0.9
1
Gender Inequality
Costa Rica
Ireland
Year
Gender Inequality
hdr.undp.org
1.2.2 Income Inequality
Comparison of Income Inequality for Costa Rica and Ireland
1990
1992
1994
1996
1998
2000
2002
2004
2006
2008
2010
2012
2014
0
0.1
0.2
0.3
0.4
0.5
0.6
0.7
0.8
0.9
1
Income Inequality
Costa Rica
Ireland
Year
Income Inequality
data.oecd.org
1990
1992
1994
1996
1998
2000
2002
2004
2006
2008
2010
2012
2014
0
0.1
0.2
0.3
0.4
0.5
0.6
0.7
0.8
0.9
1
Gender Inequality
Costa Rica
Ireland
Year
Gender Inequality
hdr.undp.org
1.2.2 Income Inequality
Comparison of Income Inequality for Costa Rica and Ireland
1990
1992
1994
1996
1998
2000
2002
2004
2006
2008
2010
2012
2014
0
0.1
0.2
0.3
0.4
0.5
0.6
0.7
0.8
0.9
1
Income Inequality
Costa Rica
Ireland
Year
Income Inequality
data.oecd.org
Secure Best Marks with AI Grader
Need help grading? Try our AI Grader for instant feedback on your assignments.

4STATISTICAL PORTFOLIO
1.2.3 Ethnic Inequality
Population (2011) Population (2016)
3600000
3650000
3700000
3750000
3800000
3850000
3900000
3950000
4000000
Ethnic Inequality
Not stated
Other including mixed background
Asian or Asian Irish - any other
Asian background
Asian or Asian Irish - Chinese
Black or Black Irish - any other
Black background
Black or Black Irish - African
Any other White background
White Irish Traveller
White Irish
Year
Ethnic Inequality
Cso.ie.
2.0 Ideology
2009-10 2010-11 2011-12 2013-14
74.0
76.0
78.0
80.0
82.0
84.0
86.0
88.0
90.0
92.0
94.0
Political Ideology of Costa Rica and Ireland
Costa Rica
Ireland
Year
Political Scores

5STATISTICAL PORTFOLIO
democracyranking.org
3.0 Economy
3.1 Unemployment Level
1991
1993
1995
1997
1999
2001
2003
2005
2007
2009
2011
2013
2015
2017
0
2
4
6
8
10
12
14
16
18
Unemployment rate of Ireland and Costa Rica
Ireland
Costa Rica
Year
Unemployment Rate
data.worldbank.org
democracyranking.org
3.0 Economy
3.1 Unemployment Level
1991
1993
1995
1997
1999
2001
2003
2005
2007
2009
2011
2013
2015
2017
0
2
4
6
8
10
12
14
16
18
Unemployment rate of Ireland and Costa Rica
Ireland
Costa Rica
Year
Unemployment Rate
data.worldbank.org

6STATISTICAL PORTFOLIO
3.2 Underemployment Level
2008 2009 2010 2011 2012 2013 2014 2015 2016
0
1
2
3
4
5
6
7
8
Underemployment rate of Ireland
Year
Underemployment
ycharts.com
4.0 Military Expenses
2006 2007 2008 2009 2010 2011 2012 2013 2014 2015 2016
0
200000000
400000000
600000000
800000000
1000000000
1200000000
Military Expenses of Ireland
Year
Military Expenses
www.sipri.org
Paraphrase This Document
Need a fresh take? Get an instant paraphrase of this document with our AI Paraphraser

7STATISTICAL PORTFOLIO
5.0 Politics
2002
2003
2004
2005
2006
2007
2008
2009
2010
2011
2012
2013
2014
2015
2016
0
0.2
0.4
0.6
0.8
1
1.2
1.4
1.6
1.8
2
Political Stability of Ireland and Costa Rica
Ireland
Costa Rica
Year
Political Stability
www.theglobaleconomy.com
5.0 Politics
2002
2003
2004
2005
2006
2007
2008
2009
2010
2011
2012
2013
2014
2015
2016
0
0.2
0.4
0.6
0.8
1
1.2
1.4
1.6
1.8
2
Political Stability of Ireland and Costa Rica
Ireland
Costa Rica
Year
Political Stability
www.theglobaleconomy.com

8STATISTICAL PORTFOLIO
References
Cso.ie. (2018). Population Usually Resident and Present in the State 2011 to 2016 by Ethnic or
Cultural Background, Nationality and CensusYear - StatBank - data and statistics. [online]
Available at: http://www.cso.ie/px/pxeirestat/Statire/SelectVarVal/Define.asp?
maintable=E8004&PLanguage=0 [Accessed 23 Feb. 2018].
Data.worldbank.org. (2018). Unemployment, total (% of total labor force) (modeled ILO
estimate) | Data. [online] Available at: https://data.worldbank.org/indicator/SL.UEM.TOTL.ZS?
locations=CR [Accessed 23 Feb. 2018].
Democracy Ranking. (2018). Democracy Ranking. [online] Available at:
http://democracyranking.org/wordpress/ [Accessed 23 Feb. 2018].
Hdr.undp.org. (2018). Human Development Data (1990-2015) | Human Development Reports.
[online] Available at: http://hdr.undp.org/en/data# [Accessed 23 Feb. 2018].
Sipri.org. (2018). SIPRI Military Expenditure Database | SIPRI. [online] Available at:
https://www.sipri.org/databases/milex [Accessed 23 Feb. 2018].
TheGlobalEconomy.com. (2018). Ireland Political stability - data, chart |
TheGlobalEconomy.com. [online] Available at:
https://www.theglobaleconomy.com/Ireland/wb_political_stability/ [Accessed 23 Feb. 2018].
theOECD. (2018). Inequality - Income inequality - OECD Data. [online] Available at:
https://data.oecd.org/inequality/income-inequality.htm#indicator-chart [Accessed 23 Feb. 2018].
theOECD. (2018). Inequality - Poverty rate - OECD Data. [online] Available at:
https://data.oecd.org/inequality/poverty-rate.htm [Accessed 23 Feb. 2018].

9STATISTICAL PORTFOLIO
Ycharts.com. (2018). Ireland Underemployment Rate (Yearly, SA). [online] Available at:
https://ycharts.com/indicators/ireland_underemployment_rate [Accessed 23 Feb. 2018].
Ycharts.com. (2018). Ireland Underemployment Rate (Yearly, SA). [online] Available at:
https://ycharts.com/indicators/ireland_underemployment_rate [Accessed 23 Feb. 2018].
1 out of 10

Your All-in-One AI-Powered Toolkit for Academic Success.
+13062052269
info@desklib.com
Available 24*7 on WhatsApp / Email
Unlock your academic potential
© 2024 | Zucol Services PVT LTD | All rights reserved.