Comparative Financial Analysis Report: Costco and Walmart Companies
VerifiedAdded on  2022/08/26
|9
|996
|16
Report
AI Summary
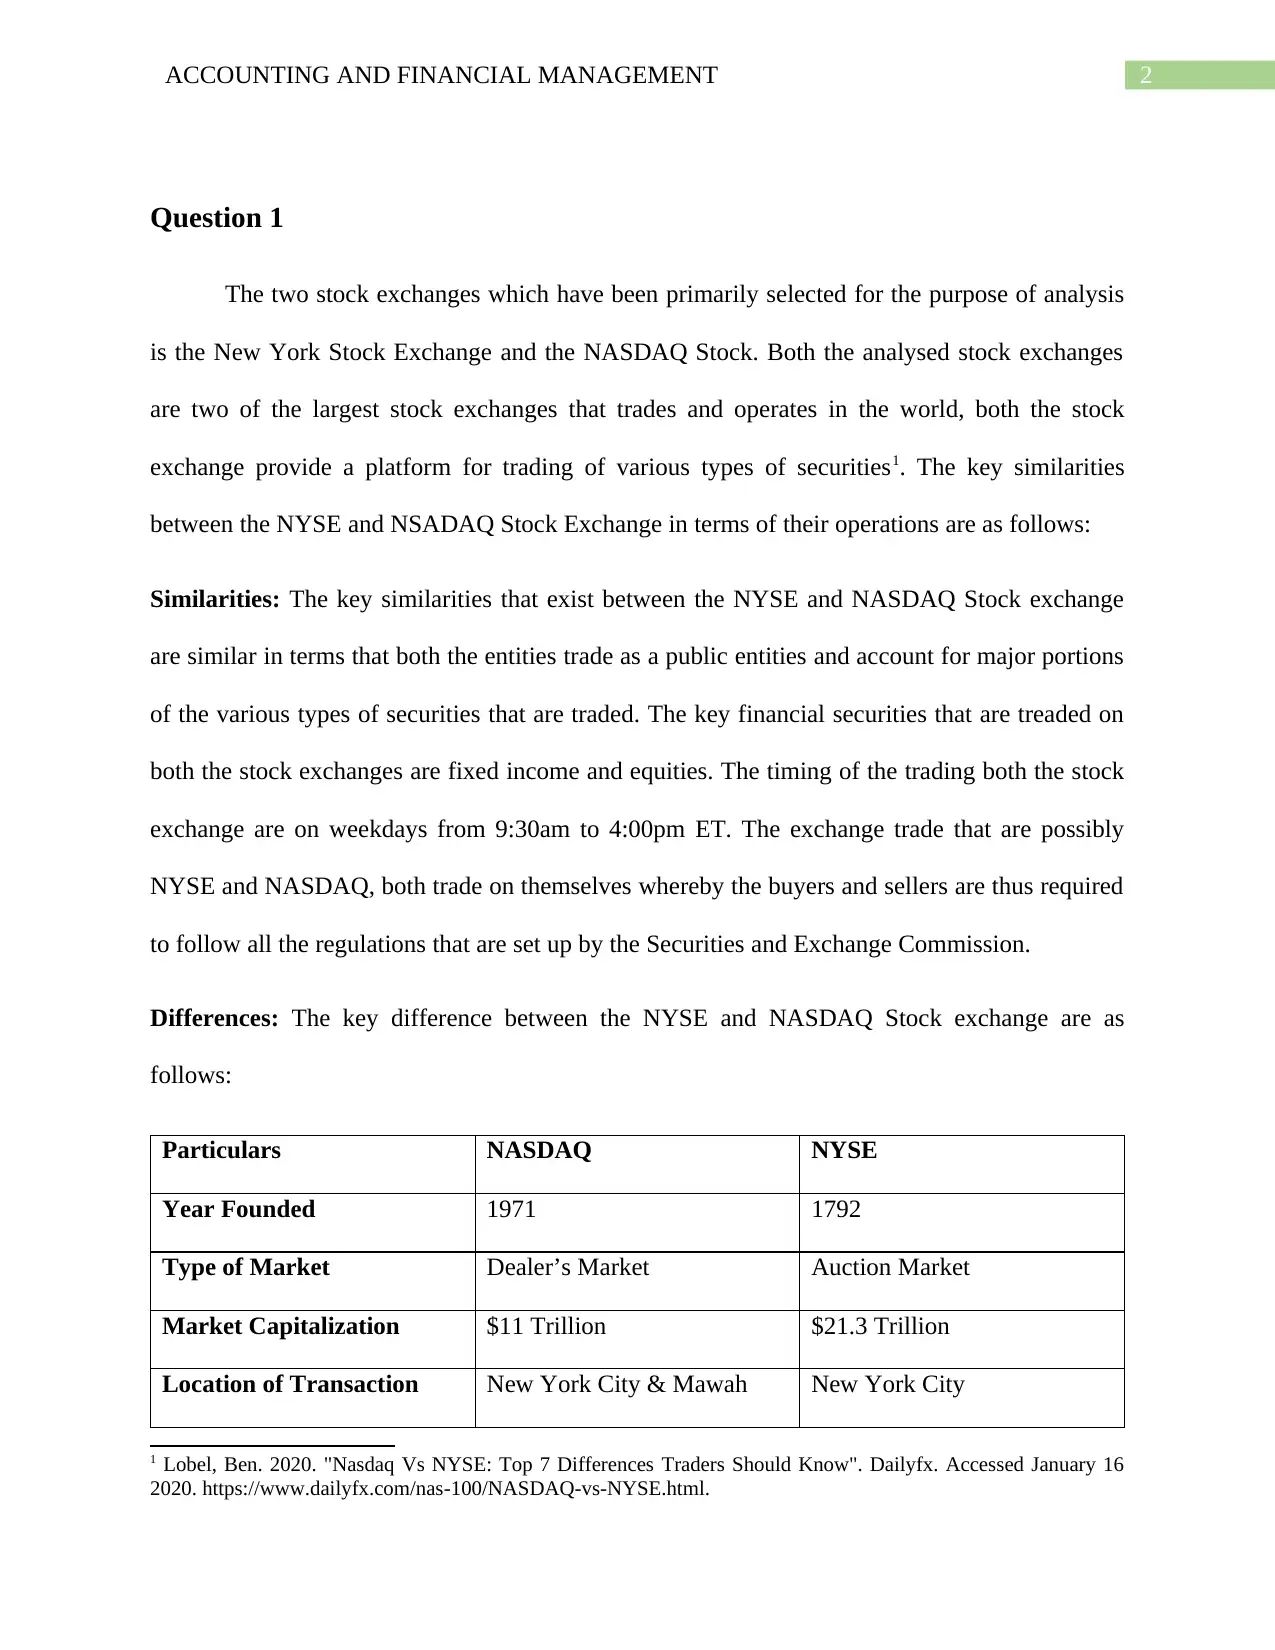
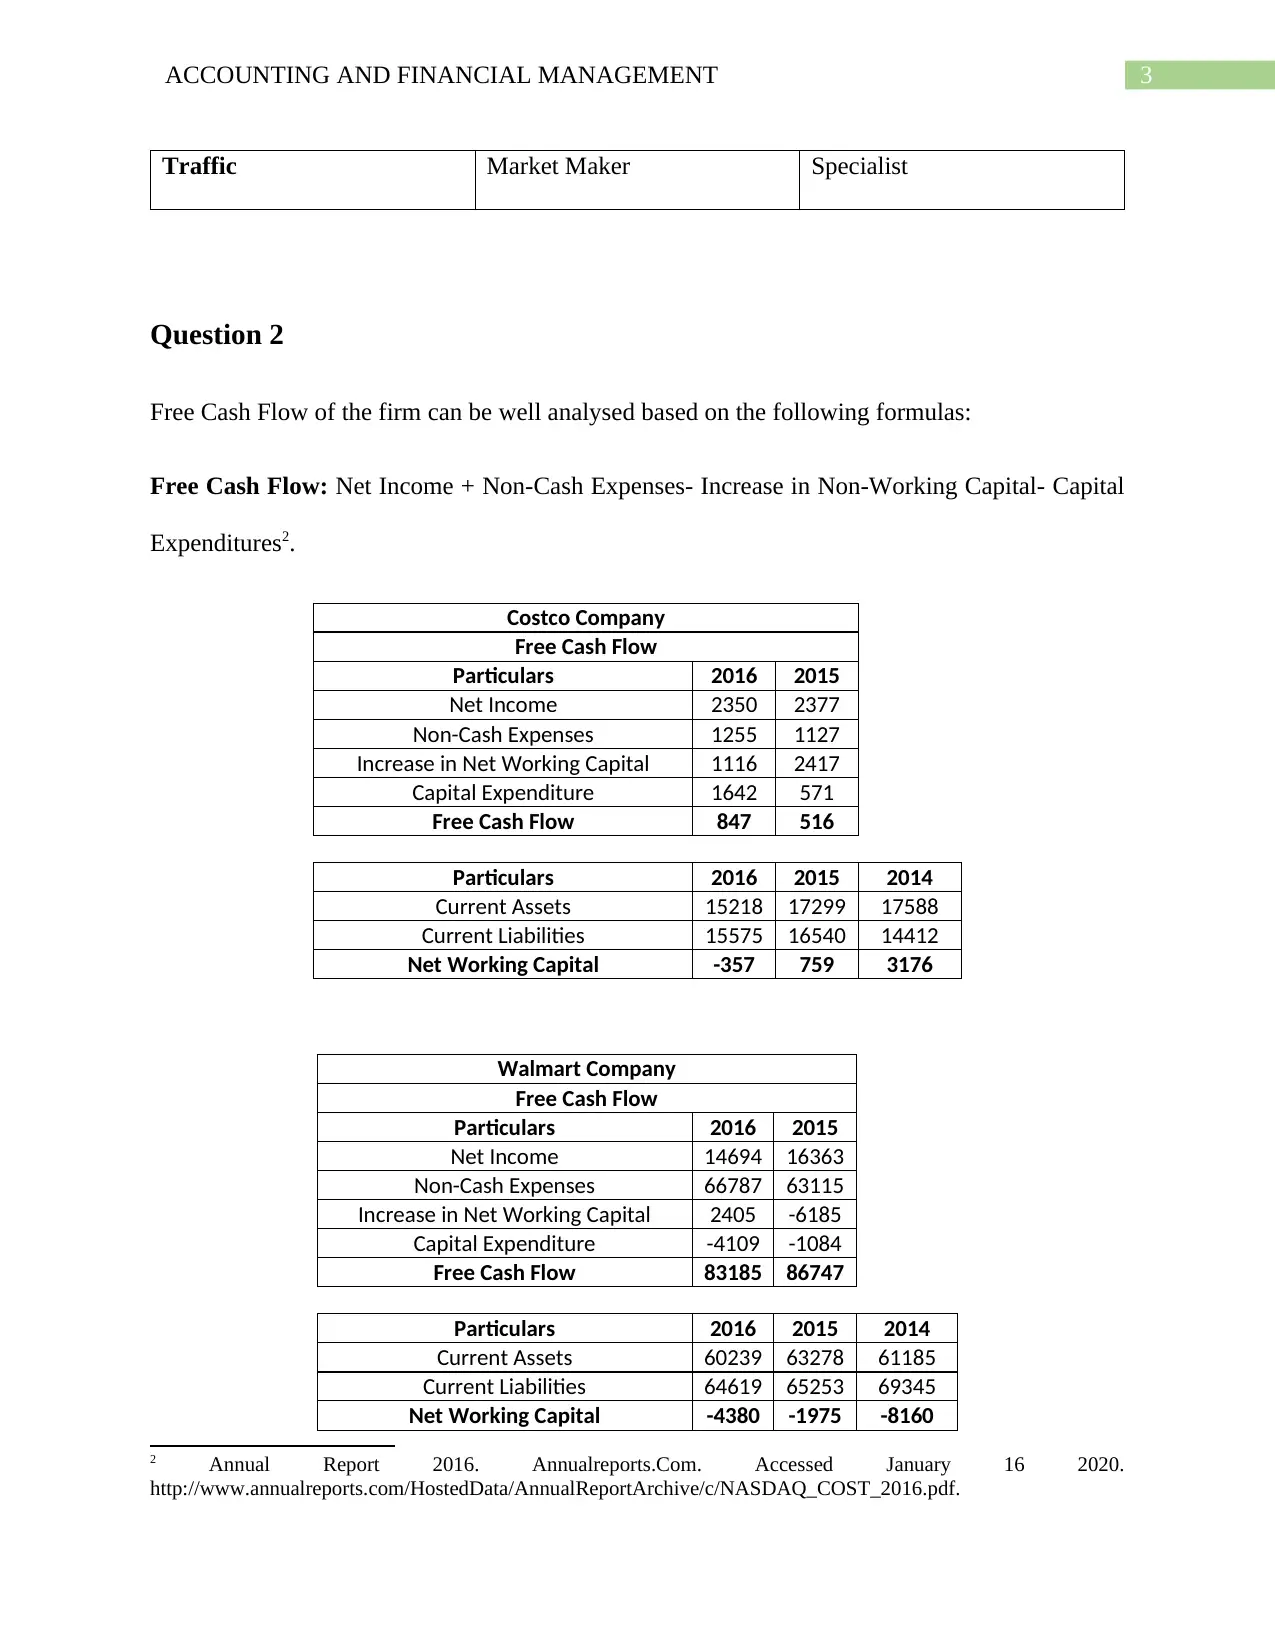
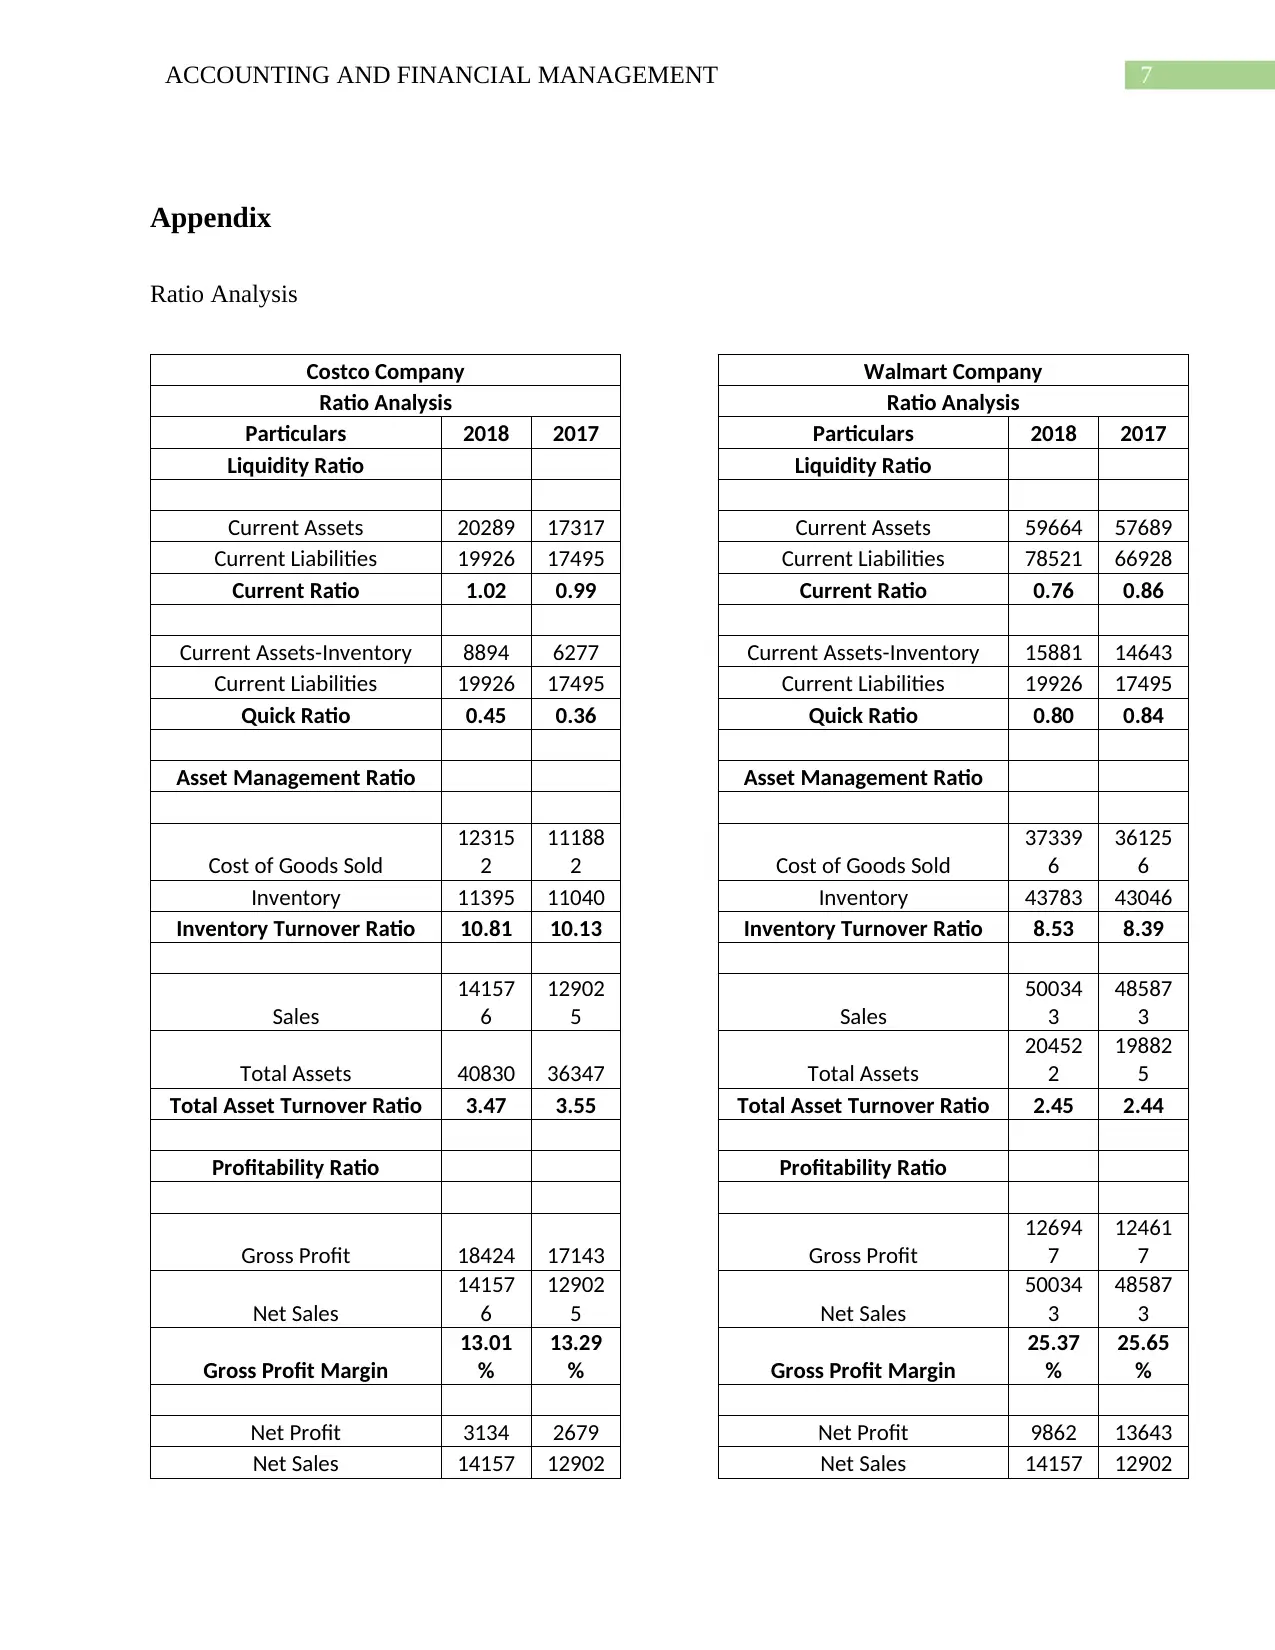
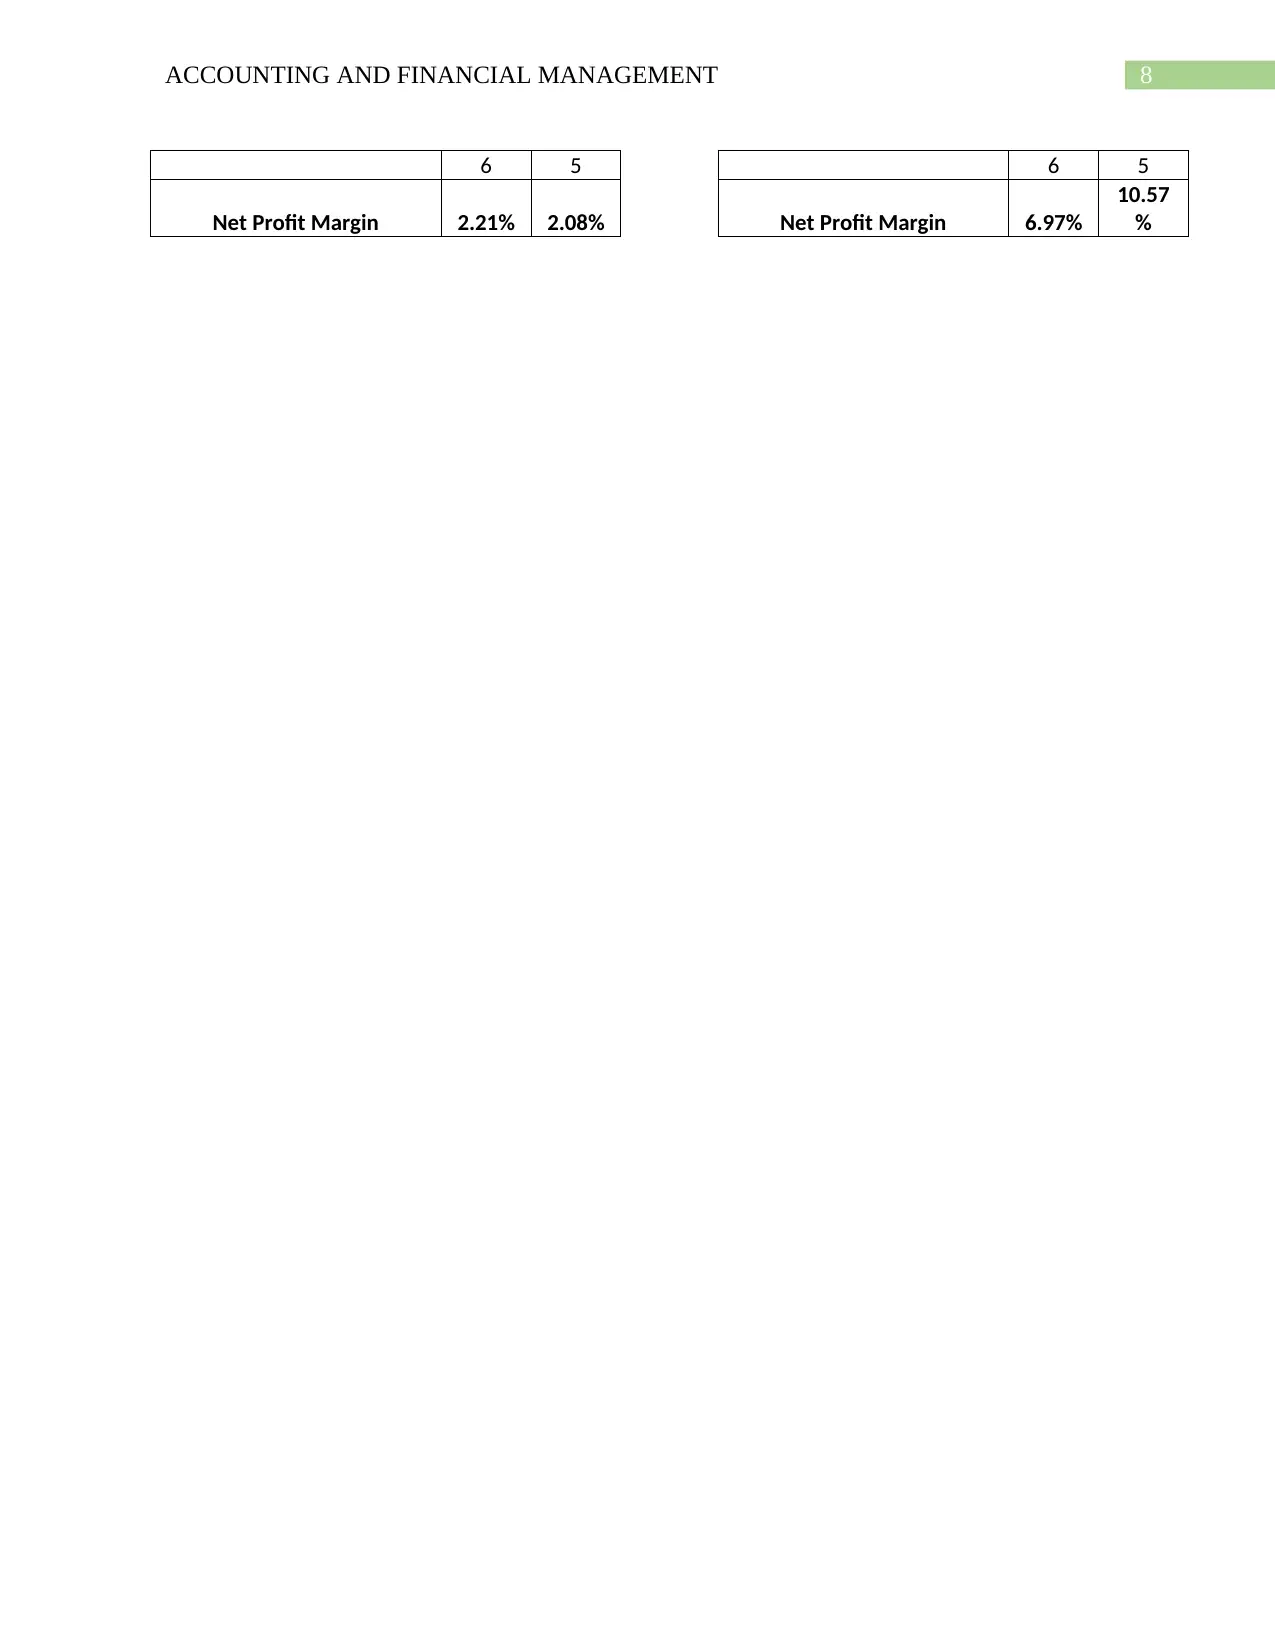
This report offers a comprehensive financial analysis, comparing Costco and Walmart's performance. It begins by examining the similarities and differences between the New York Stock Exchange (NYSE) and NASDAQ. The analysis then delves into the free cash flow of both companies, calculating and comparing figures for multiple years. Furthermore, the report includes a detailed ratio analysis, focusing on liquidity, asset management, and profitability ratios for both companies over a two-year period. The findings highlight the financial strengths and weaknesses of each company, providing insights into their operational efficiency and financial health. The report utilizes financial data from annual reports and other credible sources, offering a thorough evaluation of the companies' financial strategies and performance.

Running head: ACCOUNTING AND FINANCIAL MANAGEMENT
Accounting and Financial Management
Name of the Student:
Name of the University:
Author’s Note:
Accounting and Financial Management
Name of the Student:
Name of the University:
Author’s Note:
Paraphrase This Document
Need a fresh take? Get an instant paraphrase of this document with our AI Paraphraser

1ACCOUNTING AND FINANCIAL MANAGEMENT
Table of Contents
Question 1........................................................................................................................................2
Question 2........................................................................................................................................3
Question 3........................................................................................................................................4
References........................................................................................................................................6
Appendix..........................................................................................................................................7

2ACCOUNTING AND FINANCIAL MANAGEMENT
Question 1
The two stock exchanges which have been primarily selected for the purpose of analysis
is the New York Stock Exchange and the NASDAQ Stock. Both the analysed stock exchanges
are two of the largest stock exchanges that trades and operates in the world, both the stock
exchange provide a platform for trading of various types of securities1. The key similarities
between the NYSE and NSADAQ Stock Exchange in terms of their operations are as follows:
Similarities: The key similarities that exist between the NYSE and NASDAQ Stock exchange
are similar in terms that both the entities trade as a public entities and account for major portions
of the various types of securities that are traded. The key financial securities that are treaded on
both the stock exchanges are fixed income and equities. The timing of the trading both the stock
exchange are on weekdays from 9:30am to 4:00pm ET. The exchange trade that are possibly
NYSE and NASDAQ, both trade on themselves whereby the buyers and sellers are thus required
to follow all the regulations that are set up by the Securities and Exchange Commission.
Differences: The key difference between the NYSE and NASDAQ Stock exchange are as
follows:
Particulars NASDAQ NYSE
Year Founded 1971 1792
Type of Market Dealer’s Market Auction Market
Market Capitalization $11 Trillion $21.3 Trillion
Location of Transaction New York City & Mawah New York City
1 Lobel, Ben. 2020. "Nasdaq Vs NYSE: Top 7 Differences Traders Should Know". Dailyfx. Accessed January 16
2020. https://www.dailyfx.com/nas-100/NASDAQ-vs-NYSE.html.
⊘ This is a preview!⊘
Do you want full access?
Subscribe today to unlock all pages.

Trusted by 1+ million students worldwide

3ACCOUNTING AND FINANCIAL MANAGEMENT
Traffic Market Maker Specialist
Question 2
Free Cash Flow of the firm can be well analysed based on the following formulas:
Free Cash Flow: Net Income + Non-Cash Expenses- Increase in Non-Working Capital- Capital
Expenditures2.
Costco Company
Free Cash Flow
Particulars 2016 2015
Net Income 2350 2377
Non-Cash Expenses 1255 1127
Increase in Net Working Capital 1116 2417
Capital Expenditure 1642 571
Free Cash Flow 847 516
Particulars 2016 2015 2014
Current Assets 15218 17299 17588
Current Liabilities 15575 16540 14412
Net Working Capital -357 759 3176
Walmart Company
Free Cash Flow
Particulars 2016 2015
Net Income 14694 16363
Non-Cash Expenses 66787 63115
Increase in Net Working Capital 2405 -6185
Capital Expenditure -4109 -1084
Free Cash Flow 83185 86747
Particulars 2016 2015 2014
Current Assets 60239 63278 61185
Current Liabilities 64619 65253 69345
Net Working Capital -4380 -1975 -8160
2 Annual Report 2016. Annualreports.Com. Accessed January 16 2020.
http://www.annualreports.com/HostedData/AnnualReportArchive/c/NASDAQ_COST_2016.pdf.
Paraphrase This Document
Need a fresh take? Get an instant paraphrase of this document with our AI Paraphraser

4ACCOUNTING AND FINANCIAL MANAGEMENT
The free cash flow for the Costco Company on a comparative basis has increased and this
would be helping the company in better managing the operations and various other activities. On
the other hand, the free cash flow for the Walmart Company has fallen consistently for the
company and this has been particularly due to the fall in the net profitability of the company.
Question 3
The ratio analysis for the Walmart Company and Costco Company has been performed
for the sum of two years respectively which is 2017 and 2018 whereby relevant and important
changes in the financials of the company has been taken into consideration3.
Liquidity Ratio: The liquidity aspects of the company has been well analysed based on the
current and quick ratio for the company whereby it was seen that the Costco Company had a
better liquidity position. At the same time it is important to note that the Costco Company had a
large amount of inventory paced in their current assets which in turn increased the amount of
current assets4.
Asset Management Ratio: The asset management ratio for the company has been done well
with the help of inventory turnover ratio and Total Asset Turnover ratio which has been better
for the Costco Company5.
3 Annual Report 2018. Tescoplc.Com. Accessed January 17 2020.
https://www.tescoplc.com/media/474793/tesco_ar_2018.pdf.
4 Annual Report 2016. S2.Q4cdn.Com. Accessed January 16 2020.
https://s2.q4cdn.com/056532643/files/doc_financials/2016/annual/2016-Annual-Report-PDF.pdf.
5 Annual Report 2017. Tescoplc.Com. Accessed January 17 2020.
https://www.tescoplc.com/media/476554/68336_tesco_ar_digital_interactive_250417.pdf.

5ACCOUNTING AND FINANCIAL MANAGEMENT
Profitability Ratios: The profitability aspects compared in terms of gross and net profit margins
has been much better for the Walmart Company than the Costco Company and this has been
particularly due to the lower cost and higher profitability reported6.
6 Annual Report. 2015. Investor.Costco.Com. Accessed January 16 2020.
https://investor.costco.com/static-files/6df4cd0a-2720-4959-923d-0a2e6c94479a.
⊘ This is a preview!⊘
Do you want full access?
Subscribe today to unlock all pages.

Trusted by 1+ million students worldwide

6ACCOUNTING AND FINANCIAL MANAGEMENT
References
Lobel, Ben. 2020. "Nasdaq Vs NYSE: Top 7 Differences Traders Should Know". Dailyfx.
Accessed January 16 2020. https://www.dailyfx.com/nas-100/NASDAQ-vs-NYSE.html.
Annual Report. 2015. Investor.Costco.Com. Accessed January 16 2020.
https://investor.costco.com/static-files/6df4cd0a-2720-4959-923d-0a2e6c94479a.
Annual Report 2016. S2.Q4cdn.Com. Accessed January 16 2020.
https://s2.q4cdn.com/056532643/files/doc_financials/2016/annual/2016-Annual-Report-
PDF.pdf.
Annual Report 2016. Annualreports.Com. Accessed January 16 2020.
http://www.annualreports.com/HostedData/AnnualReportArchive/c/NASDAQ_COST_2016.pdf.
Annual Report 2018. Tescoplc.Com. Accessed January 17 2020.
https://www.tescoplc.com/media/474793/tesco_ar_2018.pdf.
Annual Report 2017. Tescoplc.Com. Accessed January 17 2020.
https://www.tescoplc.com/media/476554/68336_tesco_ar_digital_interactive_250417.pdf.
Paraphrase This Document
Need a fresh take? Get an instant paraphrase of this document with our AI Paraphraser

7ACCOUNTING AND FINANCIAL MANAGEMENT
Appendix
Ratio Analysis
Costco Company Walmart Company
Ratio Analysis Ratio Analysis
Particulars 2018 2017 Particulars 2018 2017
Liquidity Ratio Liquidity Ratio
Current Assets 20289 17317 Current Assets 59664 57689
Current Liabilities 19926 17495 Current Liabilities 78521 66928
Current Ratio 1.02 0.99 Current Ratio 0.76 0.86
Current Assets-Inventory 8894 6277 Current Assets-Inventory 15881 14643
Current Liabilities 19926 17495 Current Liabilities 19926 17495
Quick Ratio 0.45 0.36 Quick Ratio 0.80 0.84
Asset Management Ratio Asset Management Ratio
Cost of Goods Sold
12315
2
11188
2 Cost of Goods Sold
37339
6
36125
6
Inventory 11395 11040 Inventory 43783 43046
Inventory Turnover Ratio 10.81 10.13 Inventory Turnover Ratio 8.53 8.39
Sales
14157
6
12902
5 Sales
50034
3
48587
3
Total Assets 40830 36347 Total Assets
20452
2
19882
5
Total Asset Turnover Ratio 3.47 3.55 Total Asset Turnover Ratio 2.45 2.44
Profitability Ratio Profitability Ratio
Gross Profit 18424 17143 Gross Profit
12694
7
12461
7
Net Sales
14157
6
12902
5 Net Sales
50034
3
48587
3
Gross Profit Margin
13.01
%
13.29
% Gross Profit Margin
25.37
%
25.65
%
Net Profit 3134 2679 Net Profit 9862 13643
Net Sales 14157 12902 Net Sales 14157 12902

8ACCOUNTING AND FINANCIAL MANAGEMENT
6 5 6 5
Net Profit Margin 2.21% 2.08% Net Profit Margin 6.97%
10.57
%
6 5 6 5
Net Profit Margin 2.21% 2.08% Net Profit Margin 6.97%
10.57
%
⊘ This is a preview!⊘
Do you want full access?
Subscribe today to unlock all pages.

Trusted by 1+ million students worldwide
1 out of 9
Related Documents

Your All-in-One AI-Powered Toolkit for Academic Success.
 +13062052269
info@desklib.com
Available 24*7 on WhatsApp / Email
Unlock your academic potential
Copyright © 2020–2025 A2Z Services. All Rights Reserved. Developed and managed by ZUCOL.