Report on Costing Techniques: Variance Analysis for Anderson Ltd
VerifiedAdded on 2020/02/12
|8
|2001
|82
Report
AI Summary
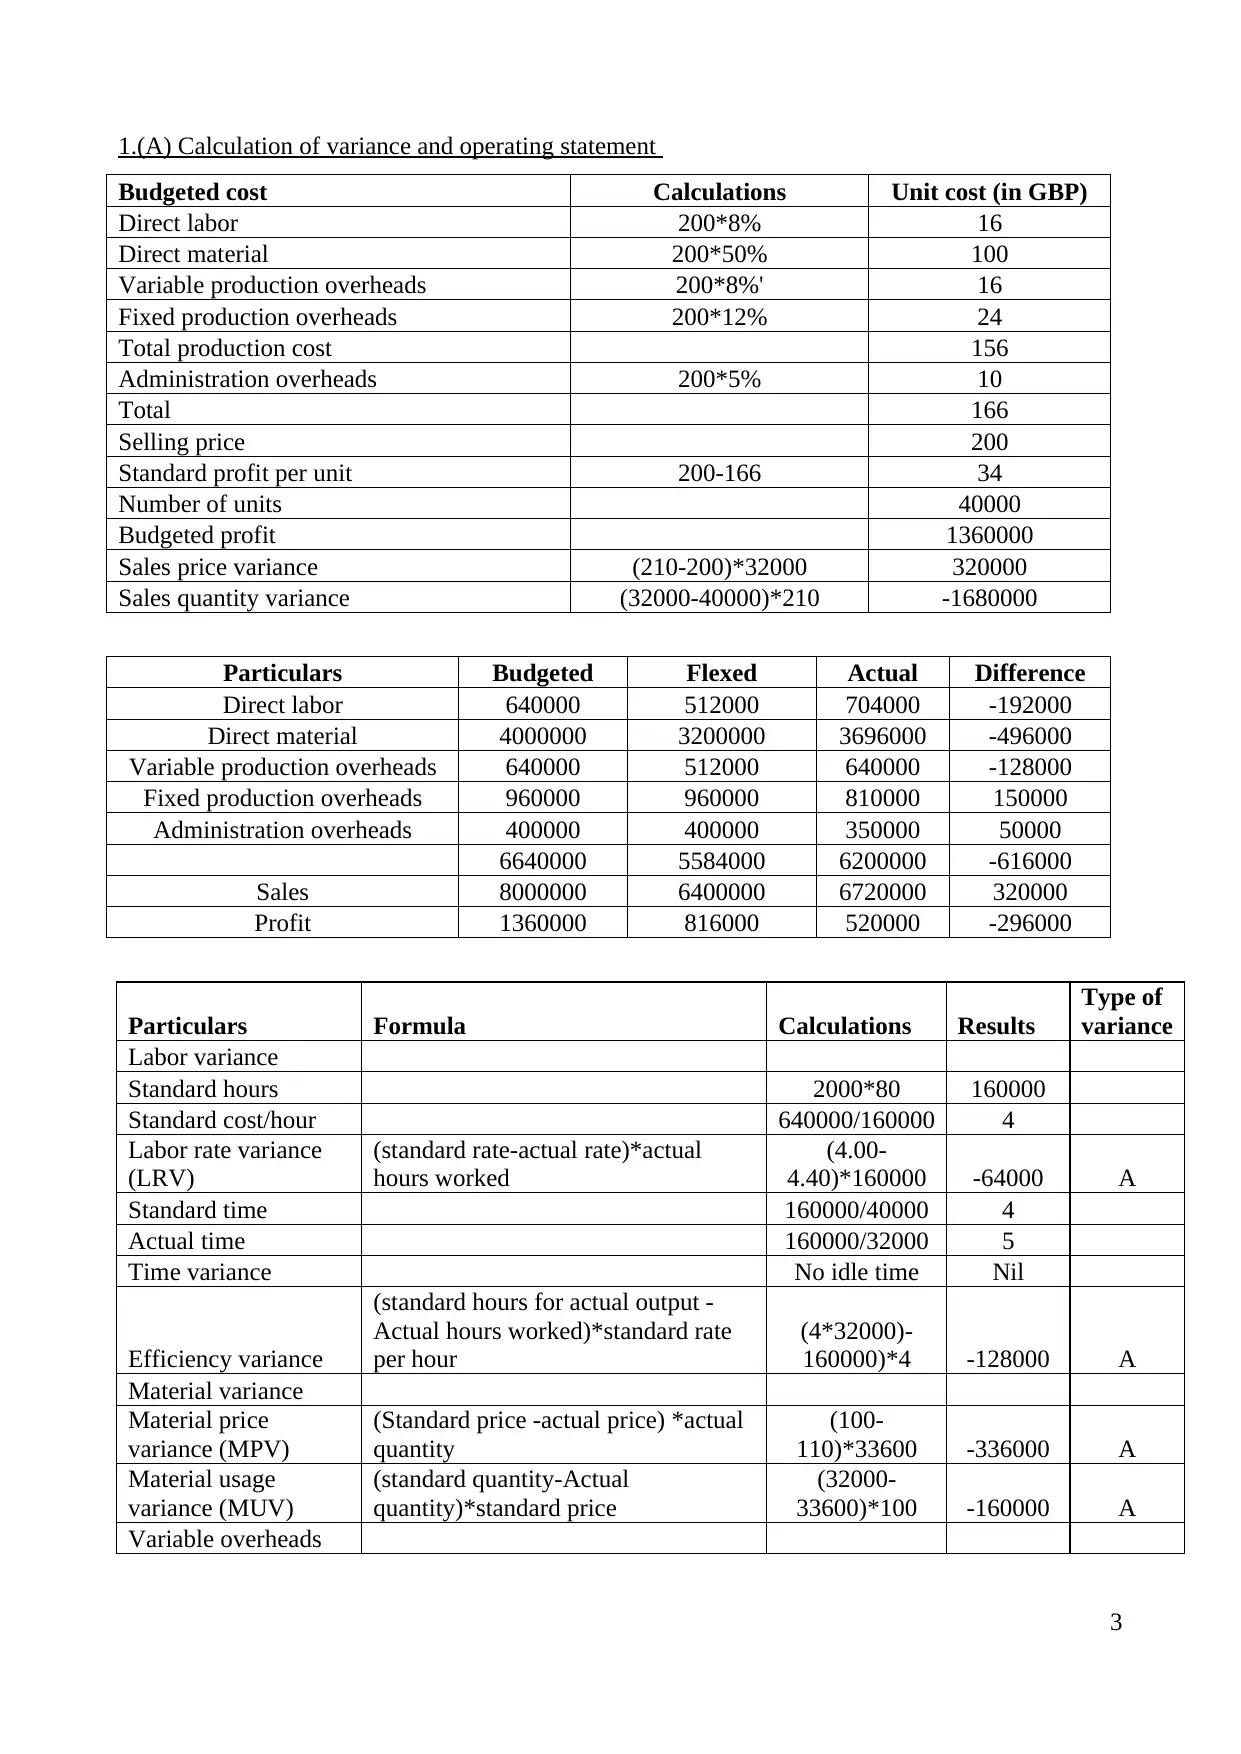
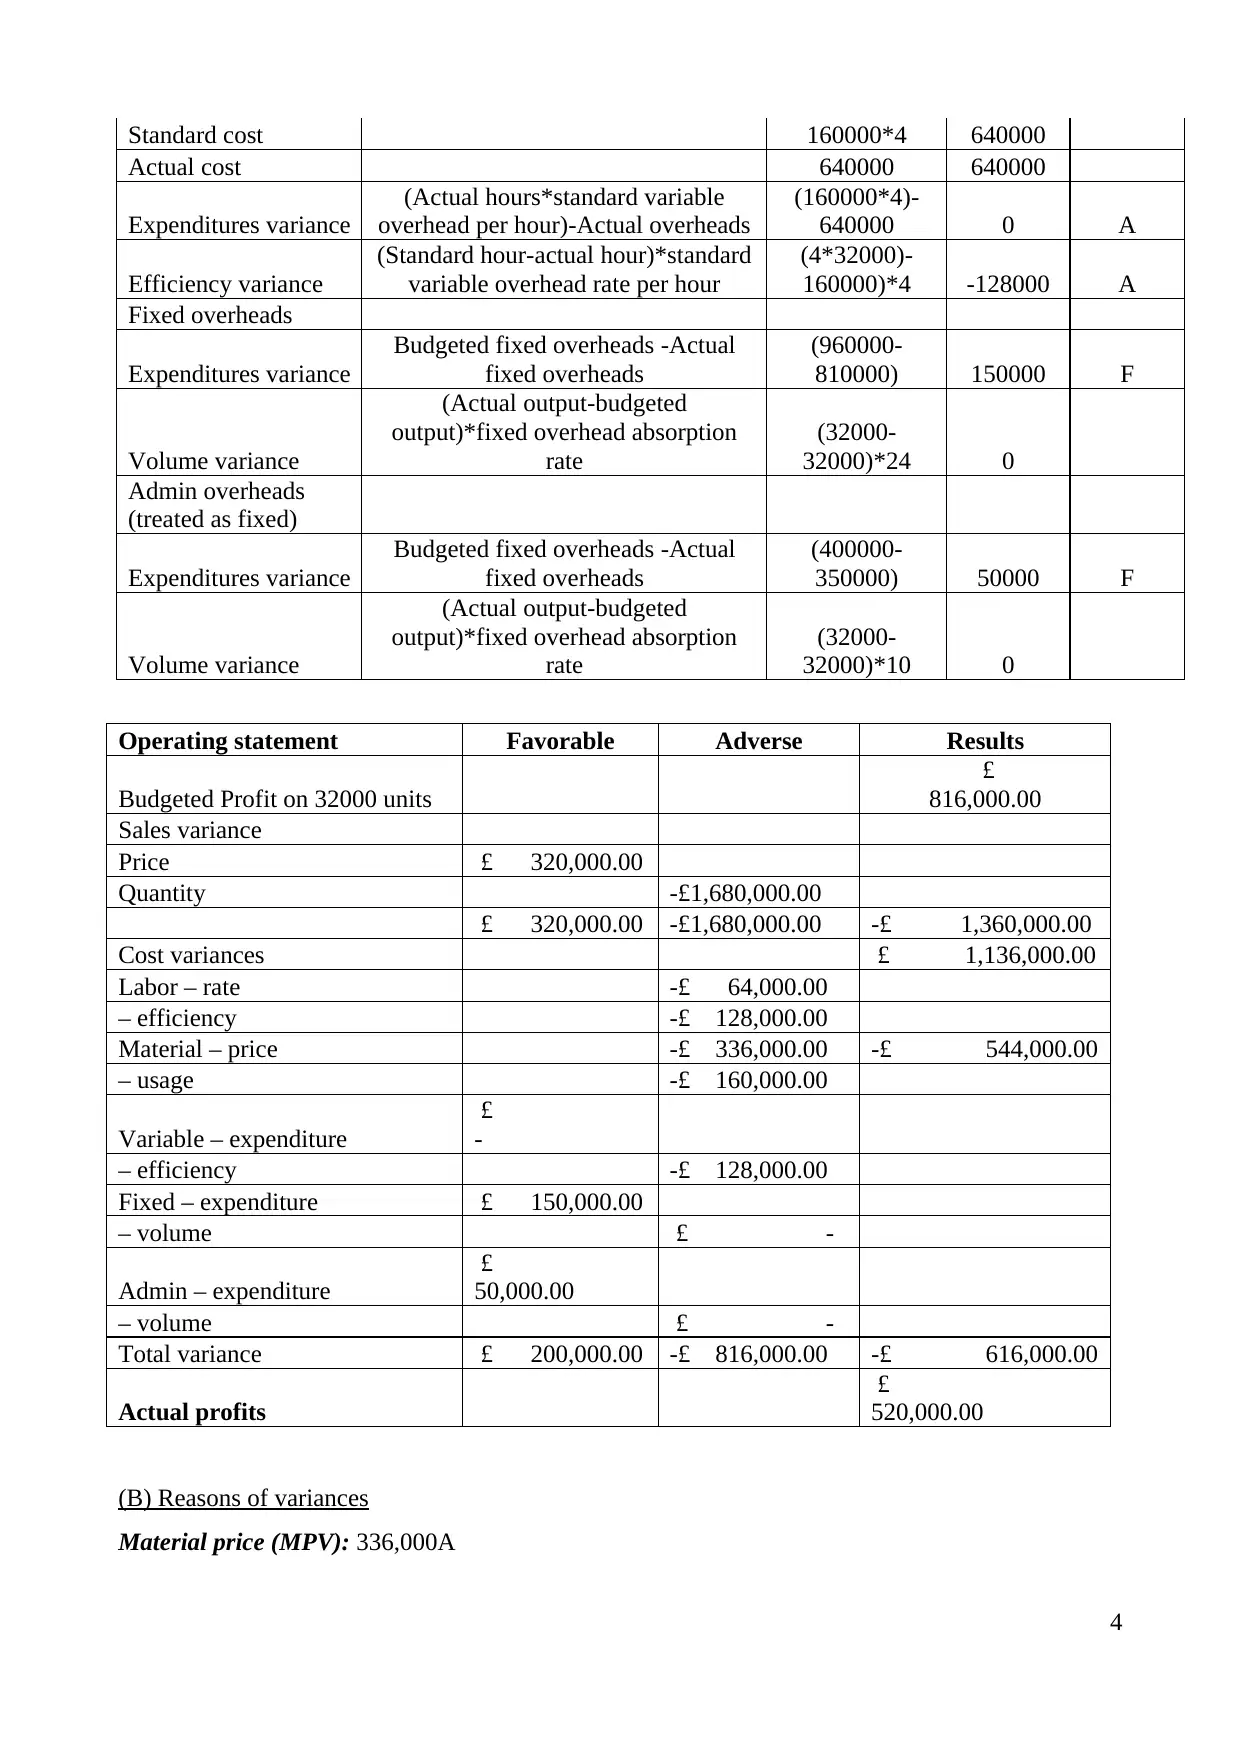
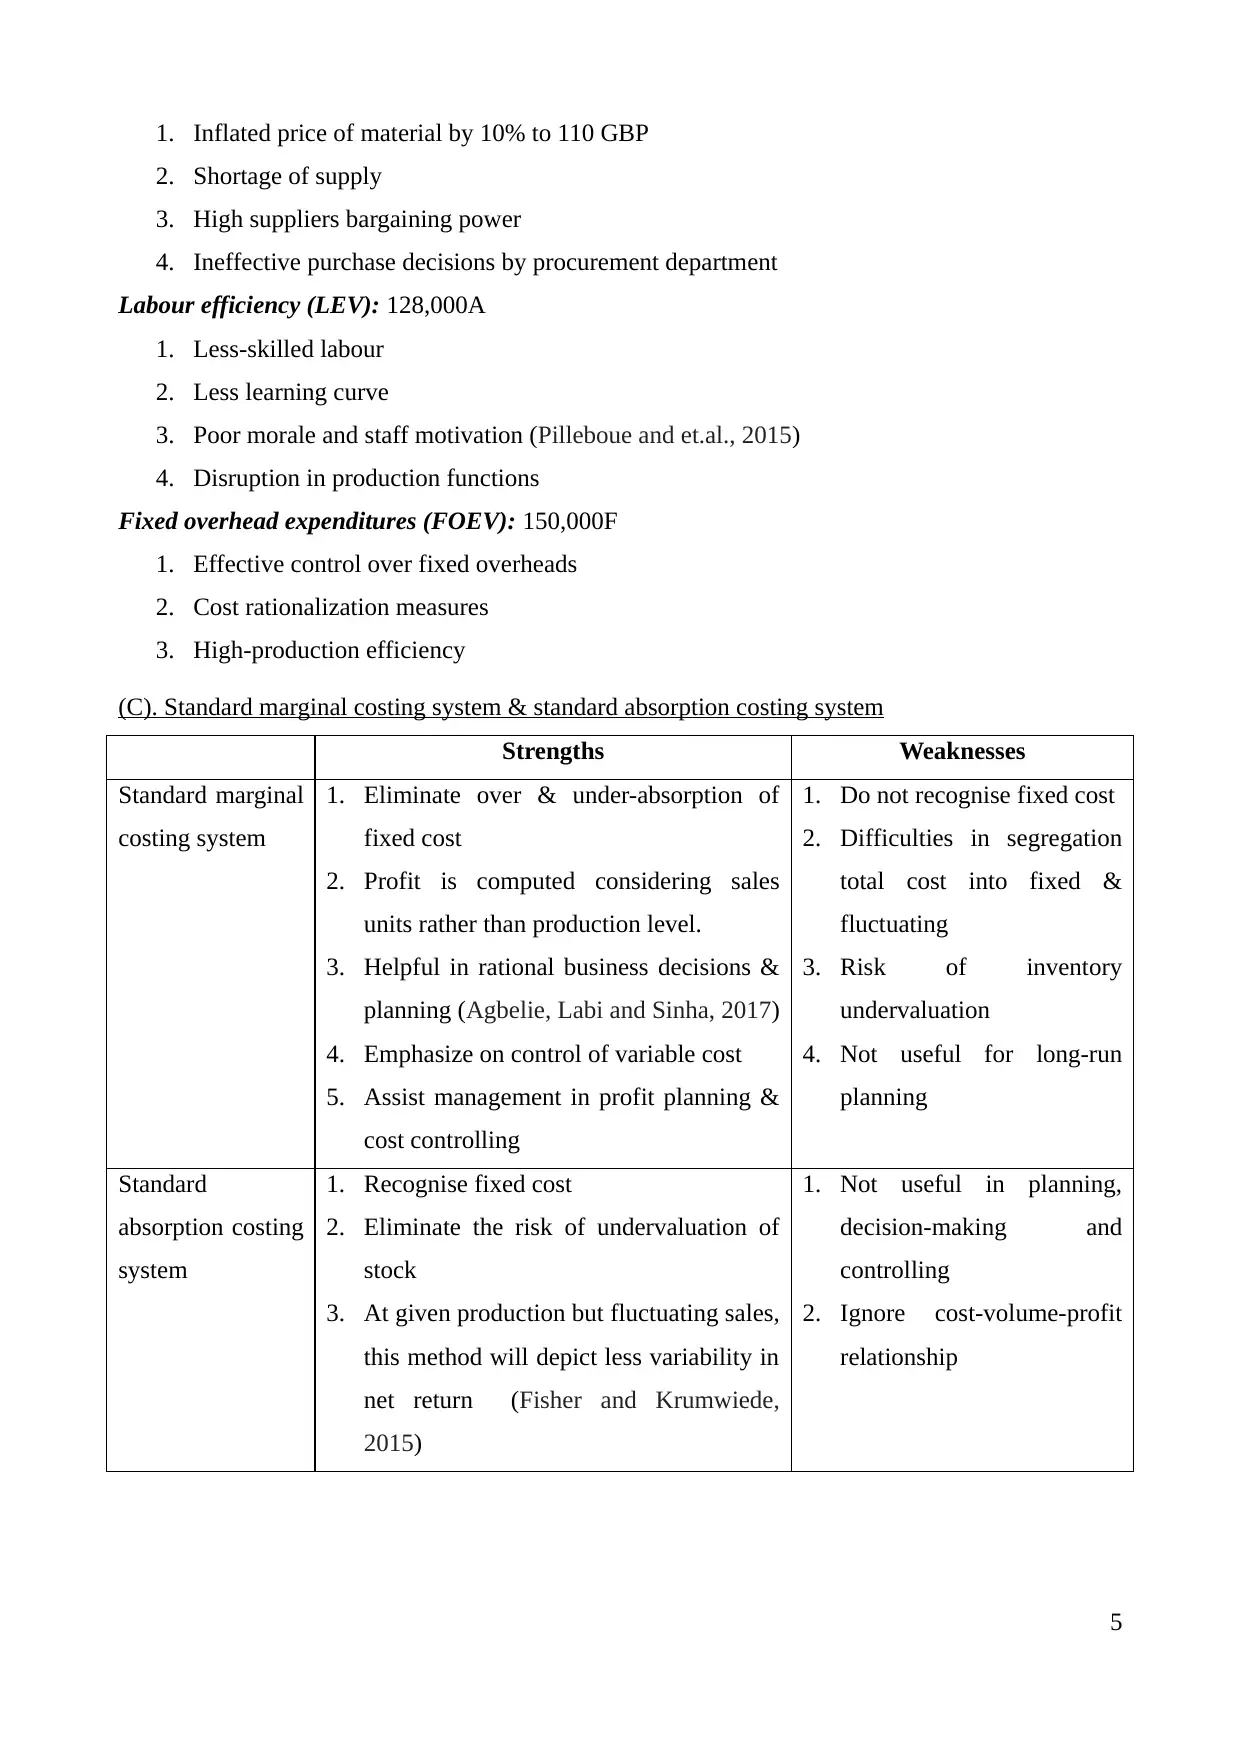
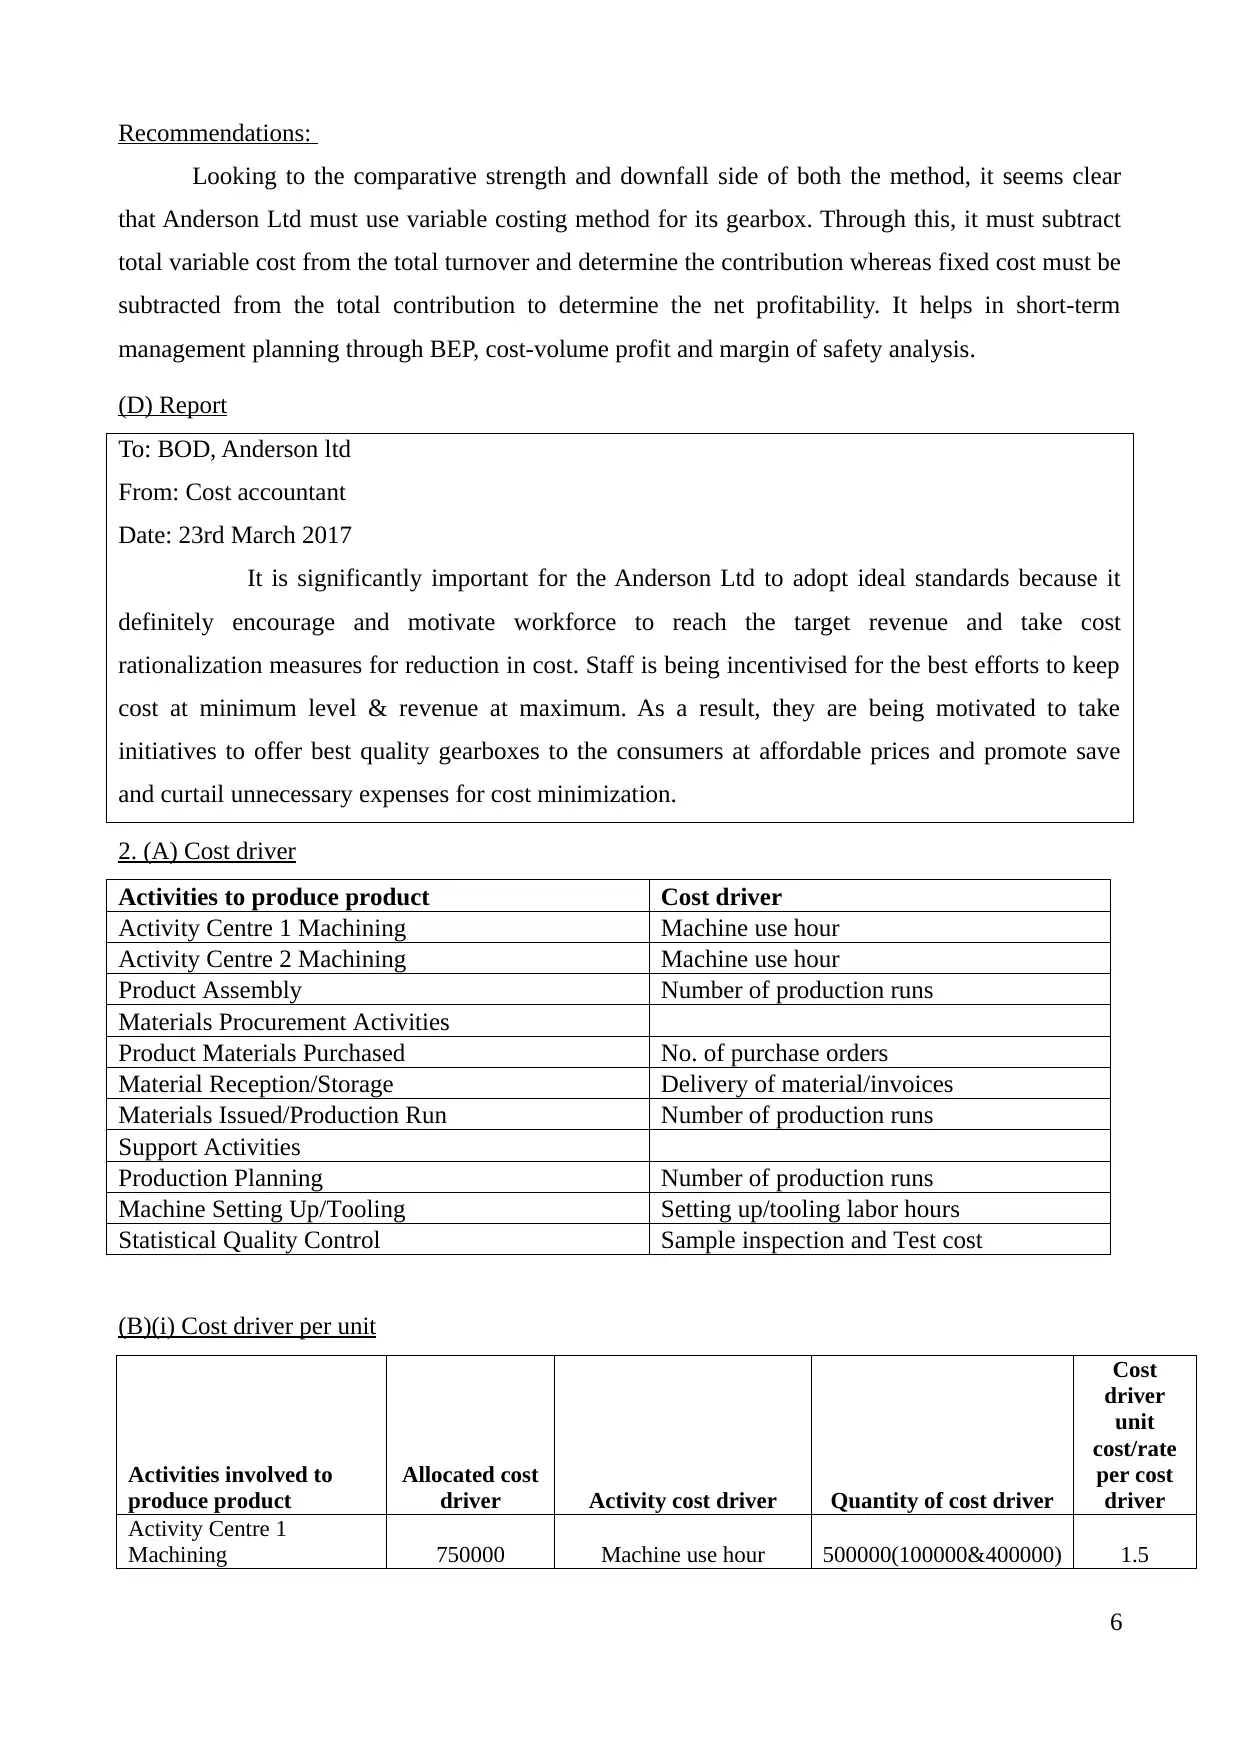
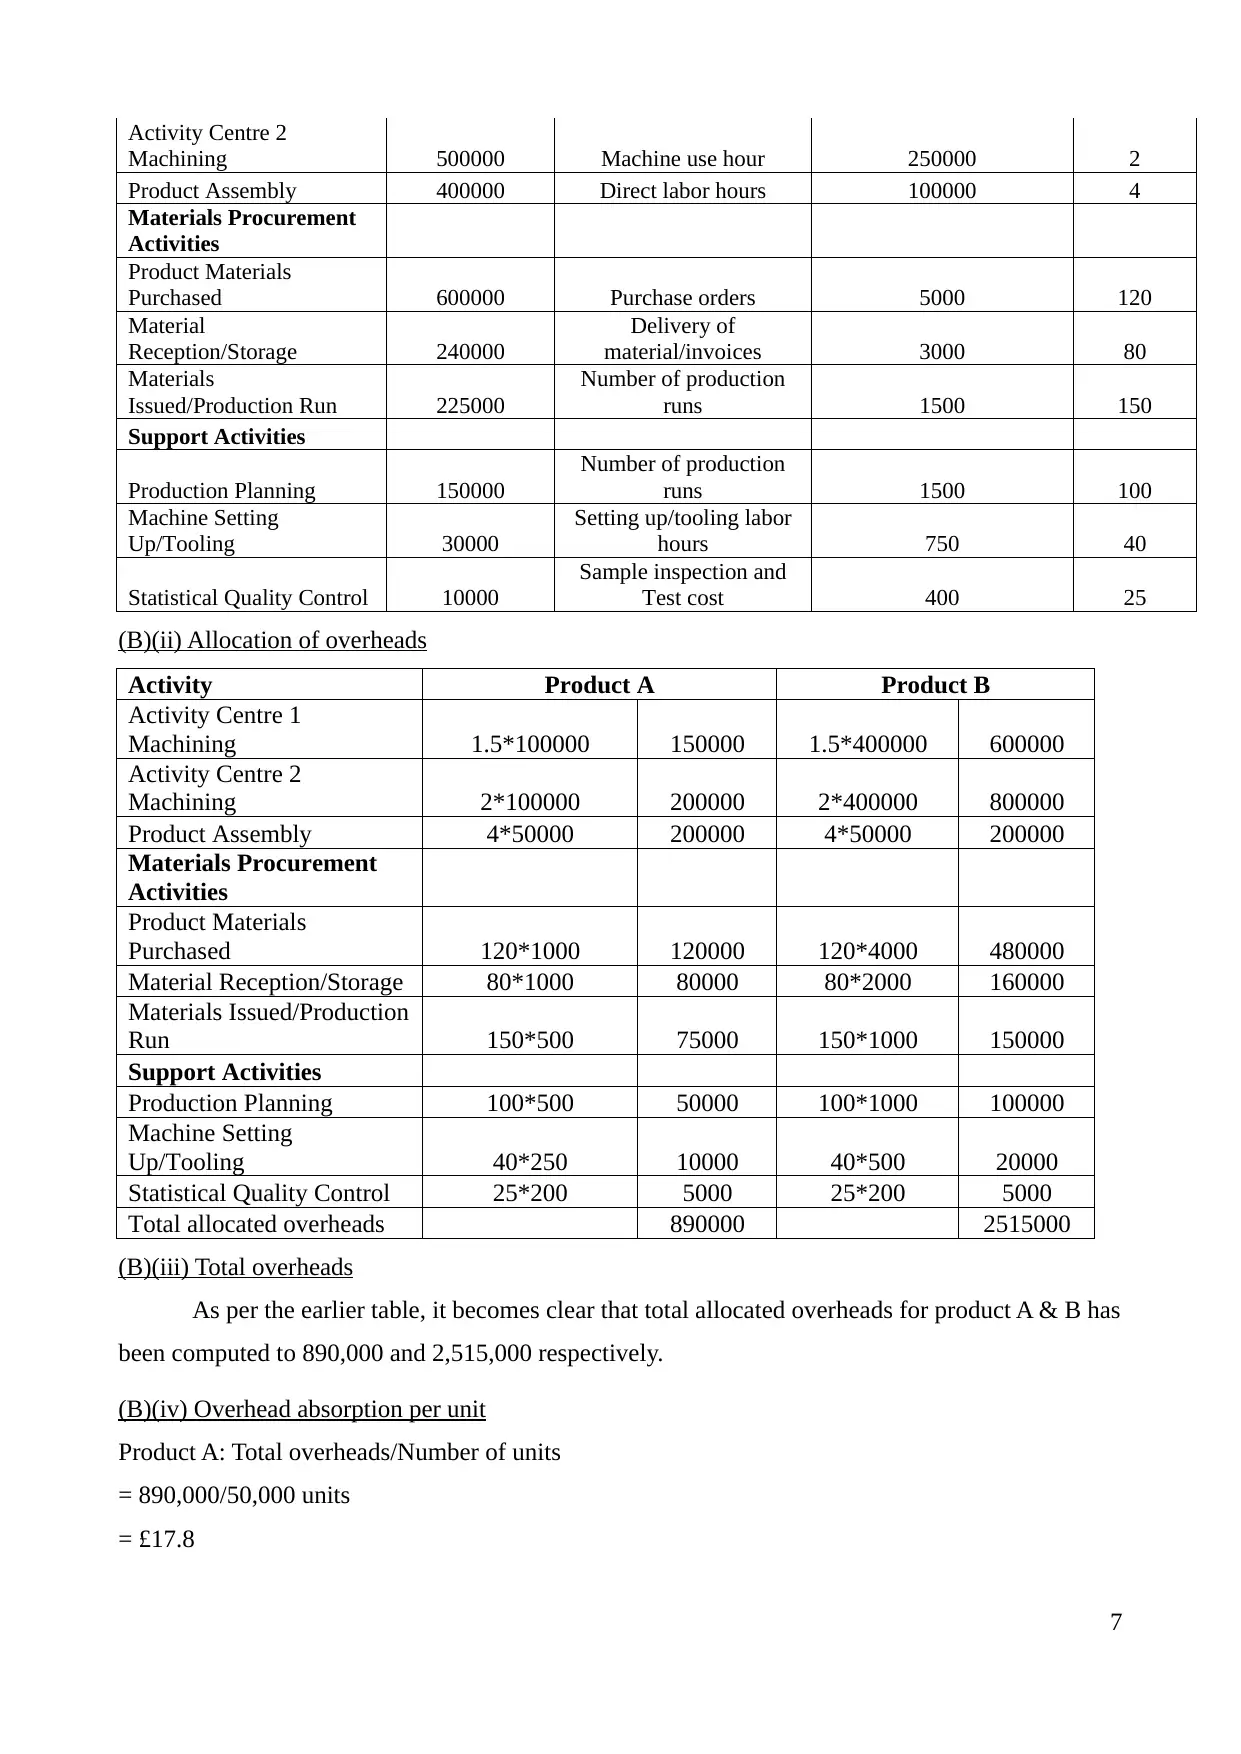
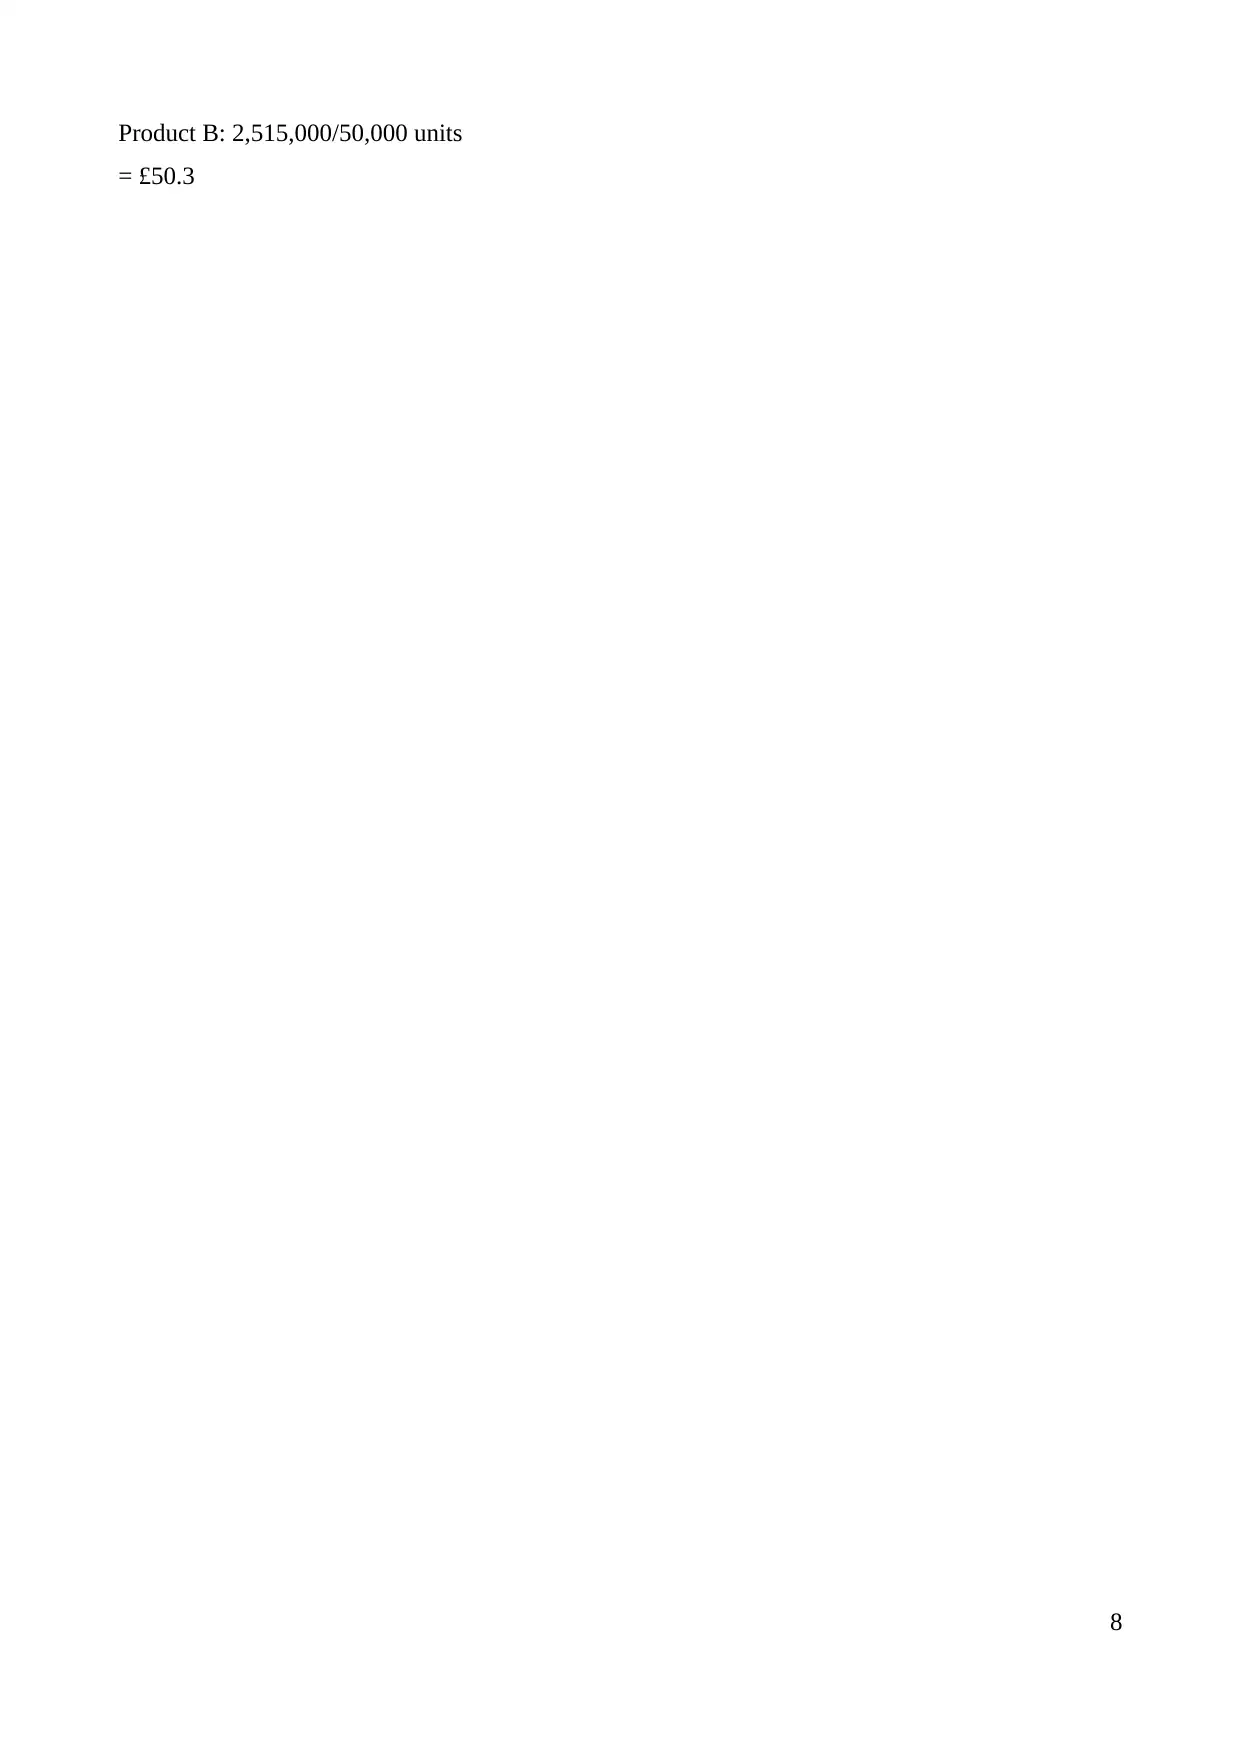
This report provides a detailed analysis of costing techniques, focusing on variance analysis and its application within Anderson Ltd. The report begins with the calculation of variances and the preparation of an operating statement, examining direct labor, direct materials, and overhead costs. It then ...

COSTING
TECHNIQUES
1
TECHNIQUES
1
Paraphrase This Document
Need a fresh take? Get an instant paraphrase of this document with our AI Paraphraser

Table of Contents
1.(A) Calculation of variance and operating statement...................................................................3
(B) Reasons of variances.................................................................................................................4
(C). Standard marginal costing system & standard absorption costing system...............................5
Recommendations:...........................................................................................................................5
(D) Report........................................................................................................................................6
2. (A) Cost driver.............................................................................................................................6
(B)(i) Cost driver per unit................................................................................................................6
(B)(ii) Allocation of overheads........................................................................................................7
(B)(iii) Total overheads....................................................................................................................7
(B)(iv) Overhead absorption per unit...............................................................................................7
REFERENCES.....................................................................................................................................8
2

1.(A) Calculation of variance and operating statement
Budgeted cost Calculations Unit cost (in GBP)
Direct labor 200*8% 16
Direct material 200*50% 100
Variable production overheads 200*8%' 16
Fixed production overheads 200*12% 24
Total production cost 156
Administration overheads 200*5% 10
Total 166
Selling price 200
Standard profit per unit 200-166 34
Number of units 40000
Budgeted profit 1360000
Sales price variance (210-200)*32000 320000
Sales quantity variance (32000-40000)*210 -1680000
Particulars Budgeted Flexed Actual Difference
Direct labor 640000 512000 704000 -192000
Direct material 4000000 3200000 3696000 -496000
Variable production overheads 640000 512000 640000 -128000
Fixed production overheads 960000 960000 810000 150000
Administration overheads 400000 400000 350000 50000
6640000 5584000 6200000 -616000
Sales 8000000 6400000 6720000 320000
Profit 1360000 816000 520000 -296000
Particulars Formula Calculations Results
Type of
variance
Labor variance
Standard hours 2000*80 160000
Standard cost/hour 640000/160000 4
Labor rate variance
(LRV)
(standard rate-actual rate)*actual
hours worked
(4.00-
4.40)*160000 -64000 A
Standard time 160000/40000 4
Actual time 160000/32000 5
Time variance No idle time Nil
Efficiency variance
(standard hours for actual output -
Actual hours worked)*standard rate
per hour
(4*32000)-
160000)*4 -128000 A
Material variance
Material price
variance (MPV)
(Standard price -actual price) *actual
quantity
(100-
110)*33600 -336000 A
Material usage
variance (MUV)
(standard quantity-Actual
quantity)*standard price
(32000-
33600)*100 -160000 A
Variable overheads
3
⊘ This is a preview!⊘
Do you want full access?
Subscribe today to unlock all pages.

Trusted by 1+ million students worldwide

Standard cost 160000*4 640000
Actual cost 640000 640000
Expenditures variance
(Actual hours*standard variable
overhead per hour)-Actual overheads
(160000*4)-
640000 0 A
Efficiency variance
(Standard hour-actual hour)*standard
variable overhead rate per hour
(4*32000)-
160000)*4 -128000 A
Fixed overheads
Expenditures variance
Budgeted fixed overheads -Actual
fixed overheads
(960000-
810000) 150000 F
Volume variance
(Actual output-budgeted
output)*fixed overhead absorption
rate
(32000-
32000)*24 0
Admin overheads
(treated as fixed)
Expenditures variance
Budgeted fixed overheads -Actual
fixed overheads
(400000-
350000) 50000 F
Volume variance
(Actual output-budgeted
output)*fixed overhead absorption
rate
(32000-
32000)*10 0
Operating statement Favorable Adverse Results
Budgeted Profit on 32000 units
£
816,000.00
Sales variance
Price £ 320,000.00
Quantity -£1,680,000.00
£ 320,000.00 -£1,680,000.00 -£ 1,360,000.00
Cost variances £ 1,136,000.00
Labor – rate -£ 64,000.00
– efficiency -£ 128,000.00
Material – price -£ 336,000.00 -£ 544,000.00
– usage -£ 160,000.00
Variable – expenditure
£
-
– efficiency -£ 128,000.00
Fixed – expenditure £ 150,000.00
– volume £ -
Admin – expenditure
£
50,000.00
– volume £ -
Total variance £ 200,000.00 -£ 816,000.00 -£ 616,000.00
Actual profits
£
520,000.00
(B) Reasons of variances
Material price (MPV): 336,000A
4
Paraphrase This Document
Need a fresh take? Get an instant paraphrase of this document with our AI Paraphraser

1. Inflated price of material by 10% to 110 GBP
2. Shortage of supply
3. High suppliers bargaining power
4. Ineffective purchase decisions by procurement department
Labour efficiency (LEV): 128,000A
1. Less-skilled labour
2. Less learning curve
3. Poor morale and staff motivation (Pilleboue and et.al., 2015)
4. Disruption in production functions
Fixed overhead expenditures (FOEV): 150,000F
1. Effective control over fixed overheads
2. Cost rationalization measures
3. High-production efficiency
(C). Standard marginal costing system & standard absorption costing system
Strengths Weaknesses
Standard marginal
costing system
1. Eliminate over & under-absorption of
fixed cost
2. Profit is computed considering sales
units rather than production level.
3. Helpful in rational business decisions &
planning (Agbelie, Labi and Sinha, 2017)
4. Emphasize on control of variable cost
5. Assist management in profit planning &
cost controlling
1. Do not recognise fixed cost
2. Difficulties in segregation
total cost into fixed &
fluctuating
3. Risk of inventory
undervaluation
4. Not useful for long-run
planning
Standard
absorption costing
system
1. Recognise fixed cost
2. Eliminate the risk of undervaluation of
stock
3. At given production but fluctuating sales,
this method will depict less variability in
net return (Fisher and Krumwiede,
2015)
1. Not useful in planning,
decision-making and
controlling
2. Ignore cost-volume-profit
relationship
5

Recommendations:
Looking to the comparative strength and downfall side of both the method, it seems clear
that Anderson Ltd must use variable costing method for its gearbox. Through this, it must subtract
total variable cost from the total turnover and determine the contribution whereas fixed cost must be
subtracted from the total contribution to determine the net profitability. It helps in short-term
management planning through BEP, cost-volume profit and margin of safety analysis.
(D) Report
To: BOD, Anderson ltd
From: Cost accountant
Date: 23rd March 2017
It is significantly important for the Anderson Ltd to adopt ideal standards because it
definitely encourage and motivate workforce to reach the target revenue and take cost
rationalization measures for reduction in cost. Staff is being incentivised for the best efforts to keep
cost at minimum level & revenue at maximum. As a result, they are being motivated to take
initiatives to offer best quality gearboxes to the consumers at affordable prices and promote save
and curtail unnecessary expenses for cost minimization.
2. (A) Cost driver
Activities to produce product Cost driver
Activity Centre 1 Machining Machine use hour
Activity Centre 2 Machining Machine use hour
Product Assembly Number of production runs
Materials Procurement Activities
Product Materials Purchased No. of purchase orders
Material Reception/Storage Delivery of material/invoices
Materials Issued/Production Run Number of production runs
Support Activities
Production Planning Number of production runs
Machine Setting Up/Tooling Setting up/tooling labor hours
Statistical Quality Control Sample inspection and Test cost
(B)(i) Cost driver per unit
Activities involved to
produce product
Allocated cost
driver Activity cost driver Quantity of cost driver
Cost
driver
unit
cost/rate
per cost
driver
Activity Centre 1
Machining 750000 Machine use hour 500000(100000&400000) 1.5
6
⊘ This is a preview!⊘
Do you want full access?
Subscribe today to unlock all pages.

Trusted by 1+ million students worldwide

Activity Centre 2
Machining 500000 Machine use hour 250000 2
Product Assembly 400000 Direct labor hours 100000 4
Materials Procurement
Activities
Product Materials
Purchased 600000 Purchase orders 5000 120
Material
Reception/Storage 240000
Delivery of
material/invoices 3000 80
Materials
Issued/Production Run 225000
Number of production
runs 1500 150
Support Activities
Production Planning 150000
Number of production
runs 1500 100
Machine Setting
Up/Tooling 30000
Setting up/tooling labor
hours 750 40
Statistical Quality Control 10000
Sample inspection and
Test cost 400 25
(B)(ii) Allocation of overheads
Activity Product A Product B
Activity Centre 1
Machining 1.5*100000 150000 1.5*400000 600000
Activity Centre 2
Machining 2*100000 200000 2*400000 800000
Product Assembly 4*50000 200000 4*50000 200000
Materials Procurement
Activities
Product Materials
Purchased 120*1000 120000 120*4000 480000
Material Reception/Storage 80*1000 80000 80*2000 160000
Materials Issued/Production
Run 150*500 75000 150*1000 150000
Support Activities
Production Planning 100*500 50000 100*1000 100000
Machine Setting
Up/Tooling 40*250 10000 40*500 20000
Statistical Quality Control 25*200 5000 25*200 5000
Total allocated overheads 890000 2515000
(B)(iii) Total overheads
As per the earlier table, it becomes clear that total allocated overheads for product A & B has
been computed to 890,000 and 2,515,000 respectively.
(B)(iv) Overhead absorption per unit
Product A: Total overheads/Number of units
= 890,000/50,000 units
= £17.8
7
Paraphrase This Document
Need a fresh take? Get an instant paraphrase of this document with our AI Paraphraser

Product B: 2,515,000/50,000 units
= £50.3
8
= £50.3
8
1 out of 8
Related Documents

Your All-in-One AI-Powered Toolkit for Academic Success.
+13062052269
info@desklib.com
Available 24*7 on WhatsApp / Email
Unlock your academic potential
© 2024 | Zucol Services PVT LTD | All rights reserved.