Management Accounting Report: Smart Looks Case Study
VerifiedAdded on 2020/02/03
|19
|5696
|316
Report
AI Summary
This report analyzes management accounting principles applied to the case of Smart Looks, a clothing manufacturer. It begins by classifying costs (variable, fixed, semi-variable, direct, and indirect) and computing total and unit costs at different production levels, including graphical analysis. Inventory valuation methods (FIFO, LIFO, and average cost) are compared, and a report on cost of goods sold is prepared. The report then identifies critical success factors and KPIs for measuring success, including ways to minimize costs and strategies to enhance value and quality. The second task focuses on budgeting, defining its purpose and outlining various budgeting methods, followed by the preparation of sales, production, raw materials, labor, and overhead budgets. The final task involves variance analysis, calculating budgeted and actual profit, material and labor variances, and preparing an operating statement. A managerial report summarizing the findings concludes the analysis.

Management accounting
1
1
Paraphrase This Document
Need a fresh take? Get an instant paraphrase of this document with our AI Paraphraser
Table of Contents
INTRODUCTION................................................................................................................................3
TASK 1.................................................................................................................................................3
Q1. (A) Classification of the costs into fixed, variable and semi-variable.......................................3
(B) Explaining other ways of costs classification.............................................................................4
Q2. (A) Computing the total costs and unit costs for the production level......................................4
(B) Analyzing costs data using graphical format..............................................................................5
Q3.(1) First-in-First out....................................................................................................................6
(2) Last-in-first out...........................................................................................................................6
(3) Average costs method..................................................................................................................7
Q4. Preparing a report presenting costs of goods sold under different inventory methods..............7
Q5. Indicators to be used for measuring the success........................................................................8
(A) Two critical success factor & KPIs............................................................................................8
(B)(i) Ways to minimize costs..........................................................................................................8
(ii) Strategies to enhance value & quality.........................................................................................8
TASK 2.................................................................................................................................................9
Q6.....................................................................................................................................................9
(A) Budget definition........................................................................................................................9
(B) Purpose of budget.......................................................................................................................9
(C) Different kind of methods for preparation of budget...............................................................10
Q7....................................................................................................................................................11
(A) Sales budget..............................................................................................................................11
(B) Production budget.....................................................................................................................11
(C) Raw material budget.................................................................................................................12
(D) Labour budget..........................................................................................................................12
(E) Total overheads budget.............................................................................................................12
Q8. Cash budget and its analysis....................................................................................................13
TASK 3...............................................................................................................................................14
Q9. (A) Calculation of budgeted profit for the month of March, 2017..........................................14
(B) Calculation of actual profit for the month of March, 2017......................................................14
(C). Calculation of material & labour variances.............................................................................15
(D). Preparation of an operating statement reconciling the targeted and actual results.................16
Q10. Managerial report...................................................................................................................16
CONCLUSION..................................................................................................................................17
REFERENCES...................................................................................................................................18
2
INTRODUCTION
Management accounting is a field or segment of accounting which deals with the
information collection, accounting and reporting it to the management to aware them about the
results of detailed operations in order to make effective plans and decisions in various operational
areas. Smart Looks is a retailing organization that satisfy apparel requirement of the clients by
manufacturing cloths focusing consumer specification. The report emphasize upon costs behaviour,
stock valuation, budgeting planning and controlling and variances analysis in order for making good
decisions for the betterment of the firm.
TASK 1
Q1. (A) Classification of the costs into fixed, variable and semi-variable
In simple words, cost has been defined as a sum of total payments or spending amount made
by the firm to produce a specific quantity of goods & service. Smart Looks manufactures clothing
goods for the users, therefore, it incur expenses on three element, material, labour and overheads.
Costs behaviour, as its name, presents the movement in the spending with the increase or decrease
in the final output, mainly categorized into three types mentioned below:
Variable costs: As name implies, it directly moves in the same direction, in which, total
production moves. It means that if Smart looks produce high quantity of clothing goods to meet
exceeding demand then the total variable costs will also go up or vice-versa (Ryan and et.al., 2017).
For instance, high requirement of direct material and more workers will be require maximizing the
production.
Fixed costs: It is just adverse to previous one which does not fluctuate whether Smart looks
exceed or decrease their total output volume. For instance, depreciation, insurance, rent and others
have no relation with the production volume.
Semi-variable/semi-fixed costs: It is a mixture of both the characteristics of fixed &
variable costs because such expenses do not fluctuates till a certain level and afterwards, it changes
in the same direction of production level (Novák and Popesko, 2014). For instance, electricity and
telephone bill payment, Smart Looks can apply high-low method to find out the fixed & variable
portion in the mixed cost.
With the stated scenario, the cost behaviour of different components has been identified here
as under:
Expenditures Type of cost
Clothing material VC
Rent of the factory FC
3
⊘ This is a preview!⊘
Do you want full access?
Subscribe today to unlock all pages.
Trusted by 1+ million students worldwide
Factory power charged each unit of electricity VC
Supervisors’ wages (Flat plus bonus) Semi-variable
Material for packaging VC
Telephone expense Semi-variable
official rates FC
Payment to driver (Flat rate plus bonus) Semi-variable
Heating FC
(B) Explaining other ways of costs classification
Traceability/chargeability
Direct costs: Expenses which Smart Looks can allocate & assign directly to each unit
produced is called direct costs (DRURY, 2013). For instance, fabric used to make cloth and wages
of the workers who are employed in the production process.
Indirect costs: Unlike above, expenditures incurred on those items which cannot be directly
chargeable to the cloth items manufactured are known as indirect cost i.e. depreciation.
Functions/Activities:
Production/works cost: Expenditures incurred during the manufacturing or production
process are called production cost like production overheads, factory heating & others.
Administration cost: Sum of total payments made for administrating the business functions
are called administrative costs i.e. office stationery, staff salary, printing & other payment (Deegan,
2013).
Selling & distribution cost: All the efforts that are made by Smart looks to maximize their
total turnover are called selling & distribution cost i.e. packaging, marketing, advertisement.
Expenditures Direct and indirect cost Functions/Activities
Clothing material DC WC
Rent of the factory IC WC
Factory power charged each unit of electricity DC WC
Supervisors’ wages (Flat plus bonus) IC WC
Material for packaging DC
Selling and
distribution
Telephone expense IC AC
official rates IC AC
Payment to driver (Flat rate plus bonus) IC AC
Heating IC WC
4
Paraphrase This Document
Need a fresh take? Get an instant paraphrase of this document with our AI Paraphraser
Q2. (A) Computing the total costs and unit costs for the production level
In the field of cost accounting, total costs of production comprises variable costs that vary
according to the production quantity inclusive of fixed costs which are totally independent from the
quantity of goods manufactured by Smart looks (Kaplan and Atkinson, 2015).
Total cost (TC) = Total fixed cost (TFC) + Total variable cost (TVC)
Cost per unit = TC/Number of units produced
Items 15000U 20000U 25000U
VC
Material purchase(£5/unit) £75000 £100000 £125000
Labor’s wages(£6/unit) £90000 £120000 £150000
TVC £165000 £220000 £275000
TFC £50000 £50000 £50000
TC £215000 £270000 £325000
Number of units 15000U 20000U 25000U
Unit cost (TC/Units produced)
£215,000/15,000
= £14.33
£270,000/20,000
= £13.50
£325,000/25,000
= £13.00
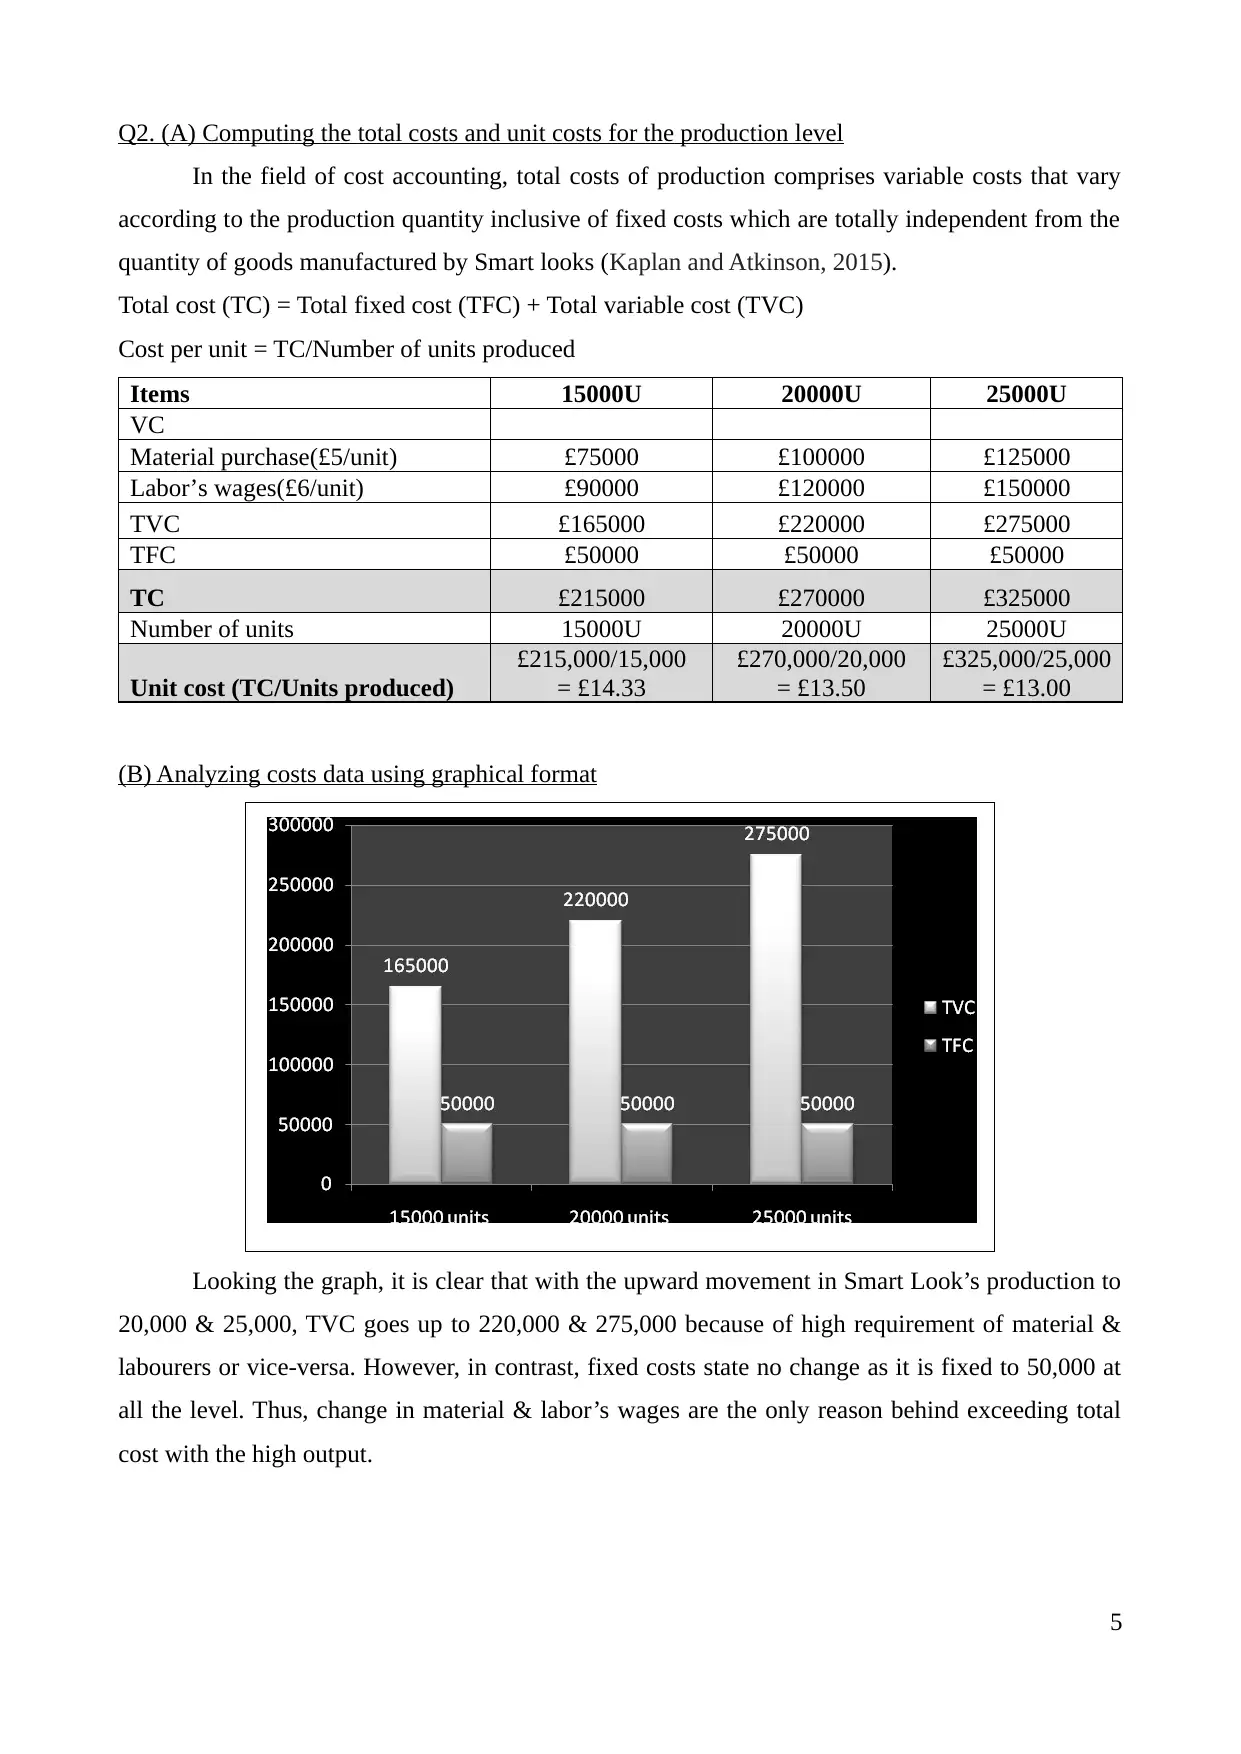
(B) Analyzing costs data using graphical format
Looking the graph, it is clear that with the upward movement in Smart Look’s production to
20,000 & 25,000, TVC goes up to 220,000 & 275,000 because of high requirement of material &
labourers or vice-versa. However, in contrast, fixed costs state no change as it is fixed to 50,000 at
all the level. Thus, change in material & labor’s wages are the only reason behind exceeding total
cost with the high output.
5
In the field of cost accounting, total costs of production comprises variable costs that vary
according to the production quantity inclusive of fixed costs which are totally independent from the
quantity of goods manufactured by Smart looks (Kaplan and Atkinson, 2015).
Total cost (TC) = Total fixed cost (TFC) + Total variable cost (TVC)
Cost per unit = TC/Number of units produced
Items 15000U 20000U 25000U
VC
Material purchase(£5/unit) £75000 £100000 £125000
Labor’s wages(£6/unit) £90000 £120000 £150000
TVC £165000 £220000 £275000
TFC £50000 £50000 £50000
TC £215000 £270000 £325000
Number of units 15000U 20000U 25000U
Unit cost (TC/Units produced)
£215,000/15,000
= £14.33
£270,000/20,000
= £13.50
£325,000/25,000
= £13.00
(B) Analyzing costs data using graphical format
Looking the graph, it is clear that with the upward movement in Smart Look’s production to
20,000 & 25,000, TVC goes up to 220,000 & 275,000 because of high requirement of material &
labourers or vice-versa. However, in contrast, fixed costs state no change as it is fixed to 50,000 at
all the level. Thus, change in material & labor’s wages are the only reason behind exceeding total
cost with the high output.
5
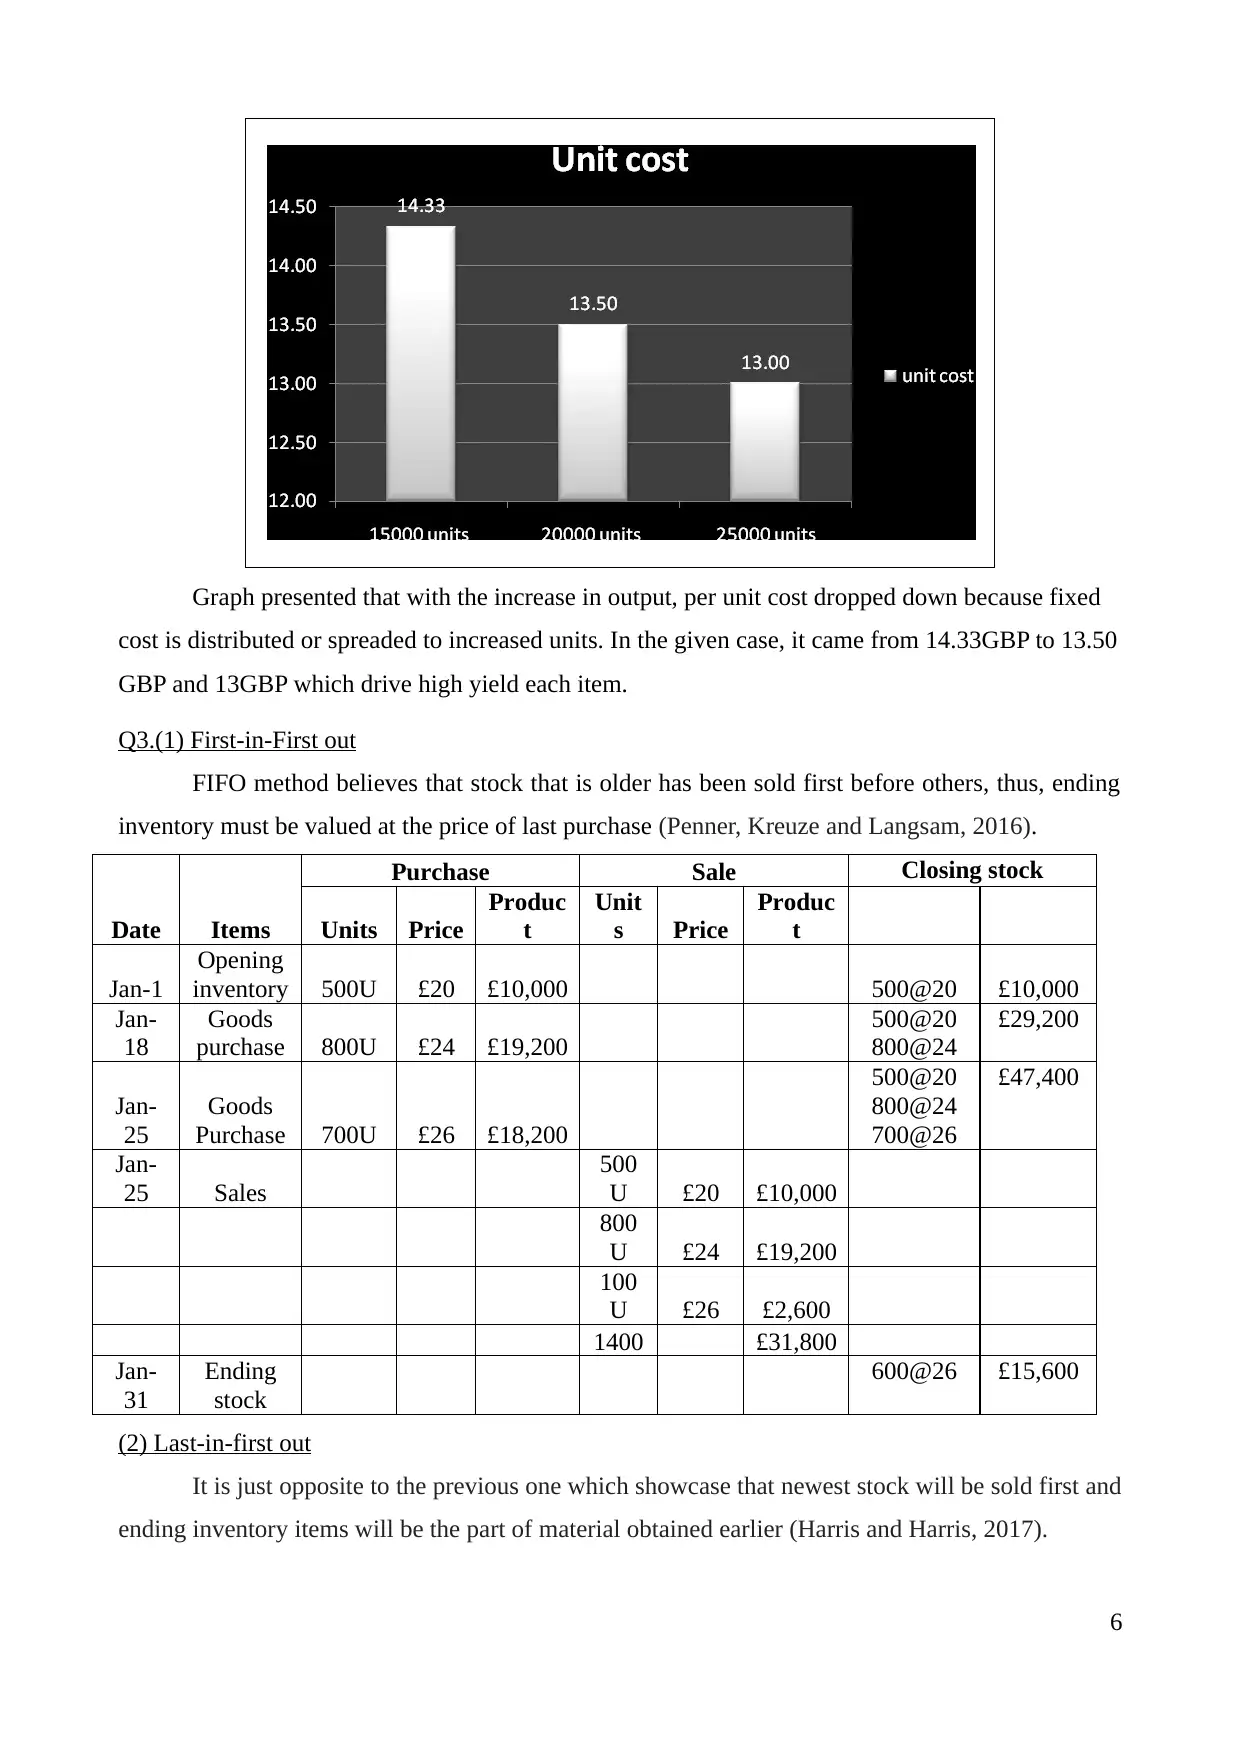
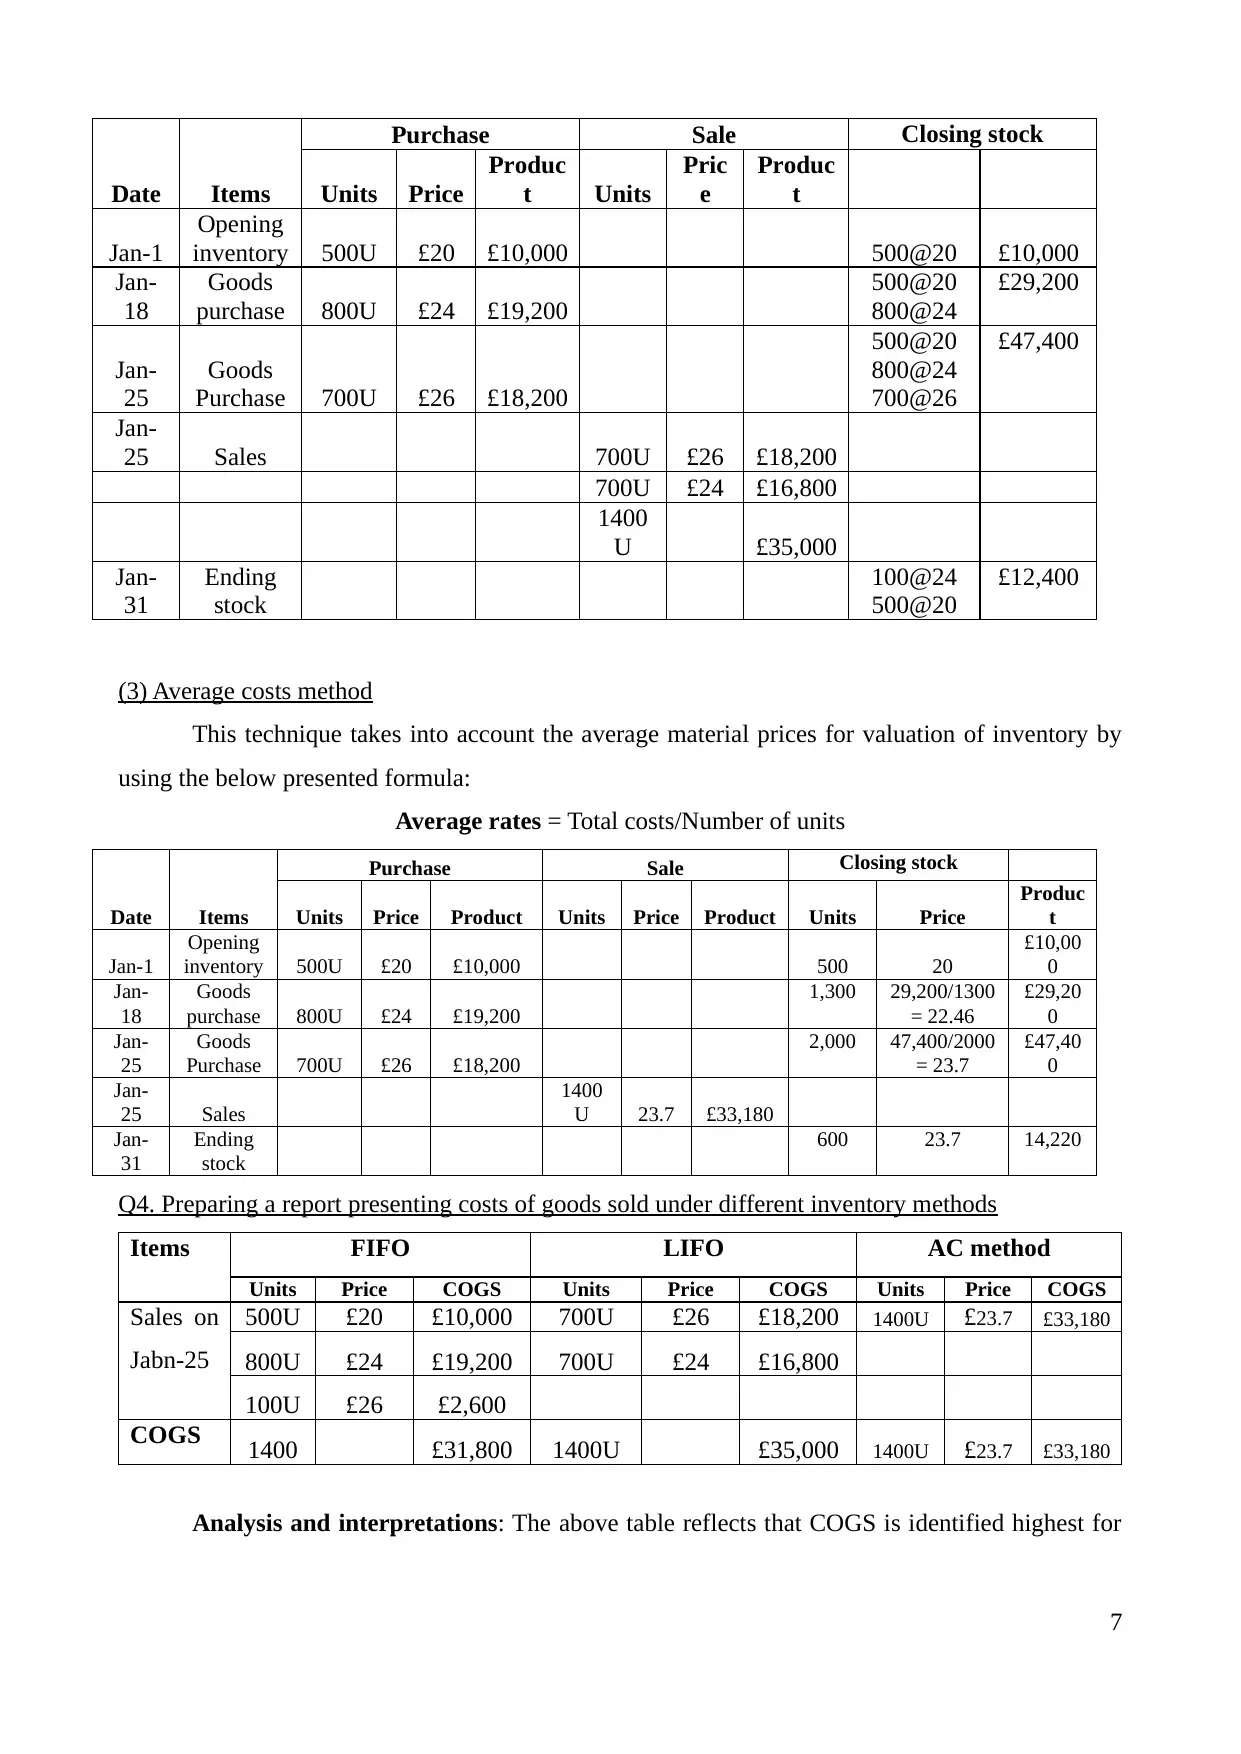
Graph presented that with the increase in output, per unit cost dropped down because fixed
cost is distributed or spreaded to increased units. In the given case, it came from 14.33GBP to 13.50
GBP and 13GBP which drive high yield each item.
Q3.(1) First-in-First out
FIFO method believes that stock that is older has been sold first before others, thus, ending
inventory must be valued at the price of last purchase (Penner, Kreuze and Langsam, 2016).
Date Items
Purchase Sale Closing stock
Units Price
Produc
t
Unit
s Price
Produc
t
Jan-1
Opening
inventory 500U £20 £10,000 500@20 £10,000
Jan-
18
Goods
purchase 800U £24 £19,200
500@20
800@24
£29,200
Jan-
25
Goods
Purchase 700U £26 £18,200
500@20
800@24
700@26
£47,400
Jan-
25 Sales
500
U £20 £10,000
800
U £24 £19,200
100
U £26 £2,600
1400 £31,800
Jan-
31
Ending
stock
600@26 £15,600
(2) Last-in-first out
It is just opposite to the previous one which showcase that newest stock will be sold first and
ending inventory items will be the part of material obtained earlier (Harris and Harris, 2017).
6
⊘ This is a preview!⊘
Do you want full access?
Subscribe today to unlock all pages.
Trusted by 1+ million students worldwide
Date Items
Purchase Sale Closing stock
Units Price
Produc
t Units
Pric
e
Produc
t
Jan-1
Opening
inventory 500U £20 £10,000 500@20 £10,000
Jan-
18
Goods
purchase 800U £24 £19,200
500@20
800@24
£29,200
Jan-
25
Goods
Purchase 700U £26 £18,200
500@20
800@24
700@26
£47,400
Jan-
25 Sales 700U £26 £18,200
700U £24 £16,800
1400
U £35,000
Jan-
31
Ending
stock
100@24
500@20
£12,400
(3) Average costs method
This technique takes into account the average material prices for valuation of inventory by
using the below presented formula:
Average rates = Total costs/Number of units
Date Items
Purchase Sale Closing stock
Units Price Product Units Price Product Units Price
Produc
t
Jan-1
Opening
inventory 500U £20 £10,000 500 20
£10,00
0
Jan-
18
Goods
purchase 800U £24 £19,200
1,300 29,200/1300
= 22.46
£29,20
0
Jan-
25
Goods
Purchase 700U £26 £18,200
2,000 47,400/2000
= 23.7
£47,40
0
Jan-
25 Sales
1400
U 23.7 £33,180
Jan-
31
Ending
stock
600 23.7 14,220
Q4. Preparing a report presenting costs of goods sold under different inventory methods
Items FIFO LIFO AC method
Units Price COGS Units Price COGS Units Price COGS
Sales on
Jabn-25
500U £20 £10,000 700U £26 £18,200 1400U £23.7 £33,180
800U £24 £19,200 700U £24 £16,800
100U £26 £2,600
COGS 1400 £31,800 1400U £35,000 1400U £23.7 £33,180
Analysis and interpretations: The above table reflects that COGS is identified highest for
7
Purchase Sale Closing stock
Units Price
Produc
t Units
Pric
e
Produc
t
Jan-1
Opening
inventory 500U £20 £10,000 500@20 £10,000
Jan-
18
Goods
purchase 800U £24 £19,200
500@20
800@24
£29,200
Jan-
25
Goods
Purchase 700U £26 £18,200
500@20
800@24
700@26
£47,400
Jan-
25 Sales 700U £26 £18,200
700U £24 £16,800
1400
U £35,000
Jan-
31
Ending
stock
100@24
500@20
£12,400
(3) Average costs method
This technique takes into account the average material prices for valuation of inventory by
using the below presented formula:
Average rates = Total costs/Number of units
Date Items
Purchase Sale Closing stock
Units Price Product Units Price Product Units Price
Produc
t
Jan-1
Opening
inventory 500U £20 £10,000 500 20
£10,00
0
Jan-
18
Goods
purchase 800U £24 £19,200
1,300 29,200/1300
= 22.46
£29,20
0
Jan-
25
Goods
Purchase 700U £26 £18,200
2,000 47,400/2000
= 23.7
£47,40
0
Jan-
25 Sales
1400
U 23.7 £33,180
Jan-
31
Ending
stock
600 23.7 14,220
Q4. Preparing a report presenting costs of goods sold under different inventory methods
Items FIFO LIFO AC method
Units Price COGS Units Price COGS Units Price COGS
Sales on
Jabn-25
500U £20 £10,000 700U £26 £18,200 1400U £23.7 £33,180
800U £24 £19,200 700U £24 £16,800
100U £26 £2,600
COGS 1400 £31,800 1400U £35,000 1400U £23.7 £33,180
Analysis and interpretations: The above table reflects that COGS is identified highest for
7
Paraphrase This Document
Need a fresh take? Get an instant paraphrase of this document with our AI Paraphraser
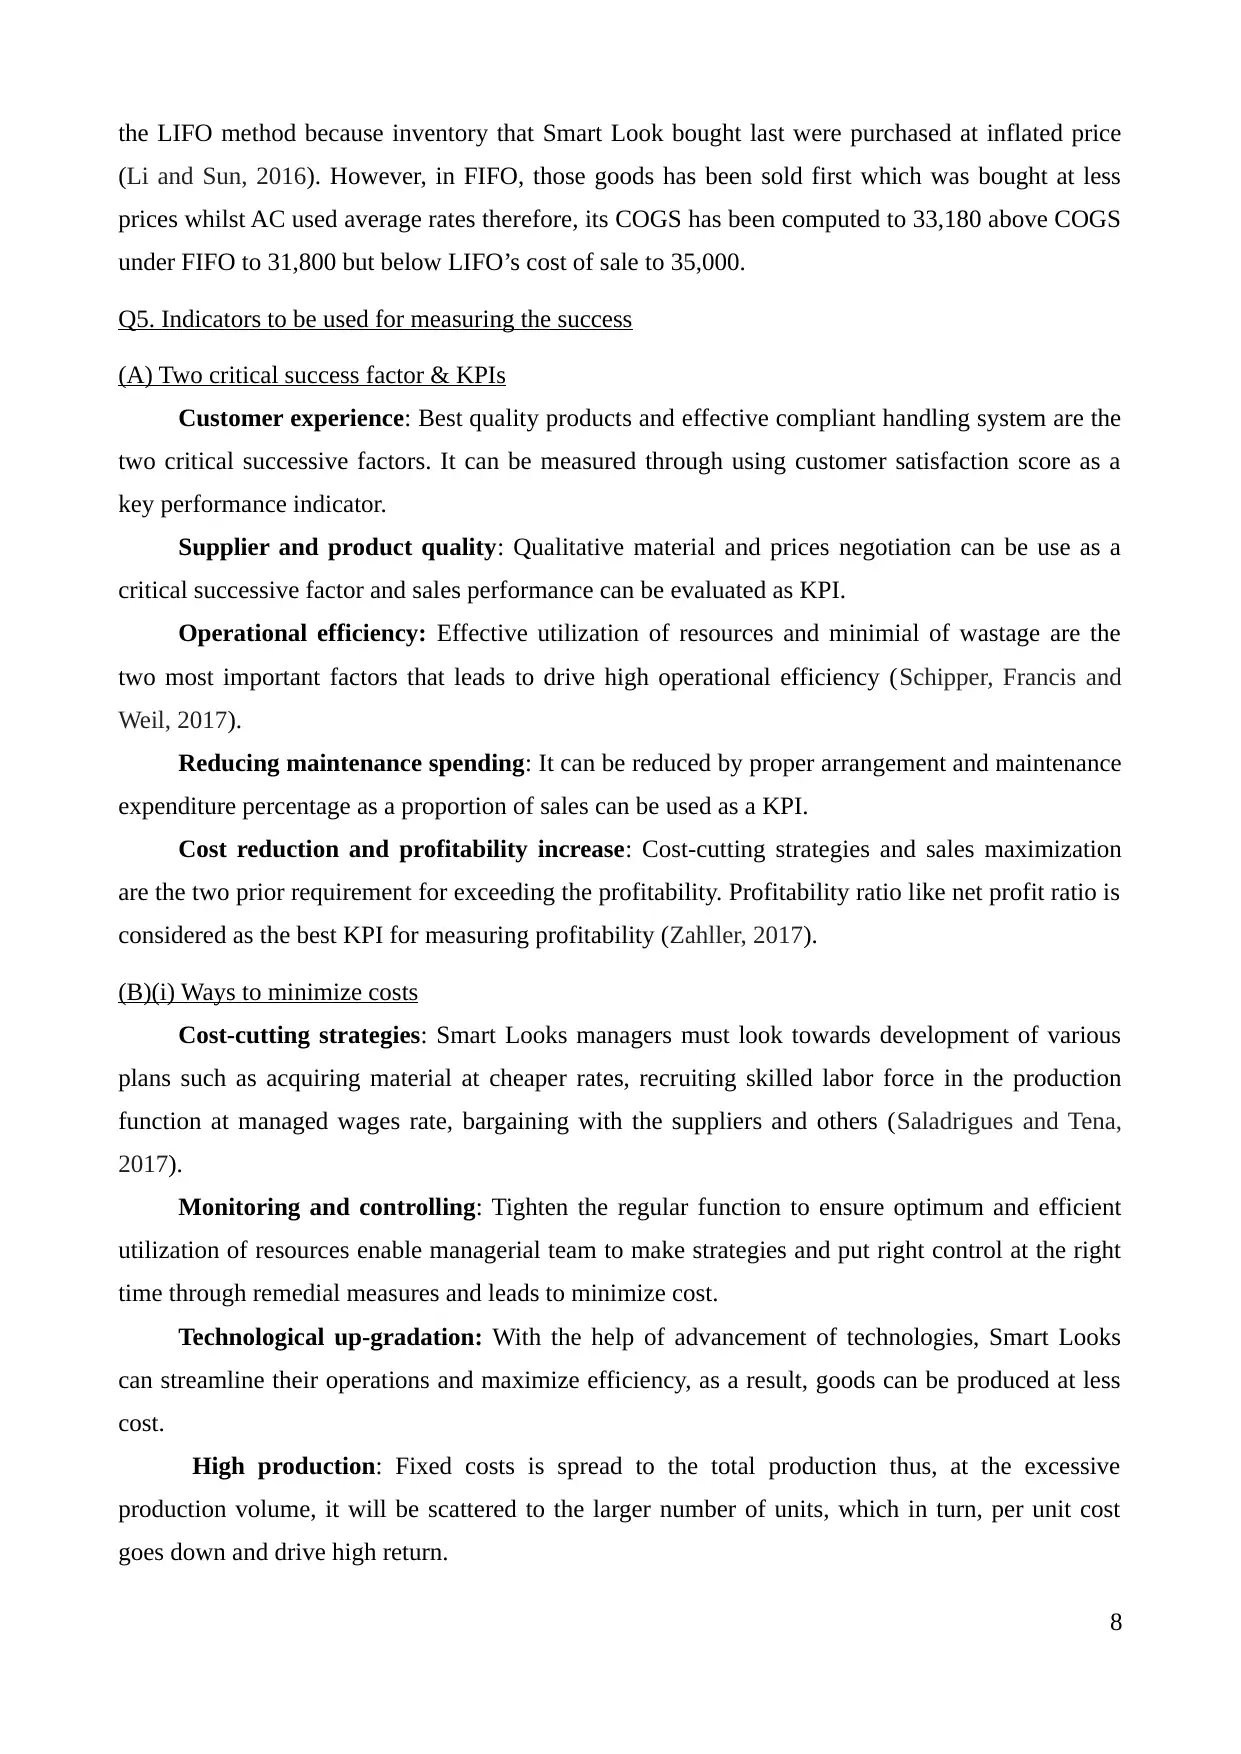
the LIFO method because inventory that Smart Look bought last were purchased at inflated price
(Li and Sun, 2016). However, in FIFO, those goods has been sold first which was bought at less
prices whilst AC used average rates therefore, its COGS has been computed to 33,180 above COGS
under FIFO to 31,800 but below LIFO’s cost of sale to 35,000.
Q5. Indicators to be used for measuring the success
(A) Two critical success factor & KPIs
Customer experience: Best quality products and effective compliant handling system are the
two critical successive factors. It can be measured through using customer satisfaction score as a
key performance indicator.
Supplier and product quality: Qualitative material and prices negotiation can be use as a
critical successive factor and sales performance can be evaluated as KPI.
Operational efficiency: Effective utilization of resources and minimial of wastage are the
two most important factors that leads to drive high operational efficiency (Schipper, Francis and
Weil, 2017).
Reducing maintenance spending: It can be reduced by proper arrangement and maintenance
expenditure percentage as a proportion of sales can be used as a KPI.
Cost reduction and profitability increase: Cost-cutting strategies and sales maximization
are the two prior requirement for exceeding the profitability. Profitability ratio like net profit ratio is
considered as the best KPI for measuring profitability (Zahller, 2017).
(B)(i) Ways to minimize costs
Cost-cutting strategies: Smart Looks managers must look towards development of various
plans such as acquiring material at cheaper rates, recruiting skilled labor force in the production
function at managed wages rate, bargaining with the suppliers and others (Saladrigues and Tena,
2017).
Monitoring and controlling: Tighten the regular function to ensure optimum and efficient
utilization of resources enable managerial team to make strategies and put right control at the right
time through remedial measures and leads to minimize cost.
Technological up-gradation: With the help of advancement of technologies, Smart Looks
can streamline their operations and maximize efficiency, as a result, goods can be produced at less
cost.
High production: Fixed costs is spread to the total production thus, at the excessive
production volume, it will be scattered to the larger number of units, which in turn, per unit cost
goes down and drive high return.
8
(ii) Strategies to enhance value & quality
Quality management techniques: The best way to improve quality is to use quality
management and assurance technique like total quality management, lean operations, six sigma and
others, so that, qualitative goods can be produced (Houtson, 2014).
Wealth maximization: Value can be improved by generating larger return to maximize
wealth for the shareholders. In this regards, Smart Looks’s managerial team must find out unique
ways to maximize revenues and control costs for generating larger return and satisfy the investors.
Competitive advantage: Superior quality clothing goods in attractive designs at an
affordable rates drive millennial consumer base and satisfy customers to a great extent. It drive in
competitive edge over the rivalries and assists firm to effectively run their operations without any
fear of competitive pressure (Zahller, 2017).
Market share: High consumer base leads to drive excessive sales and maximize the market
share. With the help of this, Smart Look will be able to reach their targets successfully.
TASK 2
Q6.
(A) Budget definition
Budgeting is one of the crucial and important aspects of managerial planning & decisions,
under which, Smart look’s managers forecasts the potential results of future course of actions (de
Campos and Rodrigues, 2016). Budgetary planning is a managerial tool which quantitatively
presents possible results of future operations in the form of revenue and expenditures which is
helpful in resource allocation and better corporate planning for the success.
(B) Purpose of budget
Budget is mainly constructed to attain the following aims and objectives, stated hereunder:
Forecasting: The key objective behind preparing budget is that it assists Smart Looks in
projecting the results of potential operations i.e. income that is expected to generate in future and
expenditures that it will incur to carry out their operations.
Decision-making tool: It provides a framework to take proposed course of remedial
measures for maximizing revenues, control cost and improve operational efficiency (Rubin, 2016).
Performance monitoring & controlling: In this, actual results are measured or compared
against the forecasted figures to figure out variances which allow Smart Looks directors to frame
policies and decisions to mitigate adverse results. Moreover, it also assists managerial team in
putting control over their day-to-day functions by making rationalized cost curtailment strategies
9
⊘ This is a preview!⊘
Do you want full access?
Subscribe today to unlock all pages.
Trusted by 1+ million students worldwide
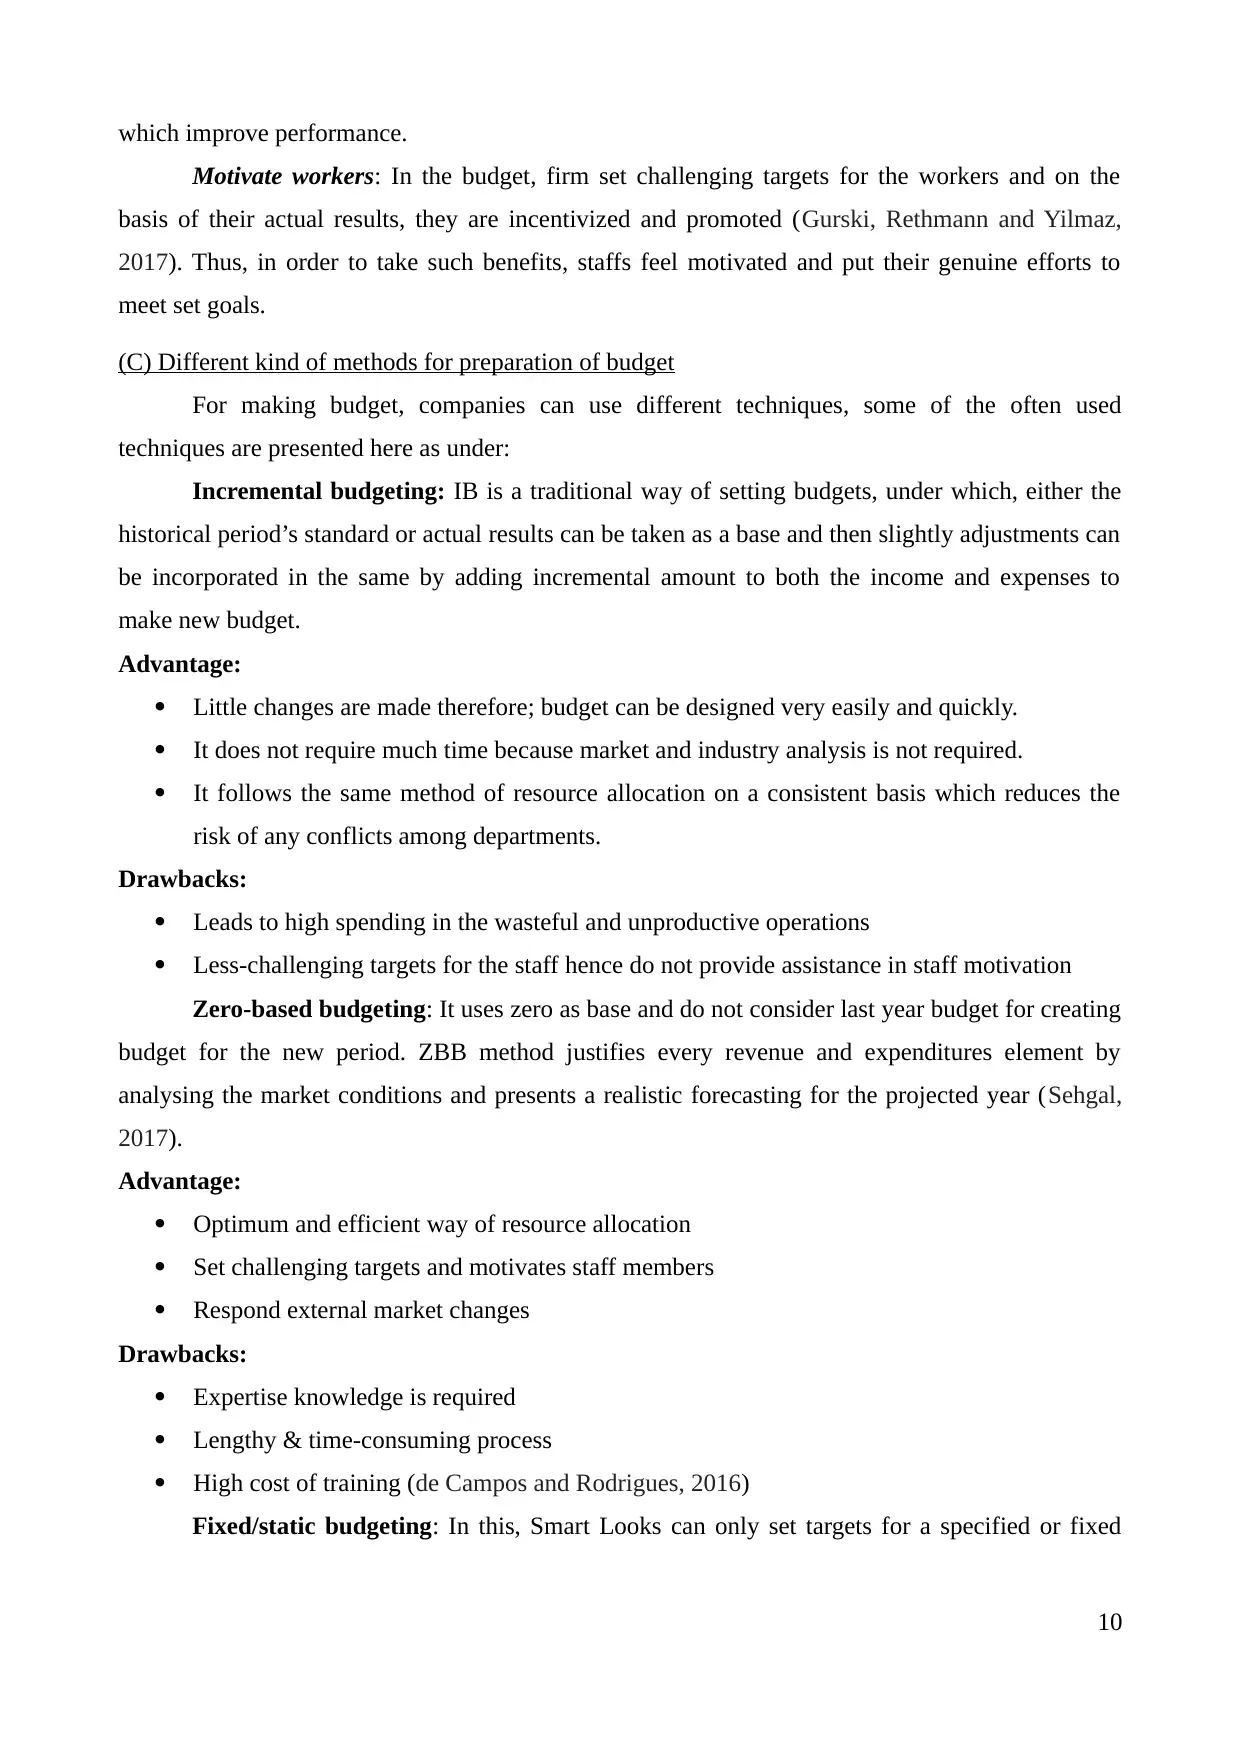
which improve performance.
Motivate workers: In the budget, firm set challenging targets for the workers and on the
basis of their actual results, they are incentivized and promoted (Gurski, Rethmann and Yilmaz,
2017). Thus, in order to take such benefits, staffs feel motivated and put their genuine efforts to
meet set goals.
(C) Different kind of methods for preparation of budget
For making budget, companies can use different techniques, some of the often used
techniques are presented here as under:
Incremental budgeting: IB is a traditional way of setting budgets, under which, either the
historical period’s standard or actual results can be taken as a base and then slightly adjustments can
be incorporated in the same by adding incremental amount to both the income and expenses to
make new budget.
Advantage:
Little changes are made therefore; budget can be designed very easily and quickly.
It does not require much time because market and industry analysis is not required.
It follows the same method of resource allocation on a consistent basis which reduces the
risk of any conflicts among departments.
Drawbacks:
Leads to high spending in the wasteful and unproductive operations
Less-challenging targets for the staff hence do not provide assistance in staff motivation
Zero-based budgeting: It uses zero as base and do not consider last year budget for creating
budget for the new period. ZBB method justifies every revenue and expenditures element by
analysing the market conditions and presents a realistic forecasting for the projected year (Sehgal,
2017).
Advantage:
Optimum and efficient way of resource allocation
Set challenging targets and motivates staff members
Respond external market changes
Drawbacks:
Expertise knowledge is required
Lengthy & time-consuming process
High cost of training (de Campos and Rodrigues, 2016)
Fixed/static budgeting: In this, Smart Looks can only set targets for a specified or fixed
10
Paraphrase This Document
Need a fresh take? Get an instant paraphrase of this document with our AI Paraphraser
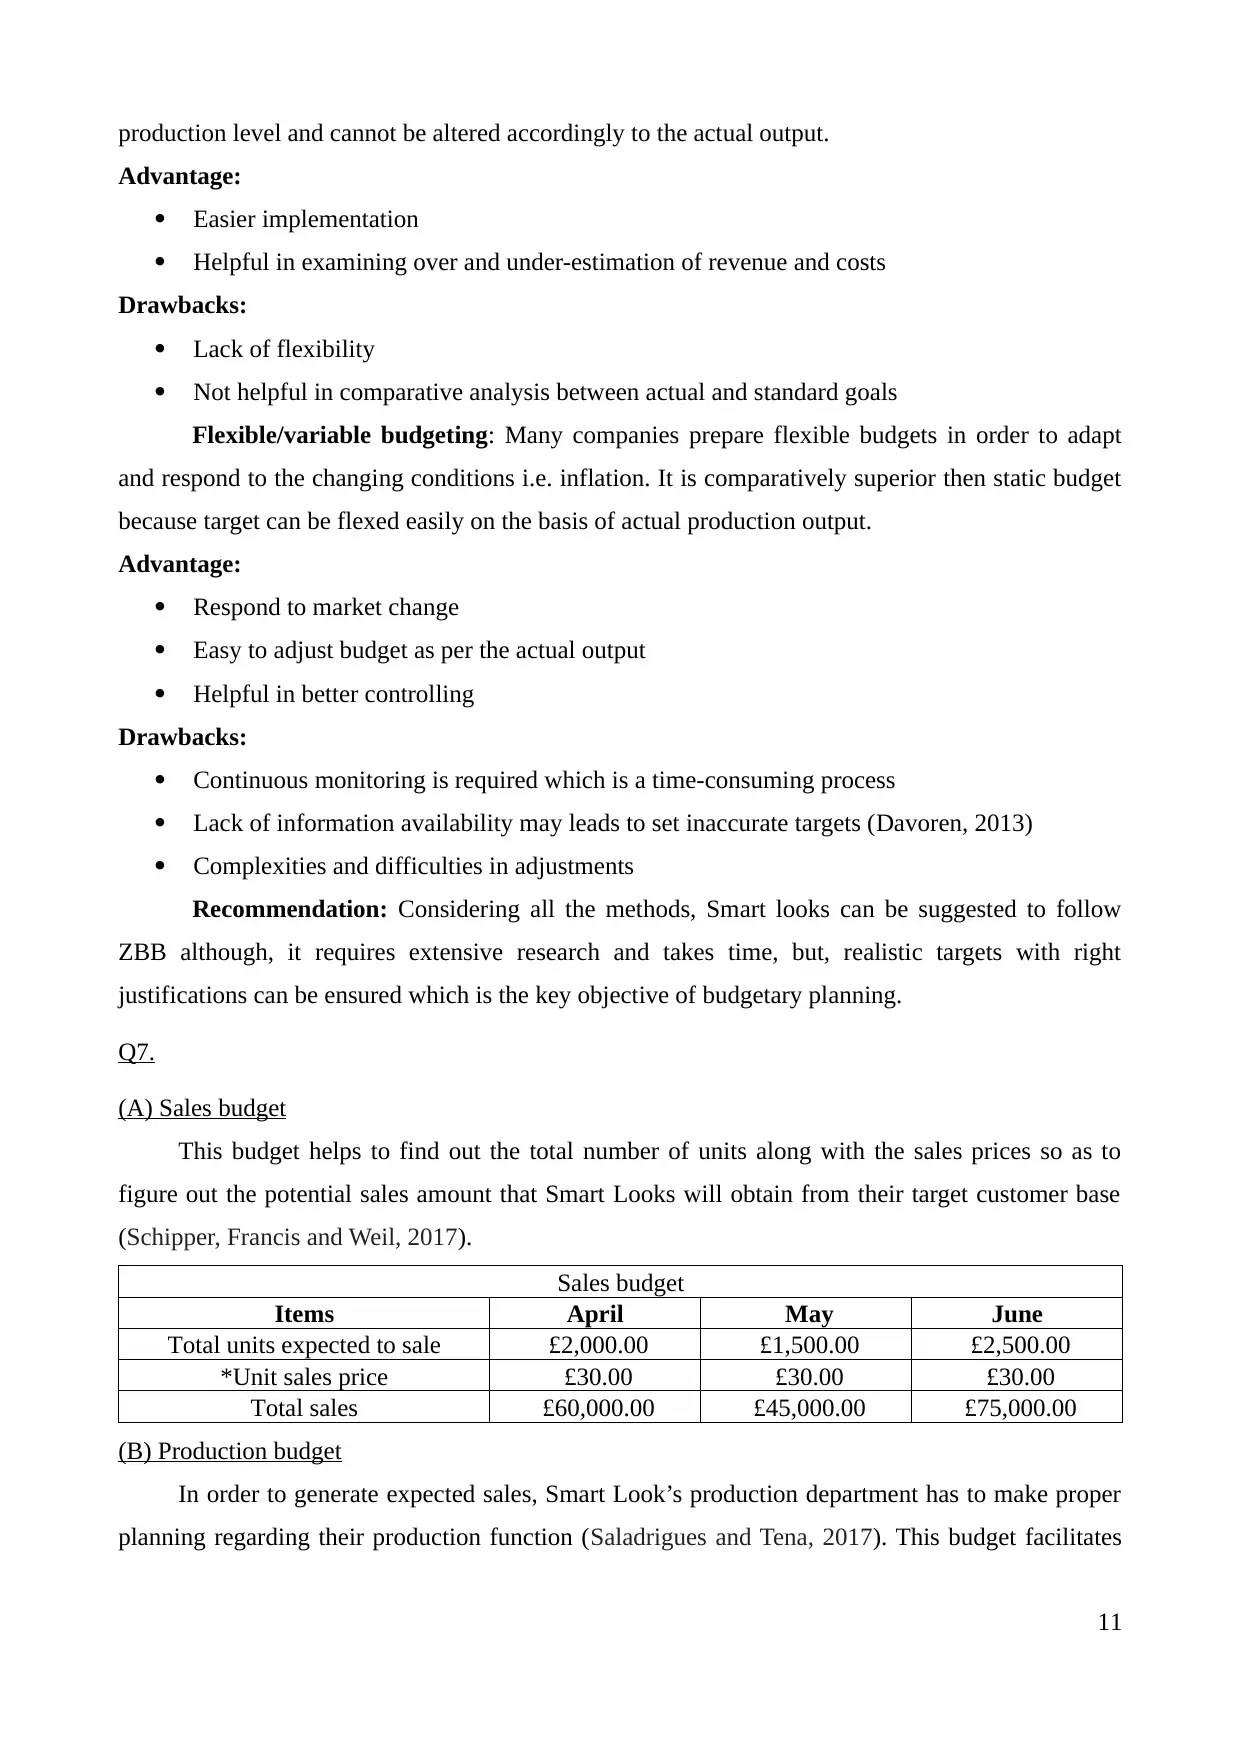
production level and cannot be altered accordingly to the actual output.
Advantage:
Easier implementation
Helpful in examining over and under-estimation of revenue and costs
Drawbacks:
Lack of flexibility
Not helpful in comparative analysis between actual and standard goals
Flexible/variable budgeting: Many companies prepare flexible budgets in order to adapt
and respond to the changing conditions i.e. inflation. It is comparatively superior then static budget
because target can be flexed easily on the basis of actual production output.
Advantage:
Respond to market change
Easy to adjust budget as per the actual output
Helpful in better controlling
Drawbacks:
Continuous monitoring is required which is a time-consuming process
Lack of information availability may leads to set inaccurate targets (Davoren, 2013)
Complexities and difficulties in adjustments
Recommendation: Considering all the methods, Smart looks can be suggested to follow
ZBB although, it requires extensive research and takes time, but, realistic targets with right
justifications can be ensured which is the key objective of budgetary planning.
Q7.
(A) Sales budget
This budget helps to find out the total number of units along with the sales prices so as to
figure out the potential sales amount that Smart Looks will obtain from their target customer base
(Schipper, Francis and Weil, 2017).
Sales budget
Items April May June
Total units expected to sale £2,000.00 £1,500.00 £2,500.00
*Unit sales price £30.00 £30.00 £30.00
Total sales £60,000.00 £45,000.00 £75,000.00
(B) Production budget
In order to generate expected sales, Smart Look’s production department has to make proper
planning regarding their production function (Saladrigues and Tena, 2017). This budget facilitates
11
Advantage:
Easier implementation
Helpful in examining over and under-estimation of revenue and costs
Drawbacks:
Lack of flexibility
Not helpful in comparative analysis between actual and standard goals
Flexible/variable budgeting: Many companies prepare flexible budgets in order to adapt
and respond to the changing conditions i.e. inflation. It is comparatively superior then static budget
because target can be flexed easily on the basis of actual production output.
Advantage:
Respond to market change
Easy to adjust budget as per the actual output
Helpful in better controlling
Drawbacks:
Continuous monitoring is required which is a time-consuming process
Lack of information availability may leads to set inaccurate targets (Davoren, 2013)
Complexities and difficulties in adjustments
Recommendation: Considering all the methods, Smart looks can be suggested to follow
ZBB although, it requires extensive research and takes time, but, realistic targets with right
justifications can be ensured which is the key objective of budgetary planning.
Q7.
(A) Sales budget
This budget helps to find out the total number of units along with the sales prices so as to
figure out the potential sales amount that Smart Looks will obtain from their target customer base
(Schipper, Francis and Weil, 2017).
Sales budget
Items April May June
Total units expected to sale £2,000.00 £1,500.00 £2,500.00
*Unit sales price £30.00 £30.00 £30.00
Total sales £60,000.00 £45,000.00 £75,000.00
(B) Production budget
In order to generate expected sales, Smart Look’s production department has to make proper
planning regarding their production function (Saladrigues and Tena, 2017). This budget facilitates
11
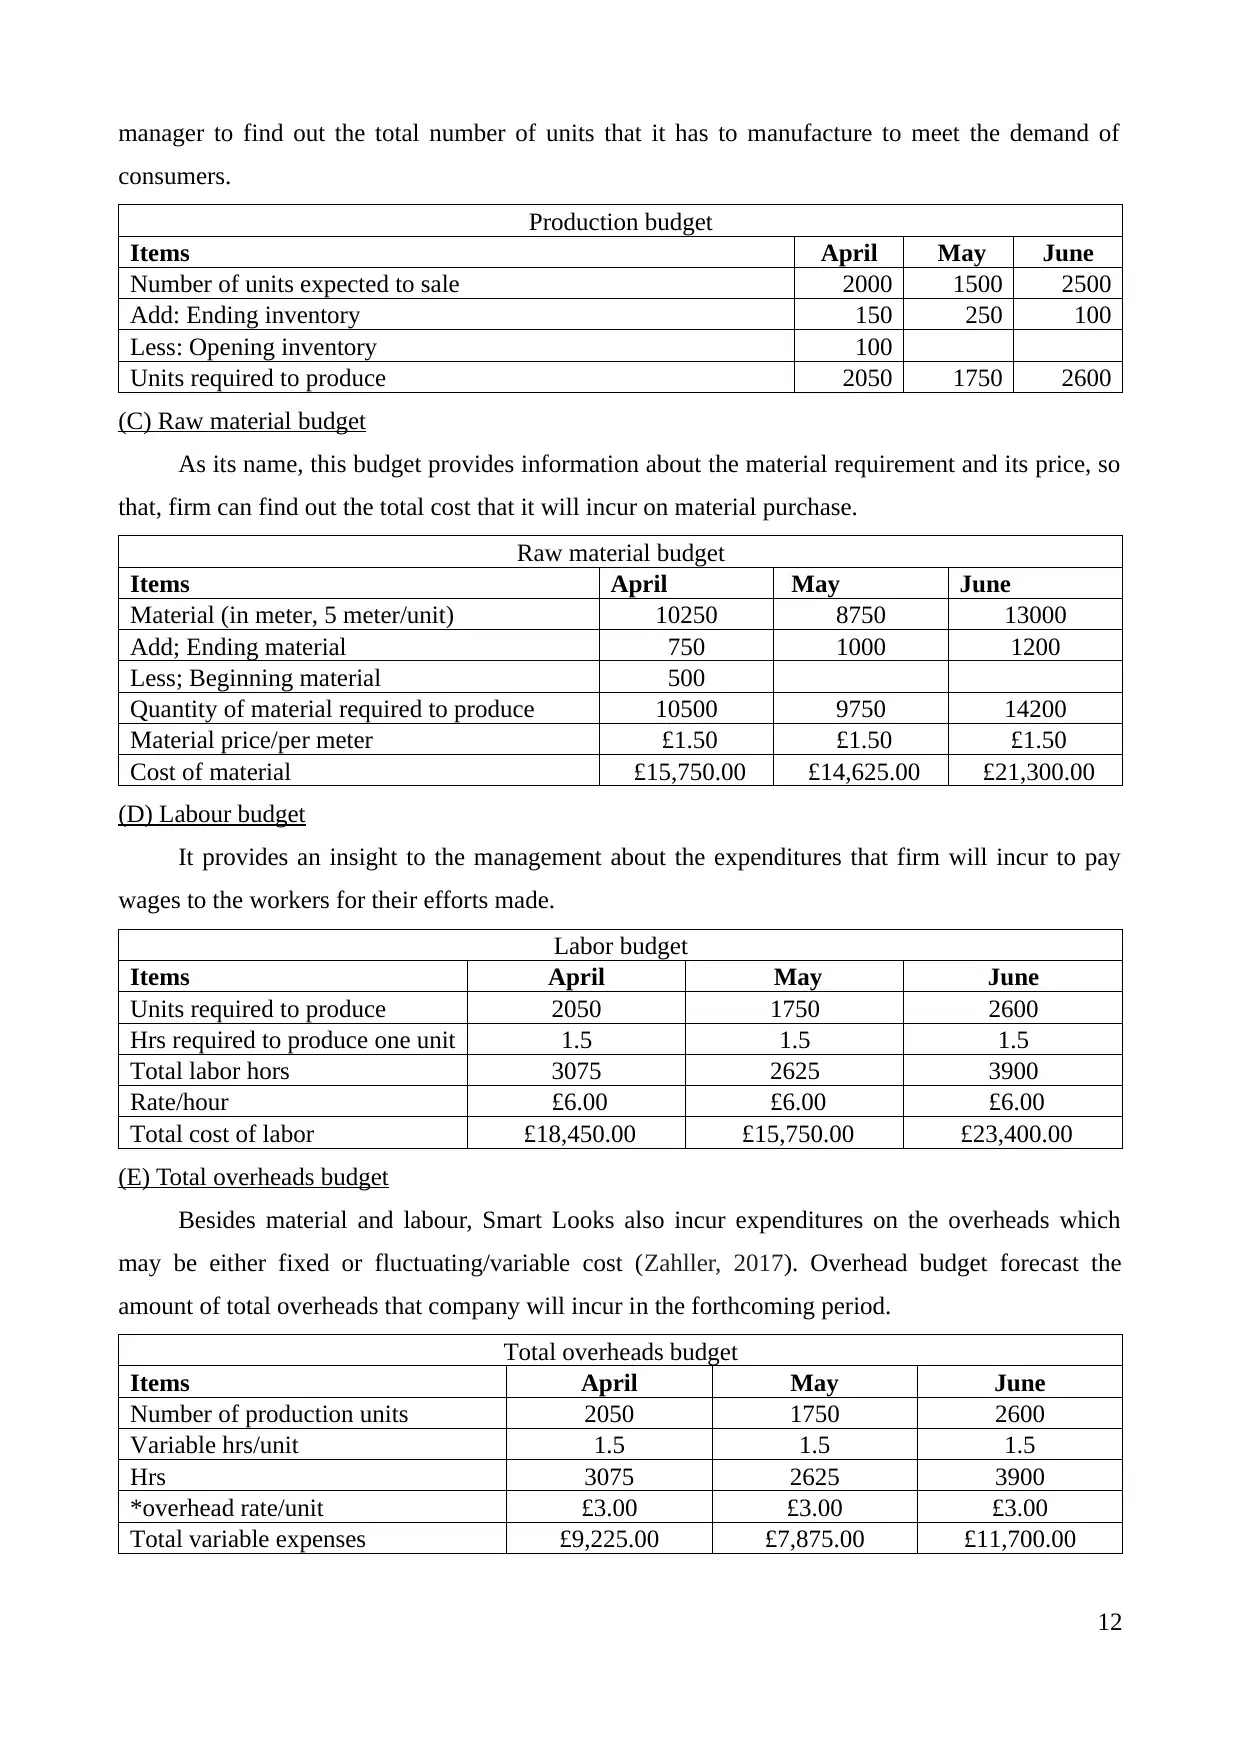
manager to find out the total number of units that it has to manufacture to meet the demand of
consumers.
Production budget
Items April May June
Number of units expected to sale 2000 1500 2500
Add: Ending inventory 150 250 100
Less: Opening inventory 100
Units required to produce 2050 1750 2600
(C) Raw material budget
As its name, this budget provides information about the material requirement and its price, so
that, firm can find out the total cost that it will incur on material purchase.
Raw material budget
Items April May June
Material (in meter, 5 meter/unit) 10250 8750 13000
Add; Ending material 750 1000 1200
Less; Beginning material 500
Quantity of material required to produce 10500 9750 14200
Material price/per meter £1.50 £1.50 £1.50
Cost of material £15,750.00 £14,625.00 £21,300.00
(D) Labour budget
It provides an insight to the management about the expenditures that firm will incur to pay
wages to the workers for their efforts made.
Labor budget
Items April May June
Units required to produce 2050 1750 2600
Hrs required to produce one unit 1.5 1.5 1.5
Total labor hors 3075 2625 3900
Rate/hour £6.00 £6.00 £6.00
Total cost of labor £18,450.00 £15,750.00 £23,400.00
(E) Total overheads budget
Besides material and labour, Smart Looks also incur expenditures on the overheads which
may be either fixed or fluctuating/variable cost (Zahller, 2017). Overhead budget forecast the
amount of total overheads that company will incur in the forthcoming period.
Total overheads budget
Items April May June
Number of production units 2050 1750 2600
Variable hrs/unit 1.5 1.5 1.5
Hrs 3075 2625 3900
*overhead rate/unit £3.00 £3.00 £3.00
Total variable expenses £9,225.00 £7,875.00 £11,700.00
12
⊘ This is a preview!⊘
Do you want full access?
Subscribe today to unlock all pages.
Trusted by 1+ million students worldwide
1 out of 19
Related Documents


Your All-in-One AI-Powered Toolkit for Academic Success.
+13062052269
info@desklib.com
Available 24*7 on WhatsApp / Email
![[object Object]](/_next/static/media/star-bottom.7253800d.svg)
Unlock your academic potential
Copyright © 2020–2026 A2Z Services. All Rights Reserved. Developed and managed by ZUCOL.