Internal Reporting, Costing Systems, and Revenue Analysis Report
VerifiedAdded on 2020/12/09
|20
|4174
|114
Report
AI Summary
This report provides a comprehensive analysis of costs and revenues within the context of J.P. Morgon. It begins by outlining the purpose of internal reporting and its significance in providing accurate information to management. The report then explores the relationships between various costing systems, including marginal and absorption costing, and identifies different responsibility centers within an organization. It delves into cost classification, inventory valuation methods (FIFO), and the behavior of costs. Furthermore, the report examines overhead costs, absorption rates, and variance analysis, including methods of allocation and apportionment. It also addresses the estimation of future income and costs for decision-making, the impact of changing activity levels on unit costs, and factors affecting short-term and long-term decision-making processes. The report concludes with a detailed cost sheet, and relevant calculations, providing insights into the financial performance and cost management strategies of the company.
COSTS AND REVENUES
Paraphrase This Document
Need a fresh take? Get an instant paraphrase of this document with our AI Paraphraser
Table of Contents
INTRODUCTION...........................................................................................................................1
1........................................................................................................................................................1
1.1 Purpose of internal reporting and providing accurate information to management..............1
1.2 Relationship between various costing system.......................................................................1
1.3 Identifying responsibility centre, cost centre, profit centre and investment centre within
the organisation...........................................................................................................................2
1.4 Characteristics of various types of cost classification and their use in costing.....................2
1.5 Difference between marginal and absorption costing...........................................................3
2........................................................................................................................................................4
2.1 Recording Cost information of the organisation...................................................................4
2.2 Analysing cost information of the organisation....................................................................5
2.3 Define the various stages of inventory..................................................................................6
2.4 Value inventory using various method.................................................................................6
2.5 Behaviour of these costs........................................................................................................8
2.6 Recording cost information using these costing system.......................................................9
3........................................................................................................................................................9
3.1 Overhead costs to production and services cost centres.......................................................9
3.2 Calculation of overhead absorption rate...............................................................................9
3.3 Adjustment for under and over recovered overhead costs..................................................10
3.4 Methods of allocation, apportionment and absorption........................................................10
3.5 Communicate with relevant staff to resolve queries related to overhead cost data............11
4......................................................................................................................................................11
4.1 Compare budget cost with actual coast ..............................................................................11
4.2 Analyse variances for report...............................................................................................12
4.3 information for budget holder of significance variance .....................................................12
4.4 Management report.............................................................................................................12
5......................................................................................................................................................13
5.1 An estimation of future income and costs for decision making process.............................13
5.2 Effect of changing activities levels on unit cost .................................................................14
5.3 Effect of changing activity levels on unit cost....................................................................14
5.4 factor affecting short term and long term decision making ...............................................14
CONCLUSION..............................................................................................................................15
REFERENCES .............................................................................................................................16
⊘ This is a preview!⊘
Do you want full access?
Subscribe today to unlock all pages.
Trusted by 1+ million students worldwide
INTRODUCTION
Cost and revenue are the major part of any organisation where cost refer to actual amount
on which the good is sale by the organisation and revenue refer to the actual income that has in
the business activity and unit. Purpose of this study is based on J.P. Morgon which is one of the
leading organisation in UK and it is aim to understand the nature of costs and revenues. The
study will record and analyse cost information as well as it will utilise the information collect
from costing system.
1
1.1 Purpose of internal reporting and providing accurate information to management
Internal reporting include the compilation of operational and financial information, that is
distributed to individuals within an organisation to improve their performance ((Arzbächer
Holtgrewe and Kerst, 2017)). The purpose of internal reporting of financial and operational
information is:
Internal reporting give the holistic view of enterprise performance and on which post the
potential new employees are needed that help management to hire accordingly and
manage the employees.
The purpose of internal reporting is to manage data that can be financial or operational
that help management to utilise the financial resources effectively as well as non-
financial resources that improve the work performance of the organisation.
1.2 Relationship between various costing system
J.P. Morgon Co. design costing system to monitor the cost and the system control and
report to management about costs, profitability and revenues. There are various costing system:
Marginal costing- The marginal costing implies the additional cost that involved in
producing an extra unit of output. Marginal cost = Direct labour+ Direct material+Variable
overhead+ Direct expenses.
Standard Costing- Standard costing is a costing method that implemented by J.P.
Morgon Co. to compare standard revenues and standard costs with actual result, this system
include cost layering system such as; FIFO and LIFO method.
Absorption costing- This costing method absorb all the manufacturing cost including
fixed and variable cost.
1
Paraphrase This Document
Need a fresh take? Get an instant paraphrase of this document with our AI Paraphraser
Historical costing- In this system the cost are determined in actual cost and not
predetermined standard cost (Bayer, 2018).
Relation between these costing system
In perfect competition market AR = MR.
In imperfect competition market AR> MR.
1.3 Identifying responsibility centre, cost centre, profit centre and investment centre within the
organisation
Responsibility centre- This centre is headed by a manager in the J.P. Morgon Co. that is
responsible for all its activities and performance. All the information about cost and revenue are
gathered and reported in responsibility accounting by responsibility centre. There are three types
of responsibility centre; Cost, Profit and Investment centre.
Cost Centre- The cost centre is a department in J.P. Morgon Co. that is responsible for
allocating cost and contributes profitability of industry indirectly. It includes two type of
cost centre; production cost centre and Service cost centre. The department include in this
centre are; marketing department, HR, R&D department, etc.
Profit Centre- Profit centre is responsible for both cost and revenue. Aim of profit centre
is to earn profit and mangers of profit centre aim at marketing and production of the
product both (Dudin and et.al., 2015). It includes production and sales/marketing
department.
Investment Centre- This centre is responsible for profit and investment both. Manager
of investment centre formulates the credit policies that drive debt collection and has
control over expenditures, revenues and invested amount in the centre's assets.
Investment centre of the J.P. Morgon Co. have more responsibility and authority than
cost or profit centre.
1.4 Characteristics of various types of cost classification and their use in costing
Cost can be classified as follows and each type of cost have different characteristics and
their use in costing are different:
Classification on the basis of management function
Manufacturing Cost
This cost incurred in the organisation to convert raw material into finished goods. It
includes raw material cost, direct labour cost and factory cost. Manufacturing cost can be either
2

fixed or variable (Gallemore and Labro, 2015). In costing, this cost include depreciation, indirect
material and labour cost.
Non-Manufacturing Cost
Non-manufacturing cost are not calculated into cost of good sold. This cost include in
costing to analysing selling expenses, administrative expenses that incurred after the final
production.
Classification of cost by behaviour
Variable Cost
Variable cost varies as a result of change in production level, the variability of total
amount in direct portion to volume. Variable cost use in costing as by dividing sale per unit and
add up direct material and direct labour to it.
Fixed Cost
Fixed cost are those cost that remain same and constant and do not change at any level of
activity and output. They have control in many cases within the organisation with executive
management rather than operating supervisor.
Semi-Variable Cost
This type of cost has characteristics of both fixed and variable cost.
Classification of cost by nature
Direct Cost
This type of cost are direct accountable to particular object of costing such as; department
or product (Netten and Beecham, eds., 2018). It can be easily traced and computed and it is used
in costing to evaluate all the cost that are direct attached to the organisation such as; direct
labour, direct material, etc.
Indirect Cost
This type of cost are those that are not directly accountable to a cost object; it can be
either fixed or variable. It cannot be traced and identified easily. Indirect cost use in costing as
calculating office and administrative expenses, etc.
1.5 Difference between marginal and absorption costing
Marginal costing Absorption costing
Marginal costing is defined as a Absorption costing defined as allotment
3
⊘ This is a preview!⊘
Do you want full access?
Subscribe today to unlock all pages.
Trusted by 1+ million students worldwide
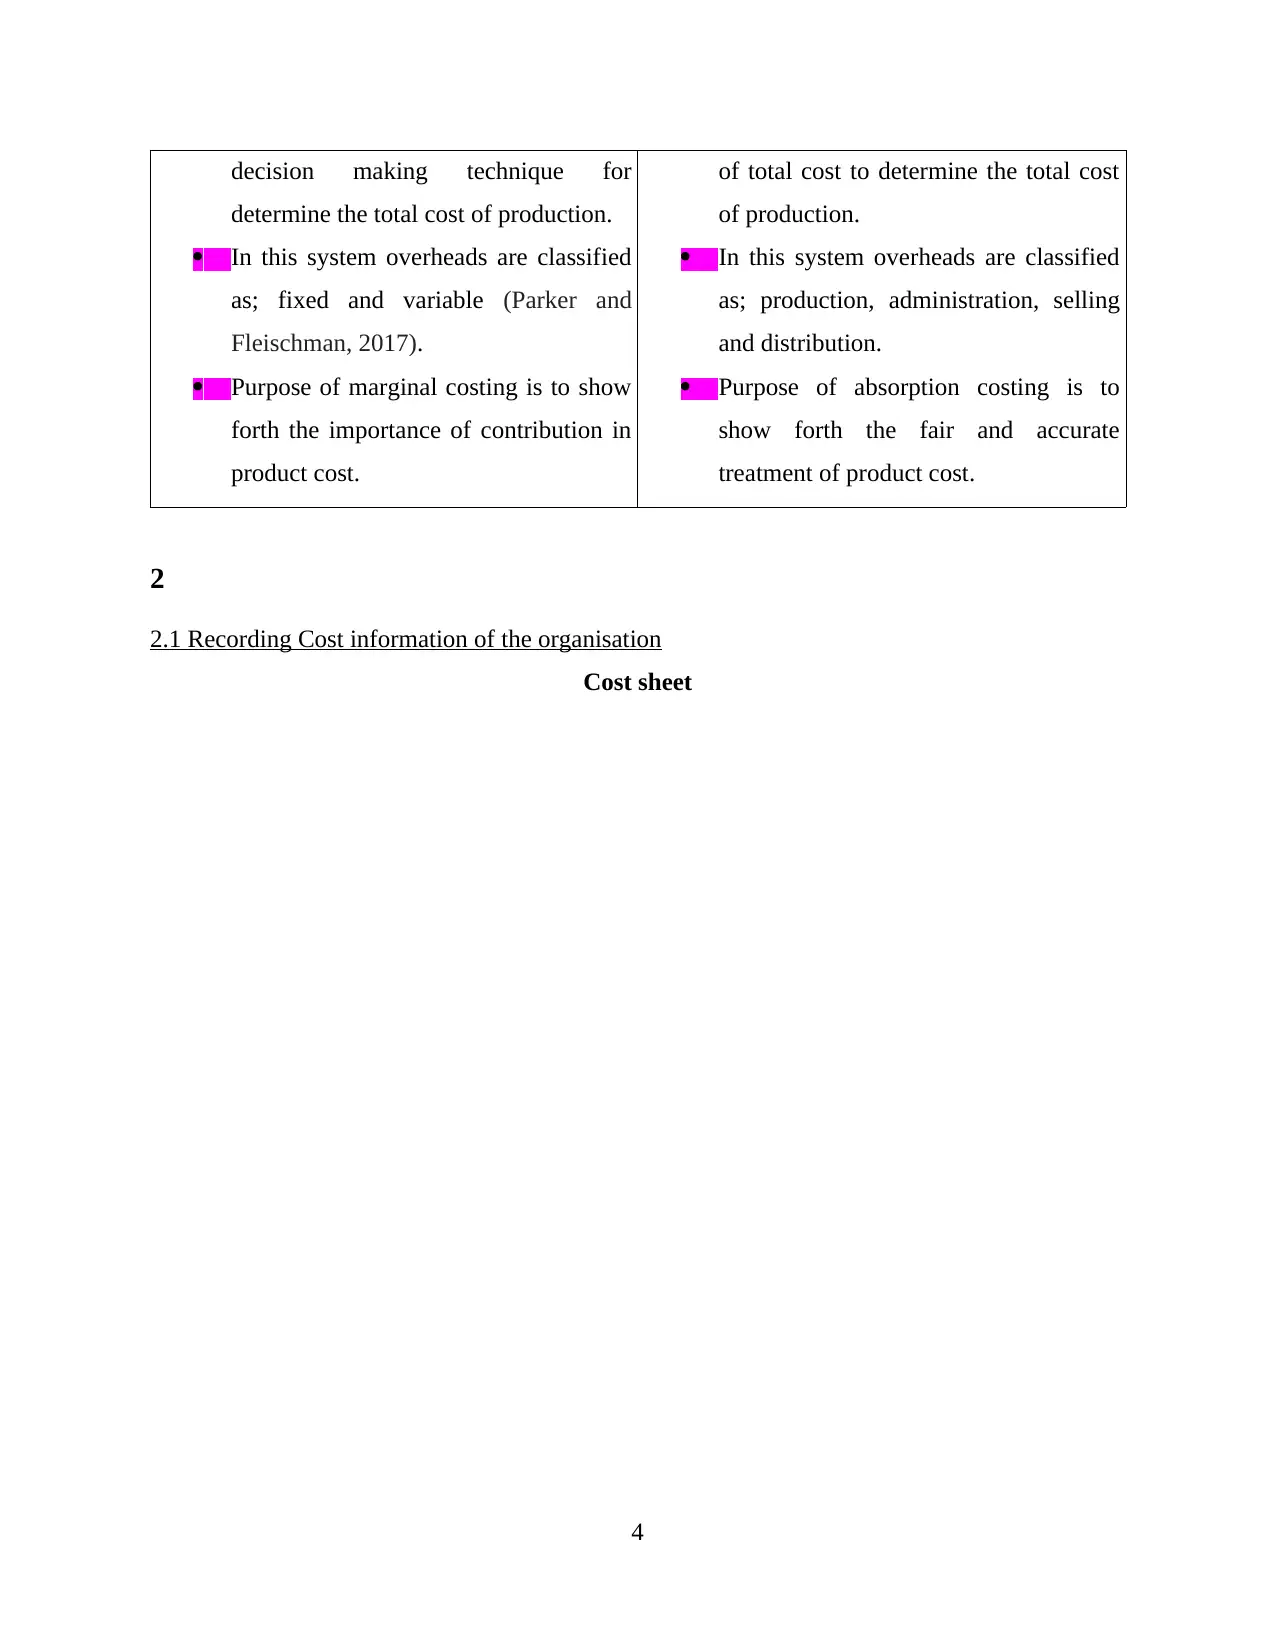
decision making technique for
determine the total cost of production.
In this system overheads are classified
as; fixed and variable (Parker and
Fleischman, 2017).
Purpose of marginal costing is to show
forth the importance of contribution in
product cost.
of total cost to determine the total cost
of production.
In this system overheads are classified
as; production, administration, selling
and distribution.
Purpose of absorption costing is to
show forth the fair and accurate
treatment of product cost.
2
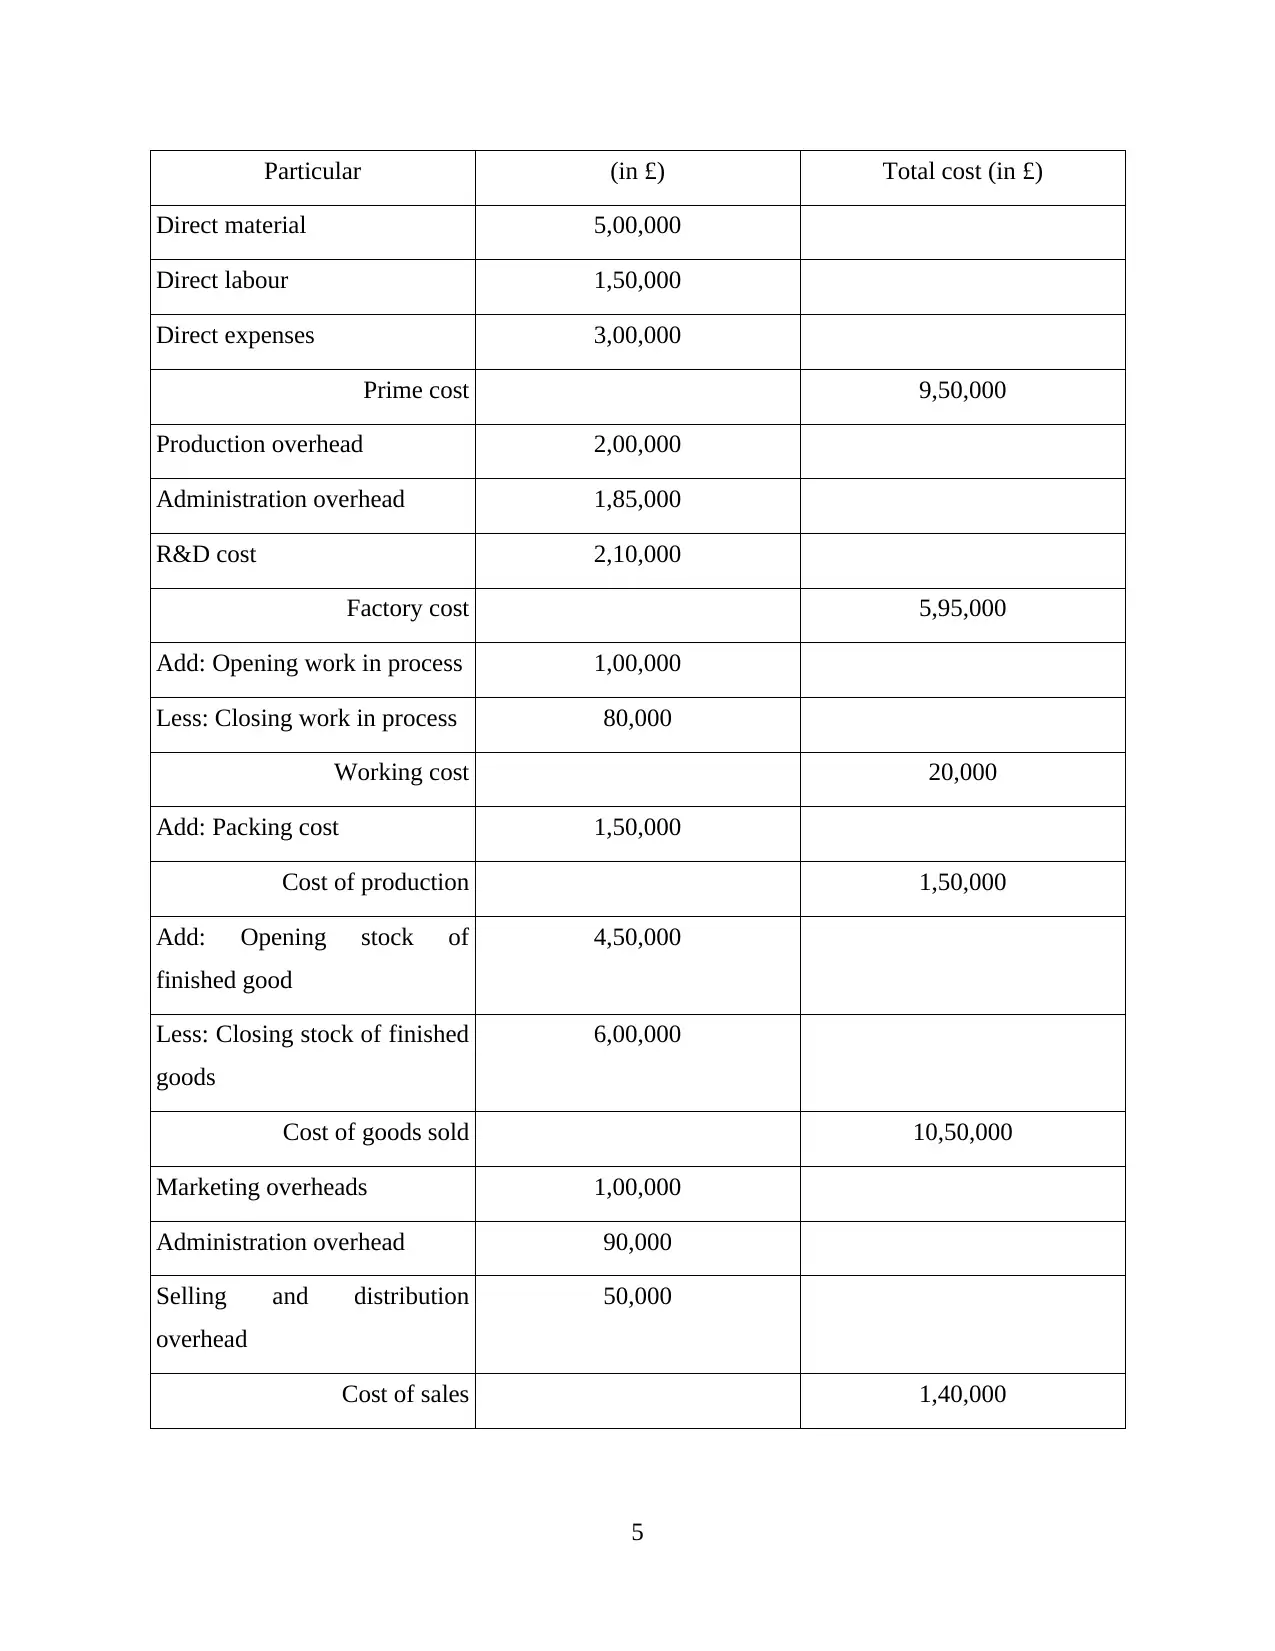
2.1 Recording Cost information of the organisation
Cost sheet
4
determine the total cost of production.
In this system overheads are classified
as; fixed and variable (Parker and
Fleischman, 2017).
Purpose of marginal costing is to show
forth the importance of contribution in
product cost.
of total cost to determine the total cost
of production.
In this system overheads are classified
as; production, administration, selling
and distribution.
Purpose of absorption costing is to
show forth the fair and accurate
treatment of product cost.
2
2.1 Recording Cost information of the organisation
Cost sheet
4
Paraphrase This Document
Need a fresh take? Get an instant paraphrase of this document with our AI Paraphraser
Particular (in £) Total cost (in £)
Direct material 5,00,000
Direct labour 1,50,000
Direct expenses 3,00,000
Prime cost 9,50,000
Production overhead 2,00,000
Administration overhead 1,85,000
R&D cost 2,10,000
Factory cost 5,95,000
Add: Opening work in process 1,00,000
Less: Closing work in process 80,000
Working cost 20,000
Add: Packing cost 1,50,000
Cost of production 1,50,000
Add: Opening stock of
finished good
4,50,000
Less: Closing stock of finished
goods
6,00,000
Cost of goods sold 10,50,000
Marketing overheads 1,00,000
Administration overhead 90,000
Selling and distribution
overhead
50,000
Cost of sales 1,40,000
5
2.2 Analysing cost information of the organisation
From the above cost sheet it has been analysed that there are various cost such as; direct
and indirect that adding up in the total cost of the organisation and decreasing the total margin
(Rahim, 2017). Prime cost is the total amount of direct labour, direct material and direct
expenses. Production cost include administration, R&D cost, etc. in the cost sheet, all the
products are not made for sale that state that they are not known as goods for sold.
2.3 Define the various stages of inventory
There are various stage of inventory; raw material, finished goods, work-in-progress and
cost of goods sold.
Raw material- This is the first stage of inventory. Raw material defined as a crude or
processed material that can be transform by manufacture, processing or combination into new
and useful product. Basically these are the material that will make final good at the last stage of
production.
Work-in-progress- After raw material are pulled into the process of developing a final
product they basically enter in second stage that is work-in-progress. It is a portion of inventory
that represent that products tat are no longer saleable as a raw material and not yet saleable as
finished product. WIP also called as semi-finished good.
Finished goods- This stage of inventory are the final stage that goods completed the
manufacturing process and convert into final product but still not has been sold to customers
(Reynard and et.al., 2016).
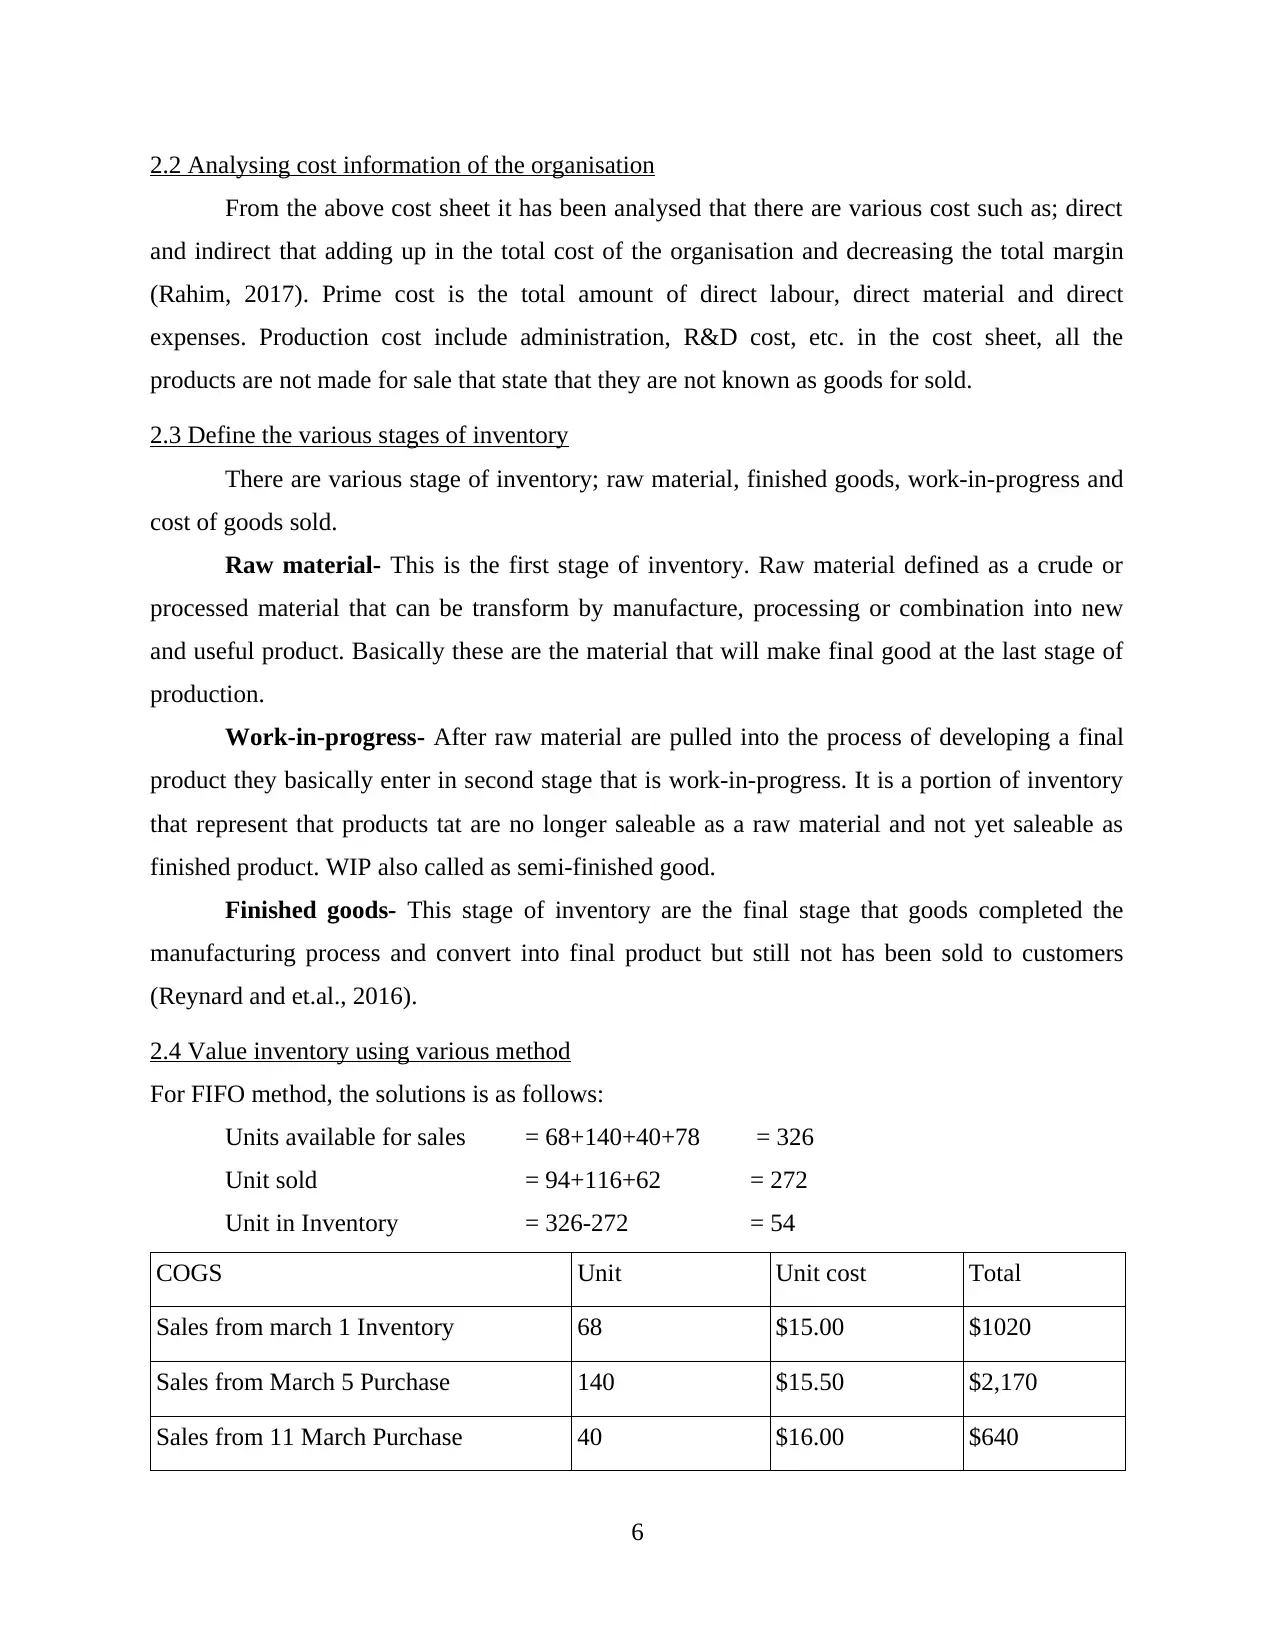
2.4 Value inventory using various method
For FIFO method, the solutions is as follows:
Units available for sales = 68+140+40+78 = 326
Unit sold = 94+116+62 = 272
Unit in Inventory = 326-272 = 54
COGS Unit Unit cost Total
Sales from march 1 Inventory 68 $15.00 $1020
Sales from March 5 Purchase 140 $15.50 $2,170
Sales from 11 March Purchase 40 $16.00 $640
6
From the above cost sheet it has been analysed that there are various cost such as; direct
and indirect that adding up in the total cost of the organisation and decreasing the total margin
(Rahim, 2017). Prime cost is the total amount of direct labour, direct material and direct
expenses. Production cost include administration, R&D cost, etc. in the cost sheet, all the
products are not made for sale that state that they are not known as goods for sold.
2.3 Define the various stages of inventory
There are various stage of inventory; raw material, finished goods, work-in-progress and
cost of goods sold.
Raw material- This is the first stage of inventory. Raw material defined as a crude or
processed material that can be transform by manufacture, processing or combination into new
and useful product. Basically these are the material that will make final good at the last stage of
production.
Work-in-progress- After raw material are pulled into the process of developing a final
product they basically enter in second stage that is work-in-progress. It is a portion of inventory
that represent that products tat are no longer saleable as a raw material and not yet saleable as
finished product. WIP also called as semi-finished good.
Finished goods- This stage of inventory are the final stage that goods completed the
manufacturing process and convert into final product but still not has been sold to customers
(Reynard and et.al., 2016).
2.4 Value inventory using various method
For FIFO method, the solutions is as follows:
Units available for sales = 68+140+40+78 = 326
Unit sold = 94+116+62 = 272
Unit in Inventory = 326-272 = 54
COGS Unit Unit cost Total
Sales from march 1 Inventory 68 $15.00 $1020
Sales from March 5 Purchase 140 $15.50 $2,170
Sales from 11 March Purchase 40 $16.00 $640
6
⊘ This is a preview!⊘
Do you want full access?
Subscribe today to unlock all pages.
Trusted by 1+ million students worldwide
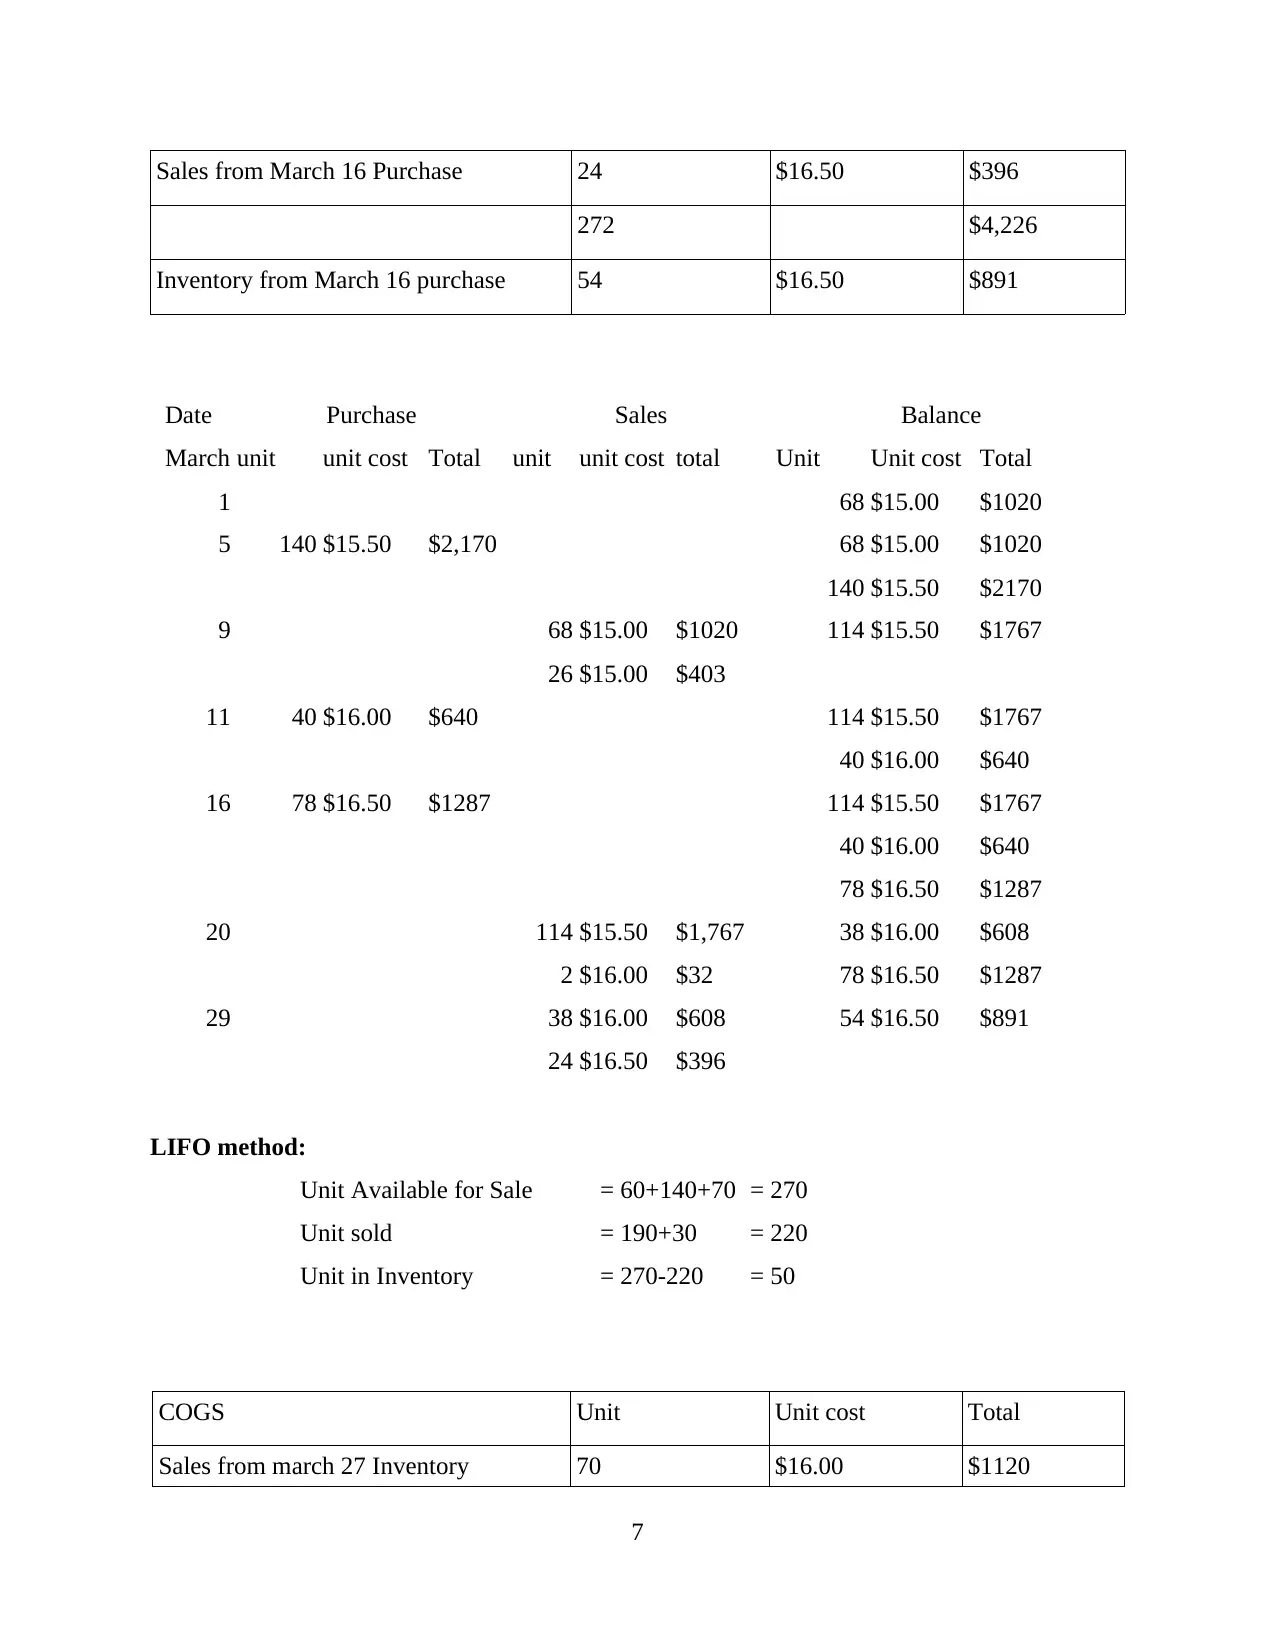
Sales from March 16 Purchase 24 $16.50 $396
272 $4,226
Inventory from March 16 purchase 54 $16.50 $891
Date Purchase Sales Balance
March unit unit cost Total unit unit cost total Unit Unit cost Total
1 68 $15.00 $1020
5 140 $15.50 $2,170 68 $15.00 $1020
140 $15.50 $2170
9 68 $15.00 $1020 114 $15.50 $1767
26 $15.00 $403
11 40 $16.00 $640 114 $15.50 $1767
40 $16.00 $640
16 78 $16.50 $1287 114 $15.50 $1767
40 $16.00 $640
78 $16.50 $1287
20 114 $15.50 $1,767 38 $16.00 $608
2 $16.00 $32 78 $16.50 $1287
29 38 $16.00 $608 54 $16.50 $891
24 $16.50 $396
LIFO method:
Unit Available for Sale = 60+140+70 = 270
Unit sold = 190+30 = 220
Unit in Inventory = 270-220 = 50
COGS Unit Unit cost Total
Sales from march 27 Inventory 70 $16.00 $1120
7
Paraphrase This Document
Need a fresh take? Get an instant paraphrase of this document with our AI Paraphraser
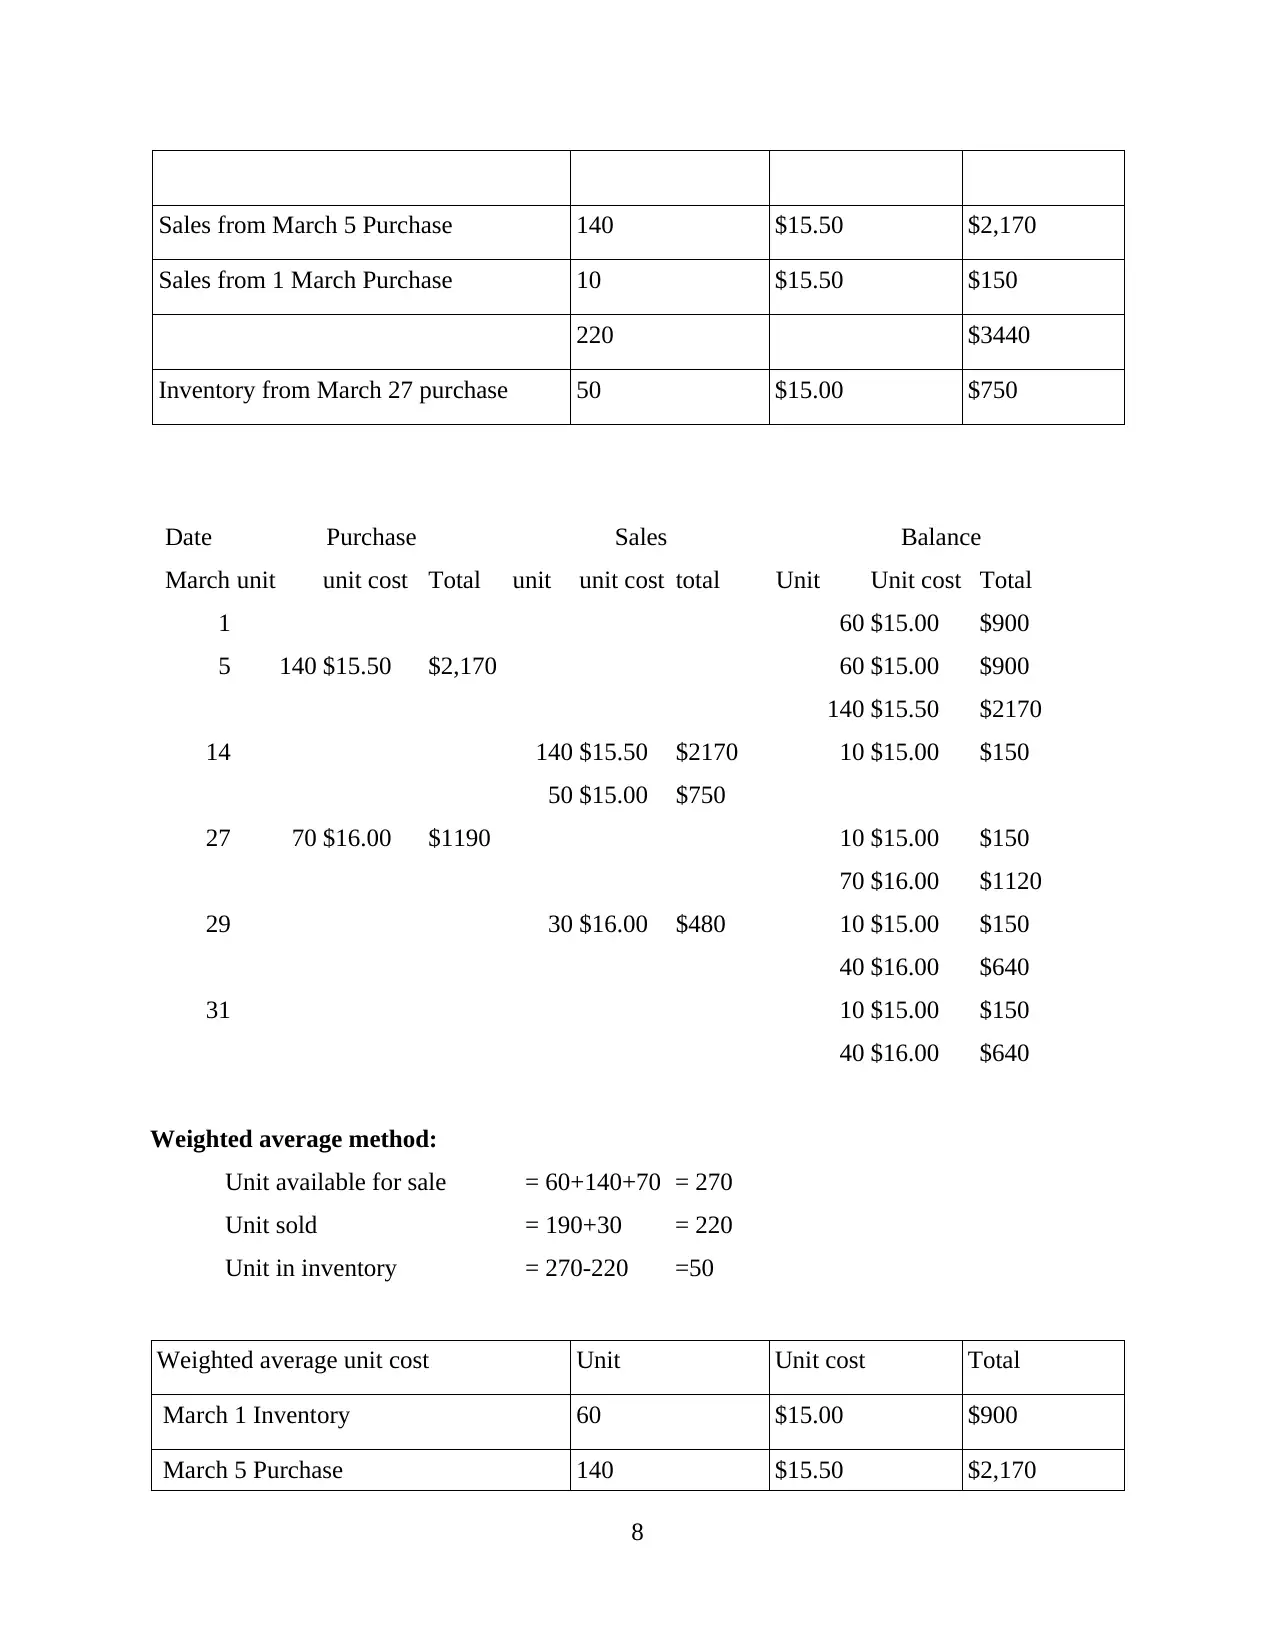
Sales from March 5 Purchase 140 $15.50 $2,170
Sales from 1 March Purchase 10 $15.50 $150
220 $3440
Inventory from March 27 purchase 50 $15.00 $750
Date Purchase Sales Balance
March unit unit cost Total unit unit cost total Unit Unit cost Total
1 60 $15.00 $900
5 140 $15.50 $2,170 60 $15.00 $900
140 $15.50 $2170
14 140 $15.50 $2170 10 $15.00 $150
50 $15.00 $750
27 70 $16.00 $1190 10 $15.00 $150
70 $16.00 $1120
29 30 $16.00 $480 10 $15.00 $150
40 $16.00 $640
31 10 $15.00 $150
40 $16.00 $640
Weighted average method:
Unit available for sale = 60+140+70 = 270
Unit sold = 190+30 = 220
Unit in inventory = 270-220 =50
Weighted average unit cost Unit Unit cost Total
March 1 Inventory 60 $15.00 $900
March 5 Purchase 140 $15.50 $2,170
8
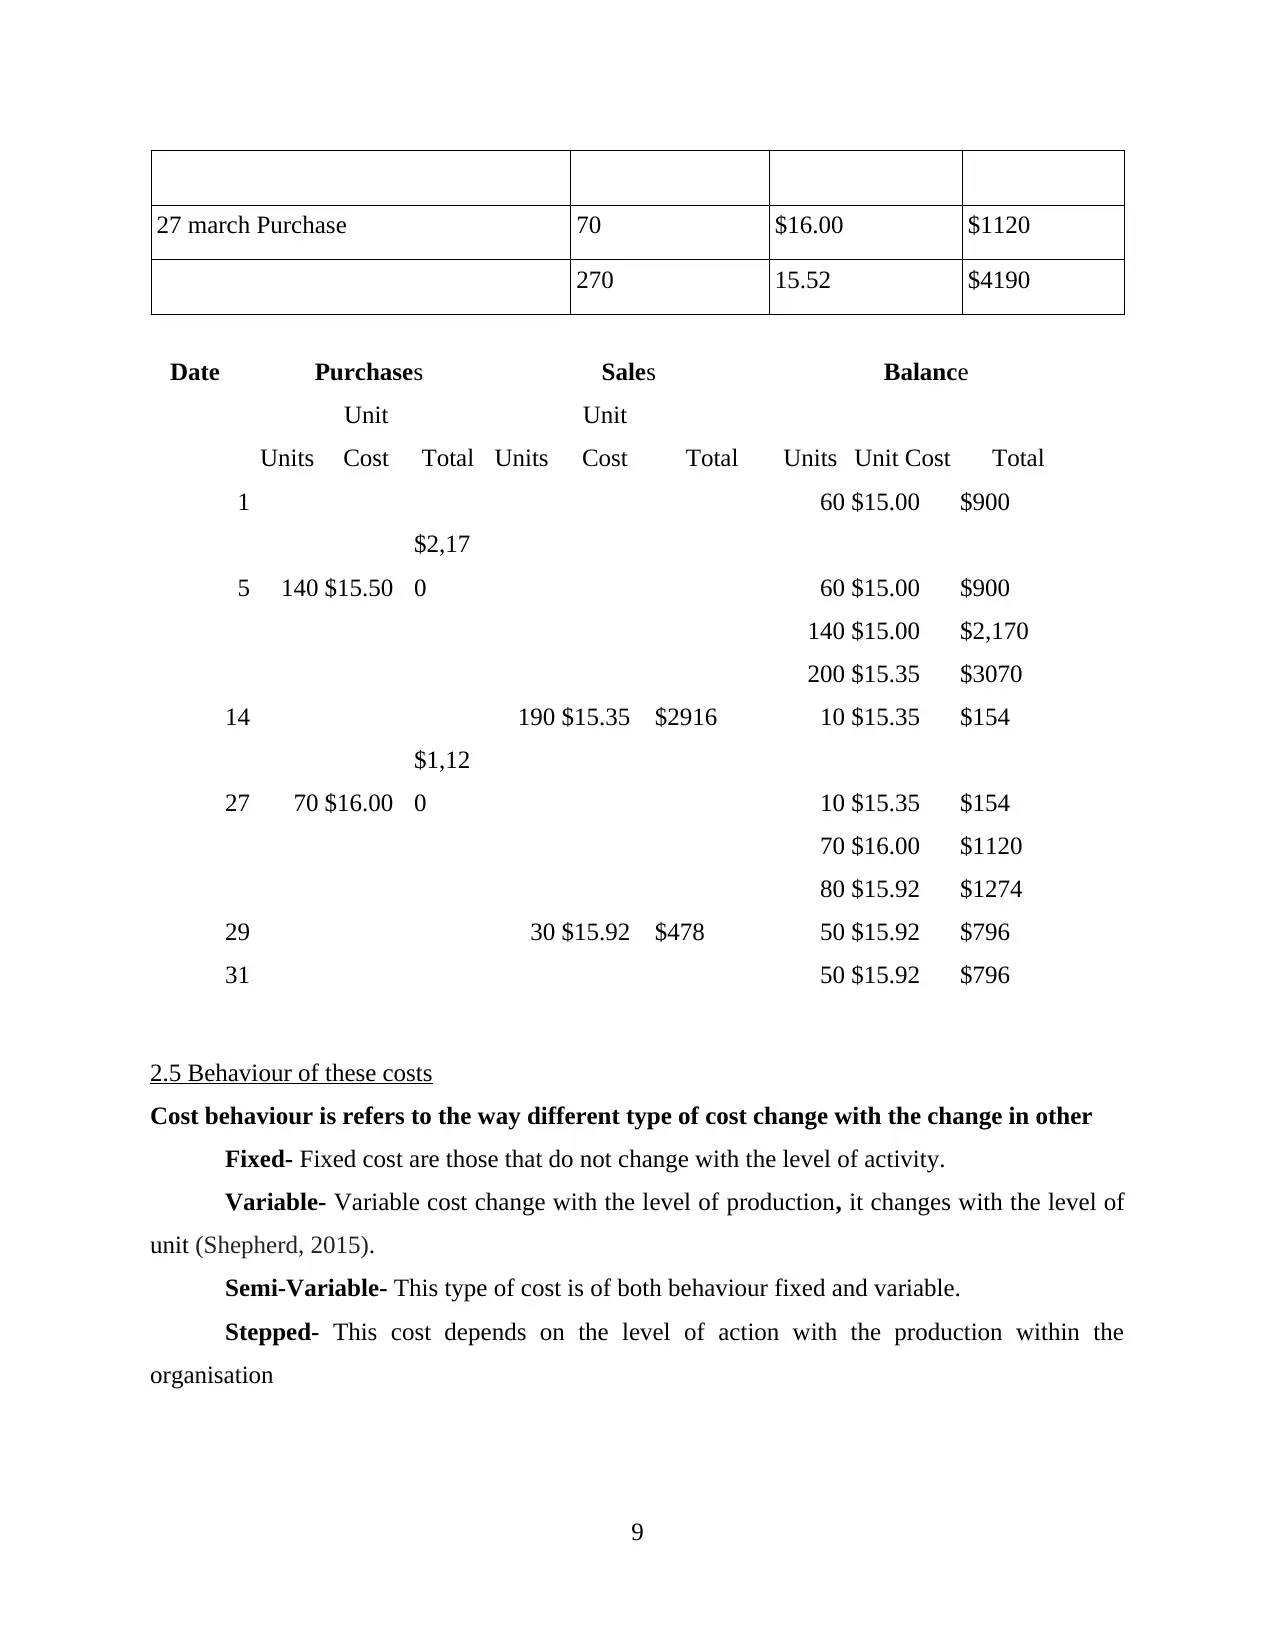
27 march Purchase 70 $16.00 $1120
270 15.52 $4190
Date Purchases Sales Balance
Units
Unit
Cost Total Units
Unit
Cost Total Units Unit Cost Total
1 60 $15.00 $900
5 140 $15.50
$2,17
0 60 $15.00 $900
140 $15.00 $2,170
200 $15.35 $3070
14 190 $15.35 $2916 10 $15.35 $154
27 70 $16.00
$1,12
0 10 $15.35 $154
70 $16.00 $1120
80 $15.92 $1274
29 30 $15.92 $478 50 $15.92 $796
31 50 $15.92 $796
2.5 Behaviour of these costs
Cost behaviour is refers to the way different type of cost change with the change in other
Fixed- Fixed cost are those that do not change with the level of activity.
Variable- Variable cost change with the level of production, it changes with the level of
unit (Shepherd, 2015).
Semi-Variable- This type of cost is of both behaviour fixed and variable.
Stepped- This cost depends on the level of action with the production within the
organisation
9
⊘ This is a preview!⊘
Do you want full access?
Subscribe today to unlock all pages.
Trusted by 1+ million students worldwide
1 out of 20
Related Documents


Your All-in-One AI-Powered Toolkit for Academic Success.
+13062052269
info@desklib.com
Available 24*7 on WhatsApp / Email
![[object Object]](/_next/static/media/star-bottom.7253800d.svg)
Unlock your academic potential
Copyright © 2020–2026 A2Z Services. All Rights Reserved. Developed and managed by ZUCOL.