UK Couples' Investment Tendencies in Tax-Deferred Retirement Plans
VerifiedAdded on 2023/04/22
|17
|4013
|186
Report
AI Summary
This report investigates the tendency of couples in the United Kingdom to invest in tax-deferred retirement plans. It begins with an introduction to tax-deferred savings schemes and their importance for old-age financial security, justifying the study by highlighting the need to identify which employee groups benefit most from these plans. The research employs hypothesis tests, visual representations, and regression analysis on a sample of 194 couples, examining factors such as the number of dependent children, salary levels, and debt amounts. Key findings indicate a weak positive correlation between the number of children and investment, a similar correlation between salary and investment, and an inverse relationship between debt and investment. The report concludes with recommendations based on these findings, emphasizing the need to encourage broader participation in tax-deferred retirement plans.

The Tendency of Couples to Invest in Tax-Deferred
Retirement Plans
THE TENDENCY OF COUPLES TO INVEST IN TAX-DEFERRED RETIREMENT
PLANS
Student Name
Name of the course
Name of the Lecturer
Institution
State/city
Date
1 | P a g e
Retirement Plans
THE TENDENCY OF COUPLES TO INVEST IN TAX-DEFERRED RETIREMENT
PLANS
Student Name
Name of the course
Name of the Lecturer
Institution
State/city
Date
1 | P a g e
Paraphrase This Document
Need a fresh take? Get an instant paraphrase of this document with our AI Paraphraser
The Tendency of Couples to Invest in Tax-Deferred
Retirement Plans
Table of Contents
Table of Contents..................................................................................................................................2
The table of figures................................................................................................................................2
List of tables..........................................................................................................................................2
1.1. Justification of the study........................................................................................................3
1.2. Research question..................................................................................................................3
1.3. Hypothesis.............................................................................................................................4
2. Data research methods...................................................................................................................4
3. Findings.........................................................................................................................................4
4. Conclusion and recommendations...............................................................................................13
5. References...................................................................................................................................15
6. Appendix.....................................................................................................................................17
The table of figures
Figure 1: The box plot of the Mortgage.....................................................................................5
Figure 2: The Debt data box plot...............................................................................................5
Figure 3: Average investment based on the number of children...............................................8
Figure 4: Average mortgage based on the number of children................................................12
List of tables
Table 1: Output of the regression of the children dependants and the invested percentage......6
Table 2: The two sampled t-test for the number of children and the amount invested..............7
Table 3: Number of children and the average percentage invested...........................................7
Table 4: Regression of the value of salary income and the invested percentage.......................8
Table 5: Two sampled t-test of the amount of salary and the invested percentage...................9
Table 6: The regression of the debt value and the invested percentage...................................10
Table 7: Two sampel t-test of the debt and invested percentage.............................................10
Table 8: the regression of the number oif children dependabts amnd the vaklue of home
mortgage...................................................................................................................................11
Table 9: T-test for the mean of children and the mortgage amount.........................................12
Table 10: Number of children and the amount of mortgage....................................................12
2 | P a g e

The Tendency of Couples to Invest in Tax-Deferred
Retirement Plans
1. Introduction
A tax differed savings scheme is a scheme that is recognised by the government
through registration and allows its members tax deferral obligations (Gianasso 2015).
The savings earned from the scheme are not taxed for an indicated period of time
usually till the withdrawal date.
Under the differed savings plan we have the retirement investment plan where the
contributors are exempted from taxes on the contributions up to the time when the
savings are mature for withdrawal (Thomas & Gerald 2010). This way an employee is
able to place a fraction of his/ her pre-tax income into a retirement scheme that
permits investment of the funds. During the continuation’s phase taxation on the
funds are suspended up to the point when the employees retire and is eligible to
pensions annuity. At this point the tax levied will be relatively lower since the pension
earnings are lower than the salary obtained during the working age.
In this survey the focus will be to evaluate the group that mostly take advantage of the
investment plan. So as to arrive at a justified conclusion the research will involve a
survey of a sample of coupes leaving in the United Kingdom. The information will be
analysed using Microsoft Excel and conclusions drawn.
1.1. Justification of the study
One of the major shortcomings of old age is the inability to work and sustain
yourself. As away of tackling this a number of government agencies as well as
private insurance firms have strived to model various schemes to assist the
currently working population save so as to sustain themselves in old age. The
schemes that have been modelled by various insurers do vary and hence differ
when it comes to advantages enjoyed by the members (Tufts & Fairbanks 2011).
One of the best schemes is the tax-differed retirement plan. This allows employees
to make their savings in a tax-free scheme while at the same time exempting
taxation on the amount deducted to the scheme. The importance of the survey will
be the identification of the section of employees who are benefiting most by the
investment opportunity (Martin 2017). This way it will be possible to highlight the
individuals who are yet to take advantage of the scheme and derive measures of
helping them be aware and subscribe to the savings plan.
1.2. Research question
3 | P a g e
⊘ This is a preview!⊘
Do you want full access?
Subscribe today to unlock all pages.
Trusted by 1+ million students worldwide

The Tendency of Couples to Invest in Tax-Deferred
Retirement Plans
The main research question will be tendency of couples to subscribe to the tax
differed retirement schemes. The analysis is expected to give more insight in to
the common groups that have taken advantage of the investment opportunity and
the people that need to be encouraged to subscribe to the scheme.
1.3. Hypothesis
So as to obtain the objective a number of hypotheses will be tested from the
sampled data. Some of the hypotheses of interest will be
i. Couples with more dependent children are more motivated to subscribe to
the retirement plan.
ii. Couples with lower salary do not benefit from the tax differed retirement
plans.
iii. Couples with huge debts invest less in the tax differed retirement plan.
iv. The number of dependent children impact on couple’s demand for home
mortgage.
2. Data research methods
So as to verify the research question a number of techniques will be applied, this
include hypothesis tests, visual representations as well as regression tests. The visual
analysis will involve pivot tables, tables, boxplots, scatterplots as well as histograms.
The data sample contains information from 194 couples working in Britain that was
collected at random (Ariyaratne 2017). The data collection was done via a
questionnaire which was sent to the participants to be filled without revealing identity.
The data description information is available in table 1 in the appendix.
Considering the huge population of the United Kingdom, a sample of 194 couples
might not represent the overall population efficiently. For this reason, the results of
the study might reflect some shortcomings (Lance & Hattori 2016).
3. Findings
Identification of errors
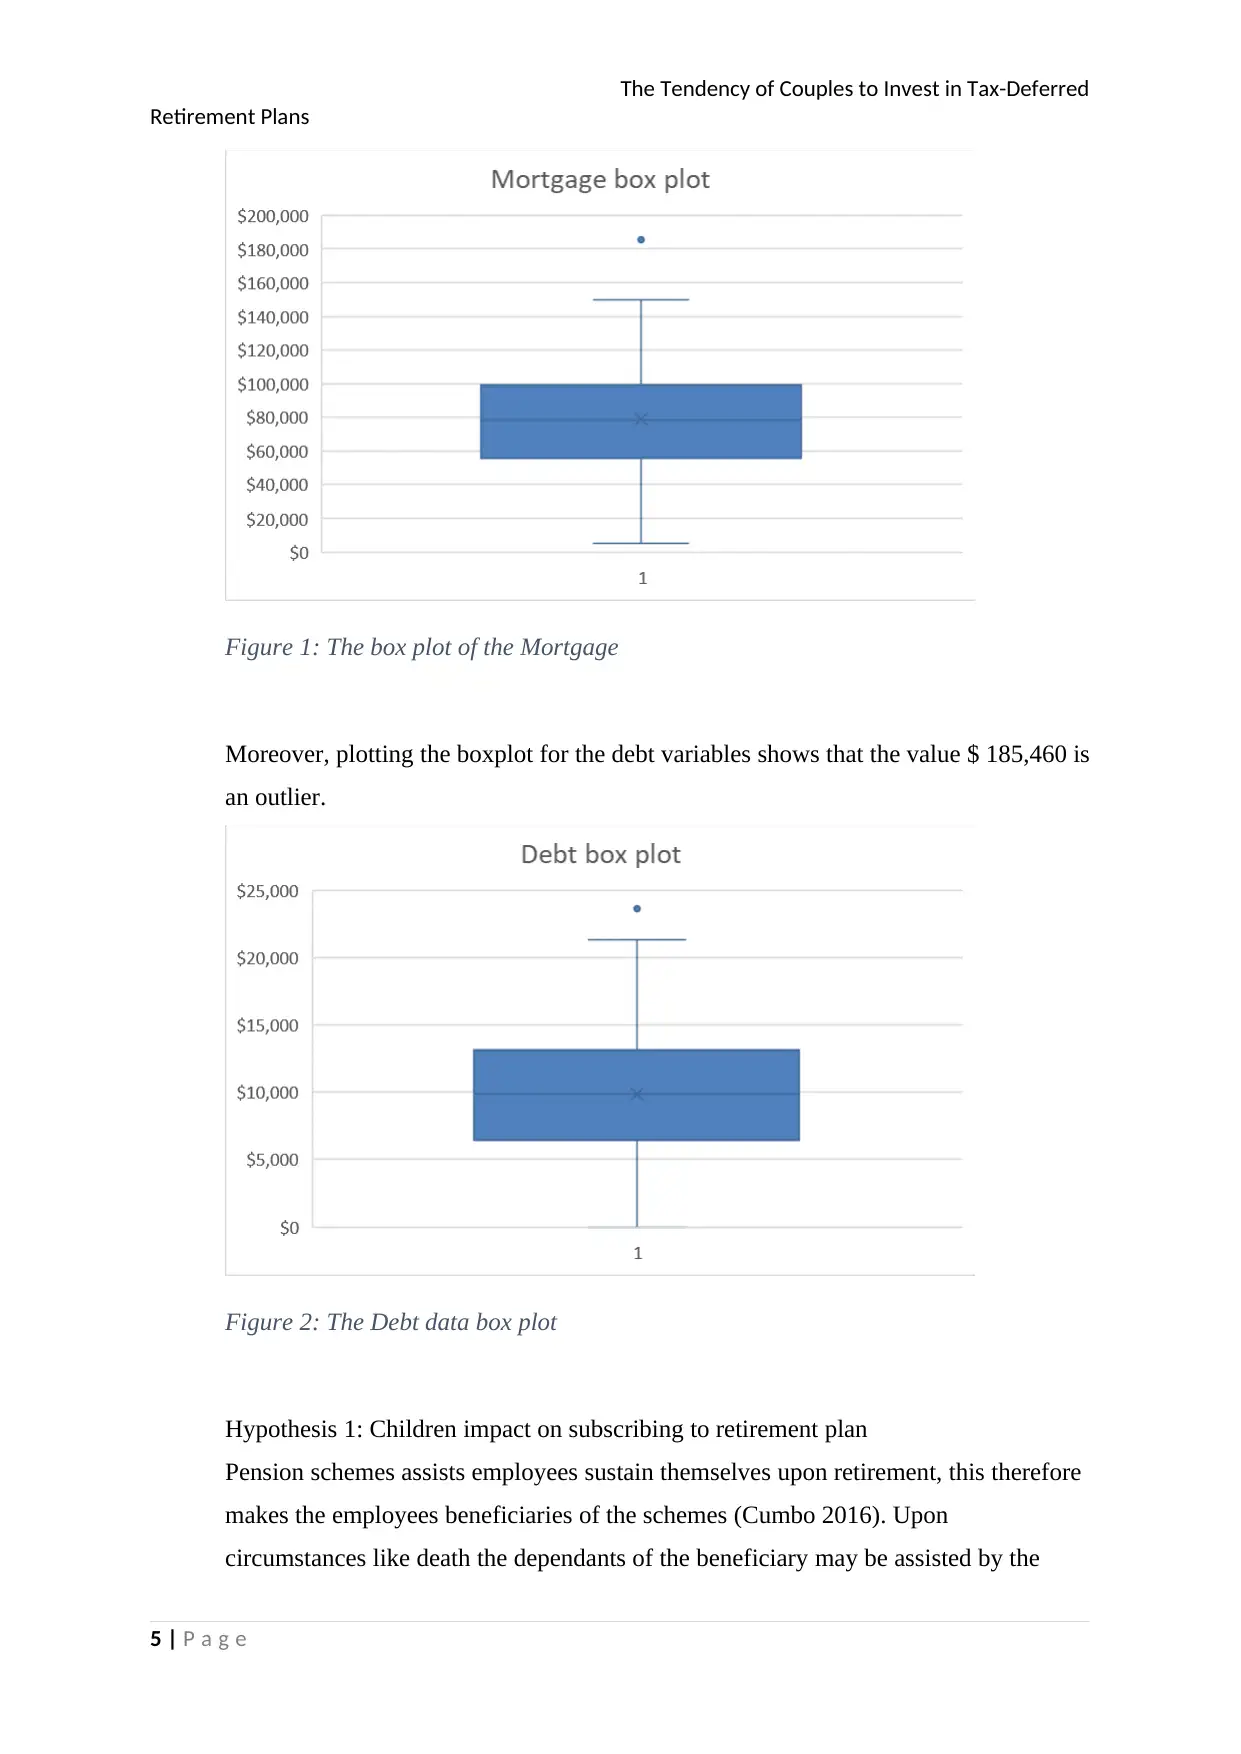
Scrutinising the data sample gives an indication that errors might be present in the
data set for the debt and mortgage values. The box plot for the mortgage values
indicates that the value $ 185, 460 need to be treated as an exception (Wu 2013).
4 | P a g e
Retirement Plans
The main research question will be tendency of couples to subscribe to the tax
differed retirement schemes. The analysis is expected to give more insight in to
the common groups that have taken advantage of the investment opportunity and
the people that need to be encouraged to subscribe to the scheme.
1.3. Hypothesis
So as to obtain the objective a number of hypotheses will be tested from the
sampled data. Some of the hypotheses of interest will be
i. Couples with more dependent children are more motivated to subscribe to
the retirement plan.
ii. Couples with lower salary do not benefit from the tax differed retirement
plans.
iii. Couples with huge debts invest less in the tax differed retirement plan.
iv. The number of dependent children impact on couple’s demand for home
mortgage.
2. Data research methods
So as to verify the research question a number of techniques will be applied, this
include hypothesis tests, visual representations as well as regression tests. The visual
analysis will involve pivot tables, tables, boxplots, scatterplots as well as histograms.
The data sample contains information from 194 couples working in Britain that was
collected at random (Ariyaratne 2017). The data collection was done via a
questionnaire which was sent to the participants to be filled without revealing identity.
The data description information is available in table 1 in the appendix.
Considering the huge population of the United Kingdom, a sample of 194 couples
might not represent the overall population efficiently. For this reason, the results of
the study might reflect some shortcomings (Lance & Hattori 2016).
3. Findings
Identification of errors
Scrutinising the data sample gives an indication that errors might be present in the
data set for the debt and mortgage values. The box plot for the mortgage values
indicates that the value $ 185, 460 need to be treated as an exception (Wu 2013).
4 | P a g e
Paraphrase This Document
Need a fresh take? Get an instant paraphrase of this document with our AI Paraphraser
The Tendency of Couples to Invest in Tax-Deferred
Retirement Plans
Figure 1: The box plot of the Mortgage
Moreover, plotting the boxplot for the debt variables shows that the value $ 185,460 is
an outlier.
Figure 2: The Debt data box plot
Hypothesis 1: Children impact on subscribing to retirement plan
Pension schemes assists employees sustain themselves upon retirement, this therefore
makes the employees beneficiaries of the schemes (Cumbo 2016). Upon
circumstances like death the dependants of the beneficiary may be assisted by the
5 | P a g e
The Tendency of Couples to Invest in Tax-Deferred
Retirement Plans
pension plans. The children are occasionally one of the dependants that benefit from
pensions plan being that they financially depend on the employees for financial
sustainability ((Cannon & Ian 2012).
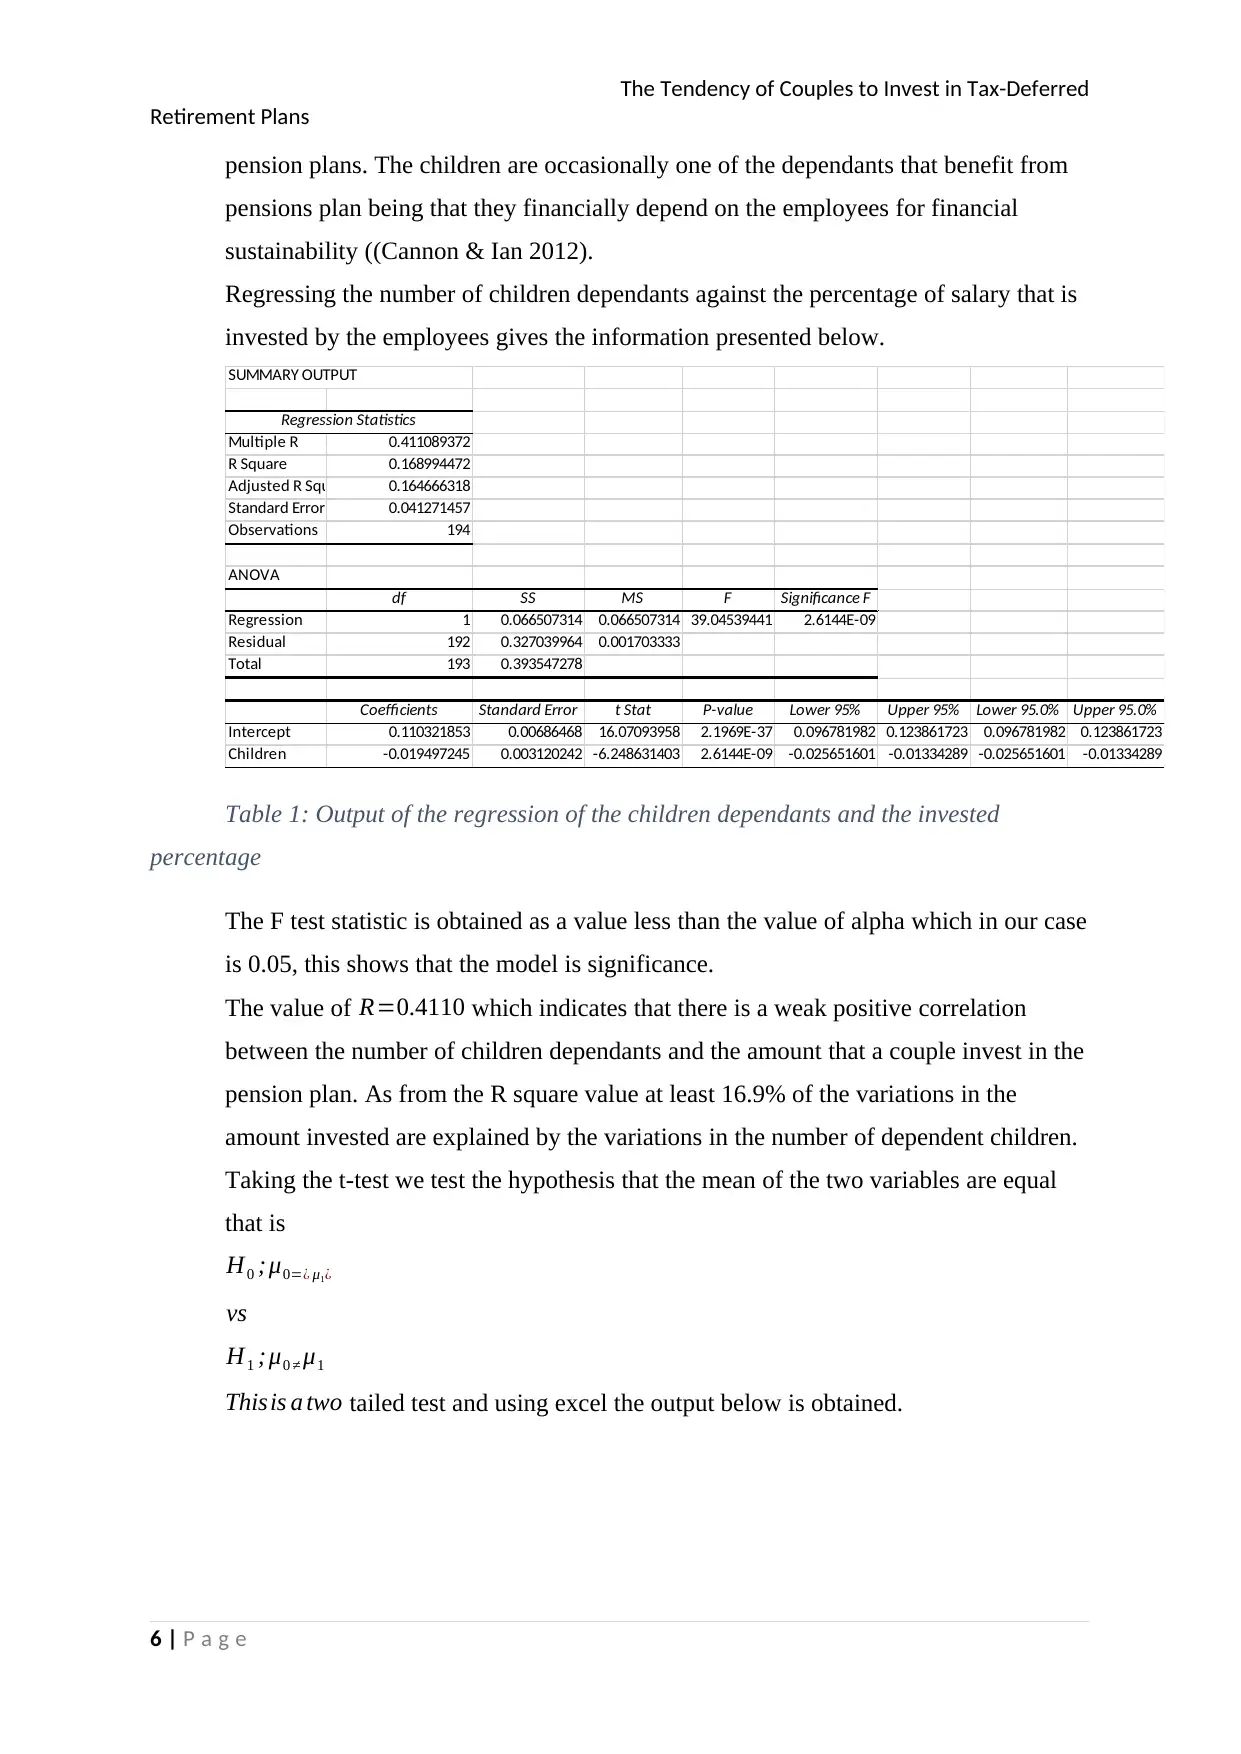
Regressing the number of children dependants against the percentage of salary that is
invested by the employees gives the information presented below.
SUMMARY OUTPUT
Regression Statistics
Multiple R 0.411089372
R Square 0.168994472
Adjusted R Square 0.164666318
Standard Error 0.041271457
Observations 194
ANOVA
df SS MS F Significance F
Regression 1 0.066507314 0.066507314 39.04539441 2.6144E-09
Residual 192 0.327039964 0.001703333
Total 193 0.393547278
Coefficients Standard Error t Stat P-value Lower 95% Upper 95% Lower 95.0% Upper 95.0%
Intercept 0.110321853 0.00686468 16.07093958 2.1969E-37 0.096781982 0.123861723 0.096781982 0.123861723
Children -0.019497245 0.003120242 -6.248631403 2.6144E-09 -0.025651601 -0.01334289 -0.025651601 -0.01334289
Table 1: Output of the regression of the children dependants and the invested
percentage
The F test statistic is obtained as a value less than the value of alpha which in our case
is 0.05, this shows that the model is significance.
The value of R=0.4110 which indicates that there is a weak positive correlation
between the number of children dependants and the amount that a couple invest in the
pension plan. As from the R square value at least 16.9% of the variations in the
amount invested are explained by the variations in the number of dependent children.
Taking the t-test we test the hypothesis that the mean of the two variables are equal
that is
H0 ;μ0=¿ μ1¿
vs
H1 ;μ0 ≠ μ1
Thisis a two tailed test and using excel the output below is obtained.
6 | P a g e
Retirement Plans
pension plans. The children are occasionally one of the dependants that benefit from
pensions plan being that they financially depend on the employees for financial
sustainability ((Cannon & Ian 2012).
Regressing the number of children dependants against the percentage of salary that is
invested by the employees gives the information presented below.
SUMMARY OUTPUT
Regression Statistics
Multiple R 0.411089372
R Square 0.168994472
Adjusted R Square 0.164666318
Standard Error 0.041271457
Observations 194
ANOVA
df SS MS F Significance F
Regression 1 0.066507314 0.066507314 39.04539441 2.6144E-09
Residual 192 0.327039964 0.001703333
Total 193 0.393547278
Coefficients Standard Error t Stat P-value Lower 95% Upper 95% Lower 95.0% Upper 95.0%
Intercept 0.110321853 0.00686468 16.07093958 2.1969E-37 0.096781982 0.123861723 0.096781982 0.123861723
Children -0.019497245 0.003120242 -6.248631403 2.6144E-09 -0.025651601 -0.01334289 -0.025651601 -0.01334289
Table 1: Output of the regression of the children dependants and the invested
percentage
The F test statistic is obtained as a value less than the value of alpha which in our case
is 0.05, this shows that the model is significance.
The value of R=0.4110 which indicates that there is a weak positive correlation
between the number of children dependants and the amount that a couple invest in the
pension plan. As from the R square value at least 16.9% of the variations in the
amount invested are explained by the variations in the number of dependent children.
Taking the t-test we test the hypothesis that the mean of the two variables are equal
that is
H0 ;μ0=¿ μ1¿
vs
H1 ;μ0 ≠ μ1
Thisis a two tailed test and using excel the output below is obtained.
6 | P a g e
⊘ This is a preview!⊘
Do you want full access?
Subscribe today to unlock all pages.
Trusted by 1+ million students worldwide
The Tendency of Couples to Invest in Tax-Deferred
Retirement Plans
t-Test: Two-Sample Assuming Unequal Variances
Children Invested
Mean 1.984536082 0.071628866
Variance 0.90649538 0.002039105
Observations 194 194
Hypothesized Mean Difference 0
df 194
t Stat 27.95271924
P(T<=t) one-tail 2.96527E-70
t Critical one-tail 1.652745977
P(T<=t) two-tail 5.93053E-70
t Critical two-tail 1.972267533
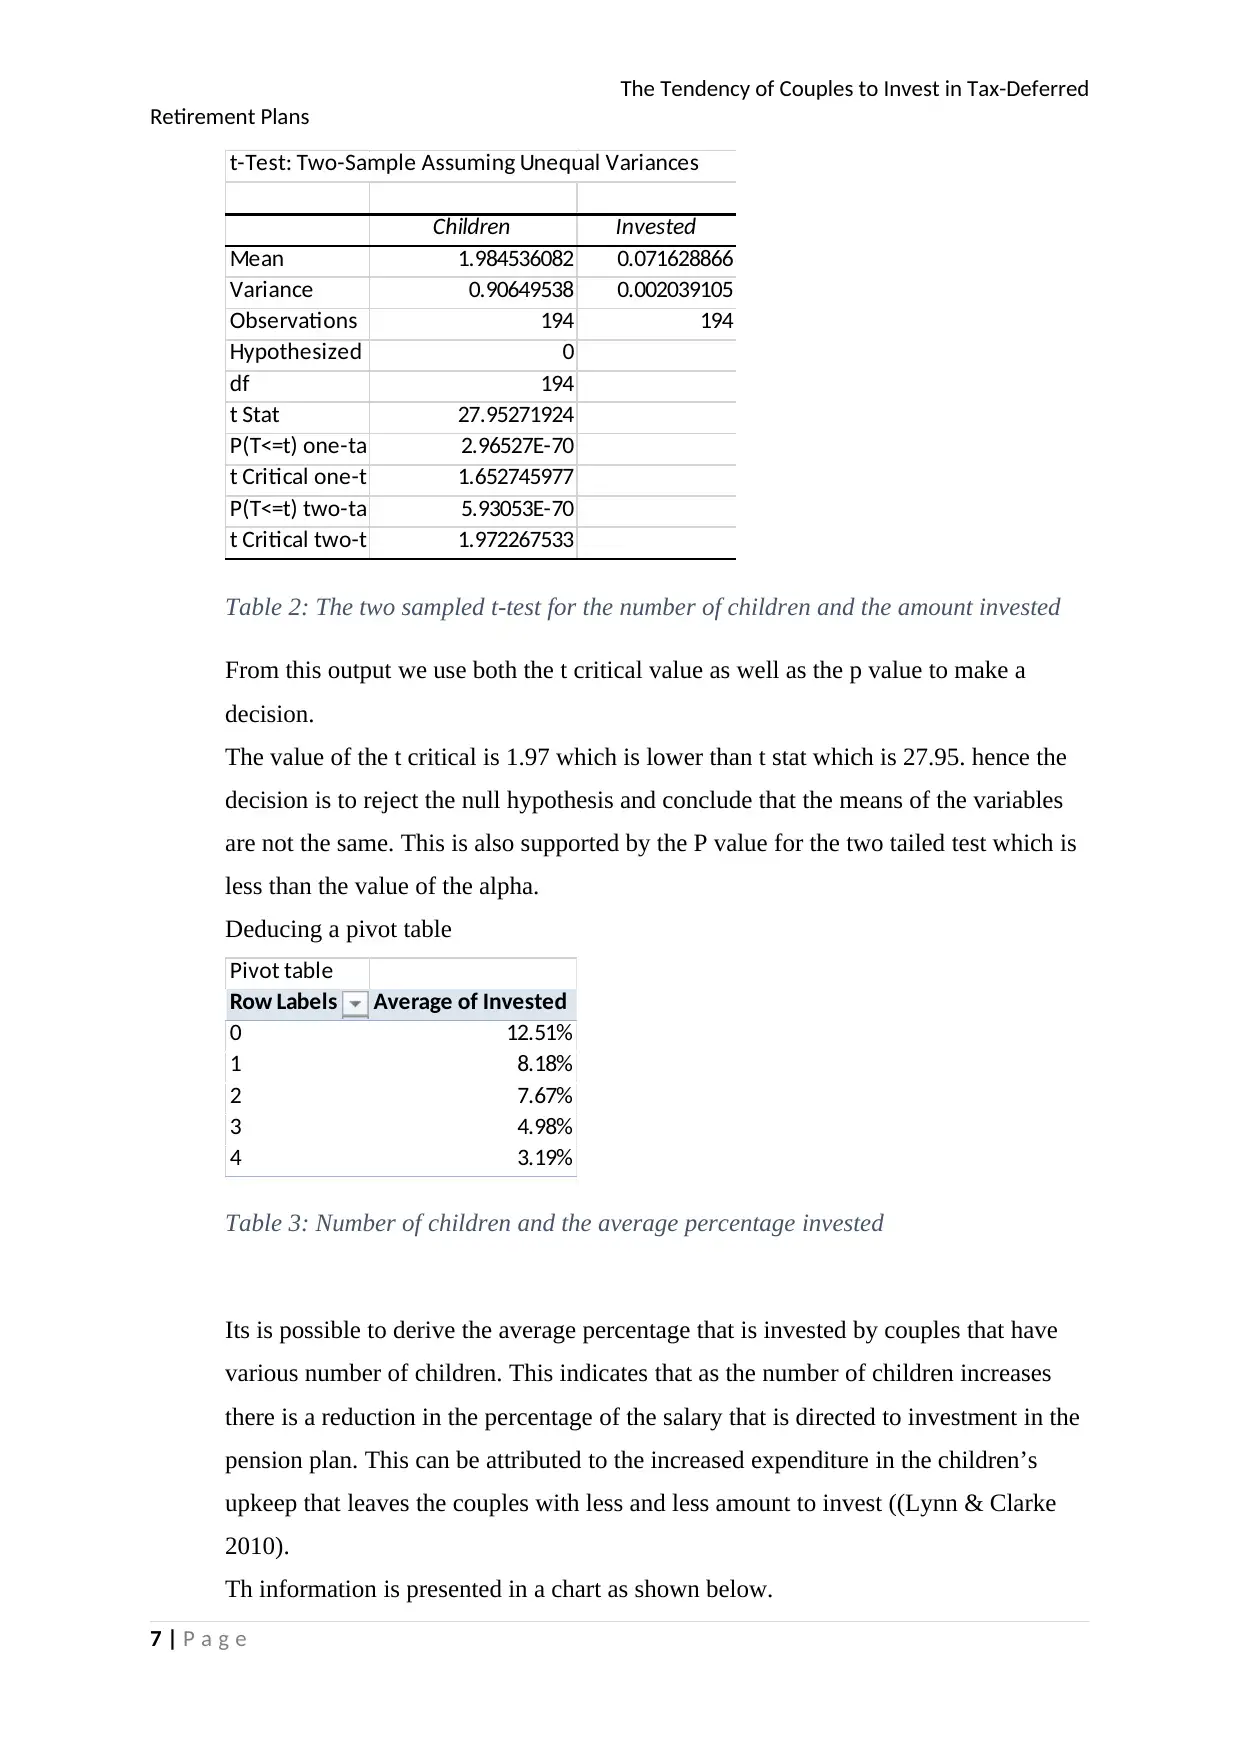
Table 2: The two sampled t-test for the number of children and the amount invested
From this output we use both the t critical value as well as the p value to make a
decision.
The value of the t critical is 1.97 which is lower than t stat which is 27.95. hence the
decision is to reject the null hypothesis and conclude that the means of the variables
are not the same. This is also supported by the P value for the two tailed test which is
less than the value of the alpha.
Deducing a pivot table
Pivot table
Row Labels Average of Invested
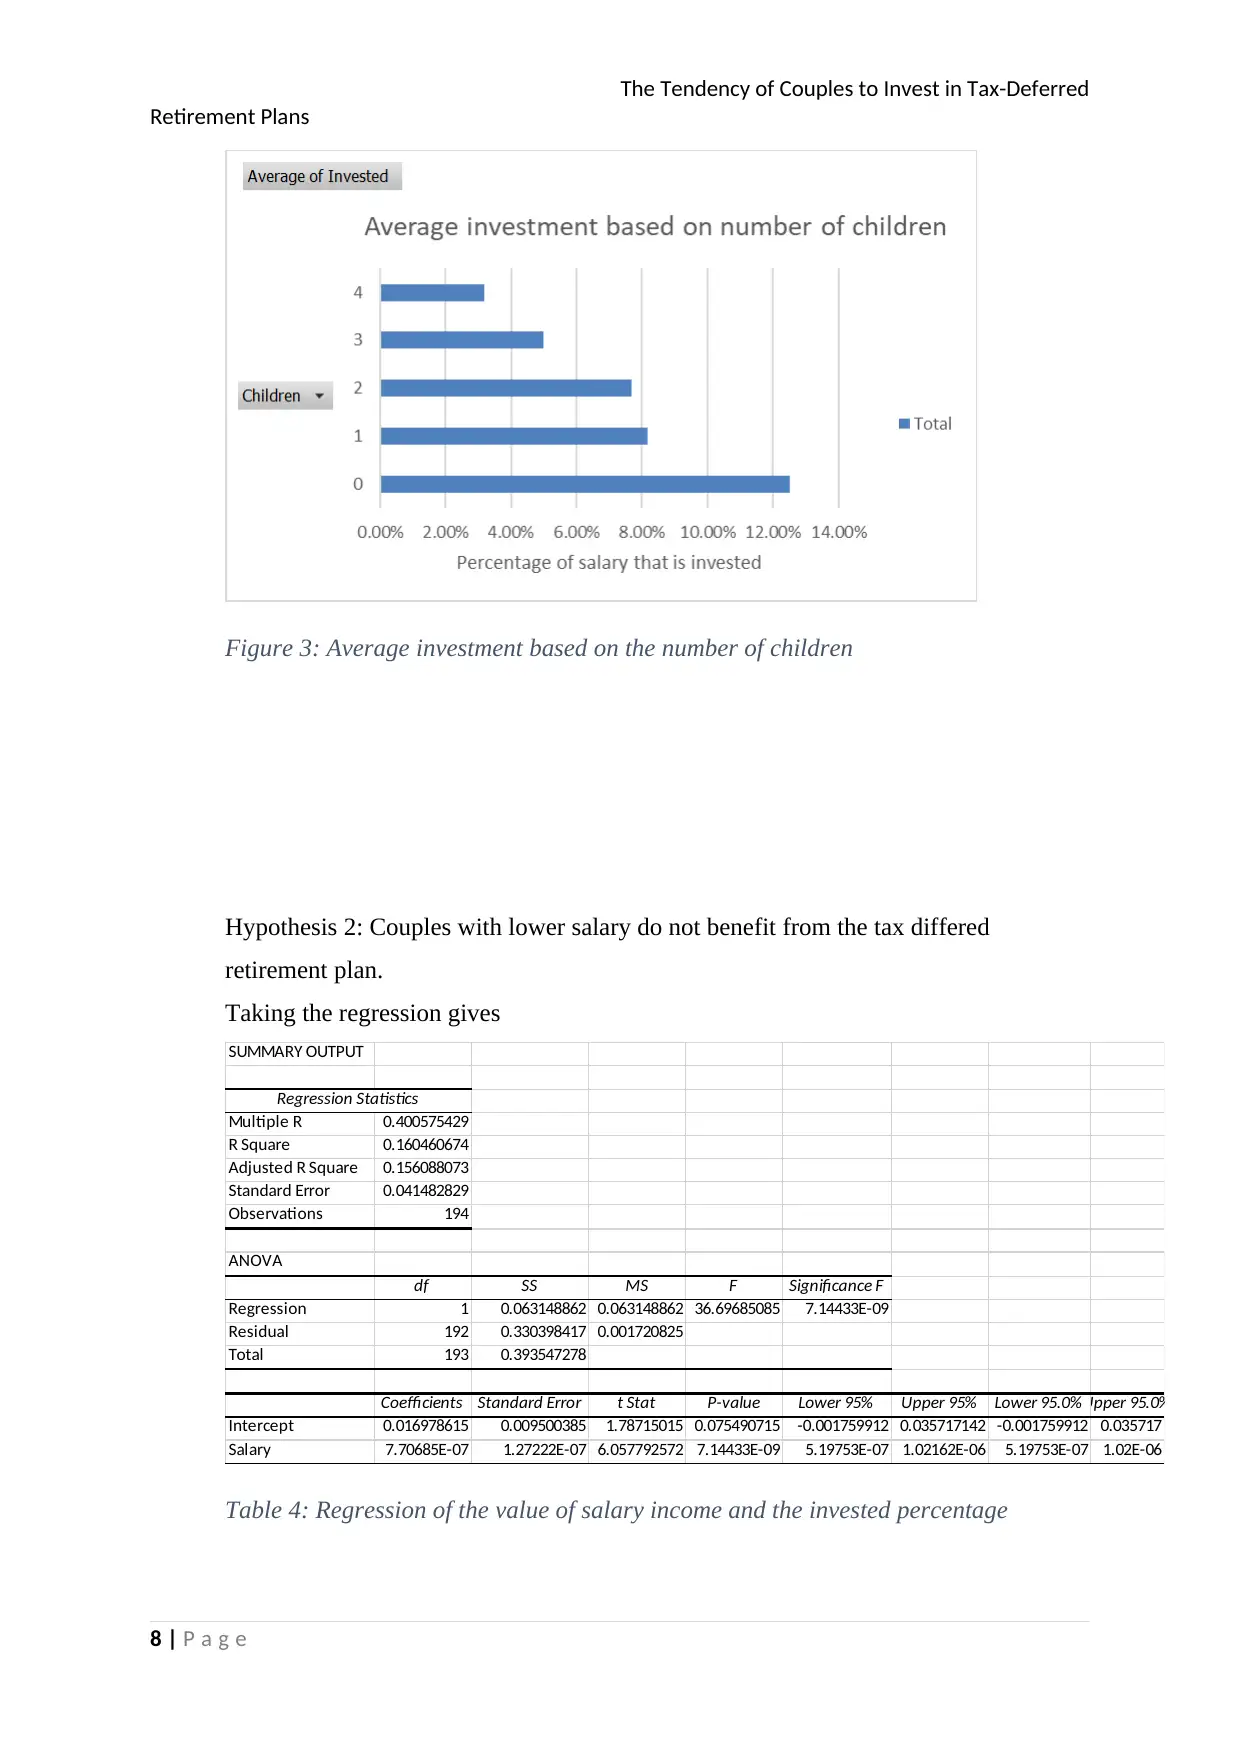
0 12.51%
1 8.18%
2 7.67%
3 4.98%
4 3.19%
Table 3: Number of children and the average percentage invested
Its is possible to derive the average percentage that is invested by couples that have
various number of children. This indicates that as the number of children increases
there is a reduction in the percentage of the salary that is directed to investment in the
pension plan. This can be attributed to the increased expenditure in the children’s
upkeep that leaves the couples with less and less amount to invest ((Lynn & Clarke
2010).
Th information is presented in a chart as shown below.
7 | P a g e
Retirement Plans
t-Test: Two-Sample Assuming Unequal Variances
Children Invested
Mean 1.984536082 0.071628866
Variance 0.90649538 0.002039105
Observations 194 194
Hypothesized Mean Difference 0
df 194
t Stat 27.95271924
P(T<=t) one-tail 2.96527E-70
t Critical one-tail 1.652745977
P(T<=t) two-tail 5.93053E-70
t Critical two-tail 1.972267533
Table 2: The two sampled t-test for the number of children and the amount invested
From this output we use both the t critical value as well as the p value to make a
decision.
The value of the t critical is 1.97 which is lower than t stat which is 27.95. hence the
decision is to reject the null hypothesis and conclude that the means of the variables
are not the same. This is also supported by the P value for the two tailed test which is
less than the value of the alpha.
Deducing a pivot table
Pivot table
Row Labels Average of Invested
0 12.51%
1 8.18%
2 7.67%
3 4.98%
4 3.19%
Table 3: Number of children and the average percentage invested
Its is possible to derive the average percentage that is invested by couples that have
various number of children. This indicates that as the number of children increases
there is a reduction in the percentage of the salary that is directed to investment in the
pension plan. This can be attributed to the increased expenditure in the children’s
upkeep that leaves the couples with less and less amount to invest ((Lynn & Clarke
2010).
Th information is presented in a chart as shown below.
7 | P a g e
Paraphrase This Document
Need a fresh take? Get an instant paraphrase of this document with our AI Paraphraser
The Tendency of Couples to Invest in Tax-Deferred
Retirement Plans
Figure 3: Average investment based on the number of children
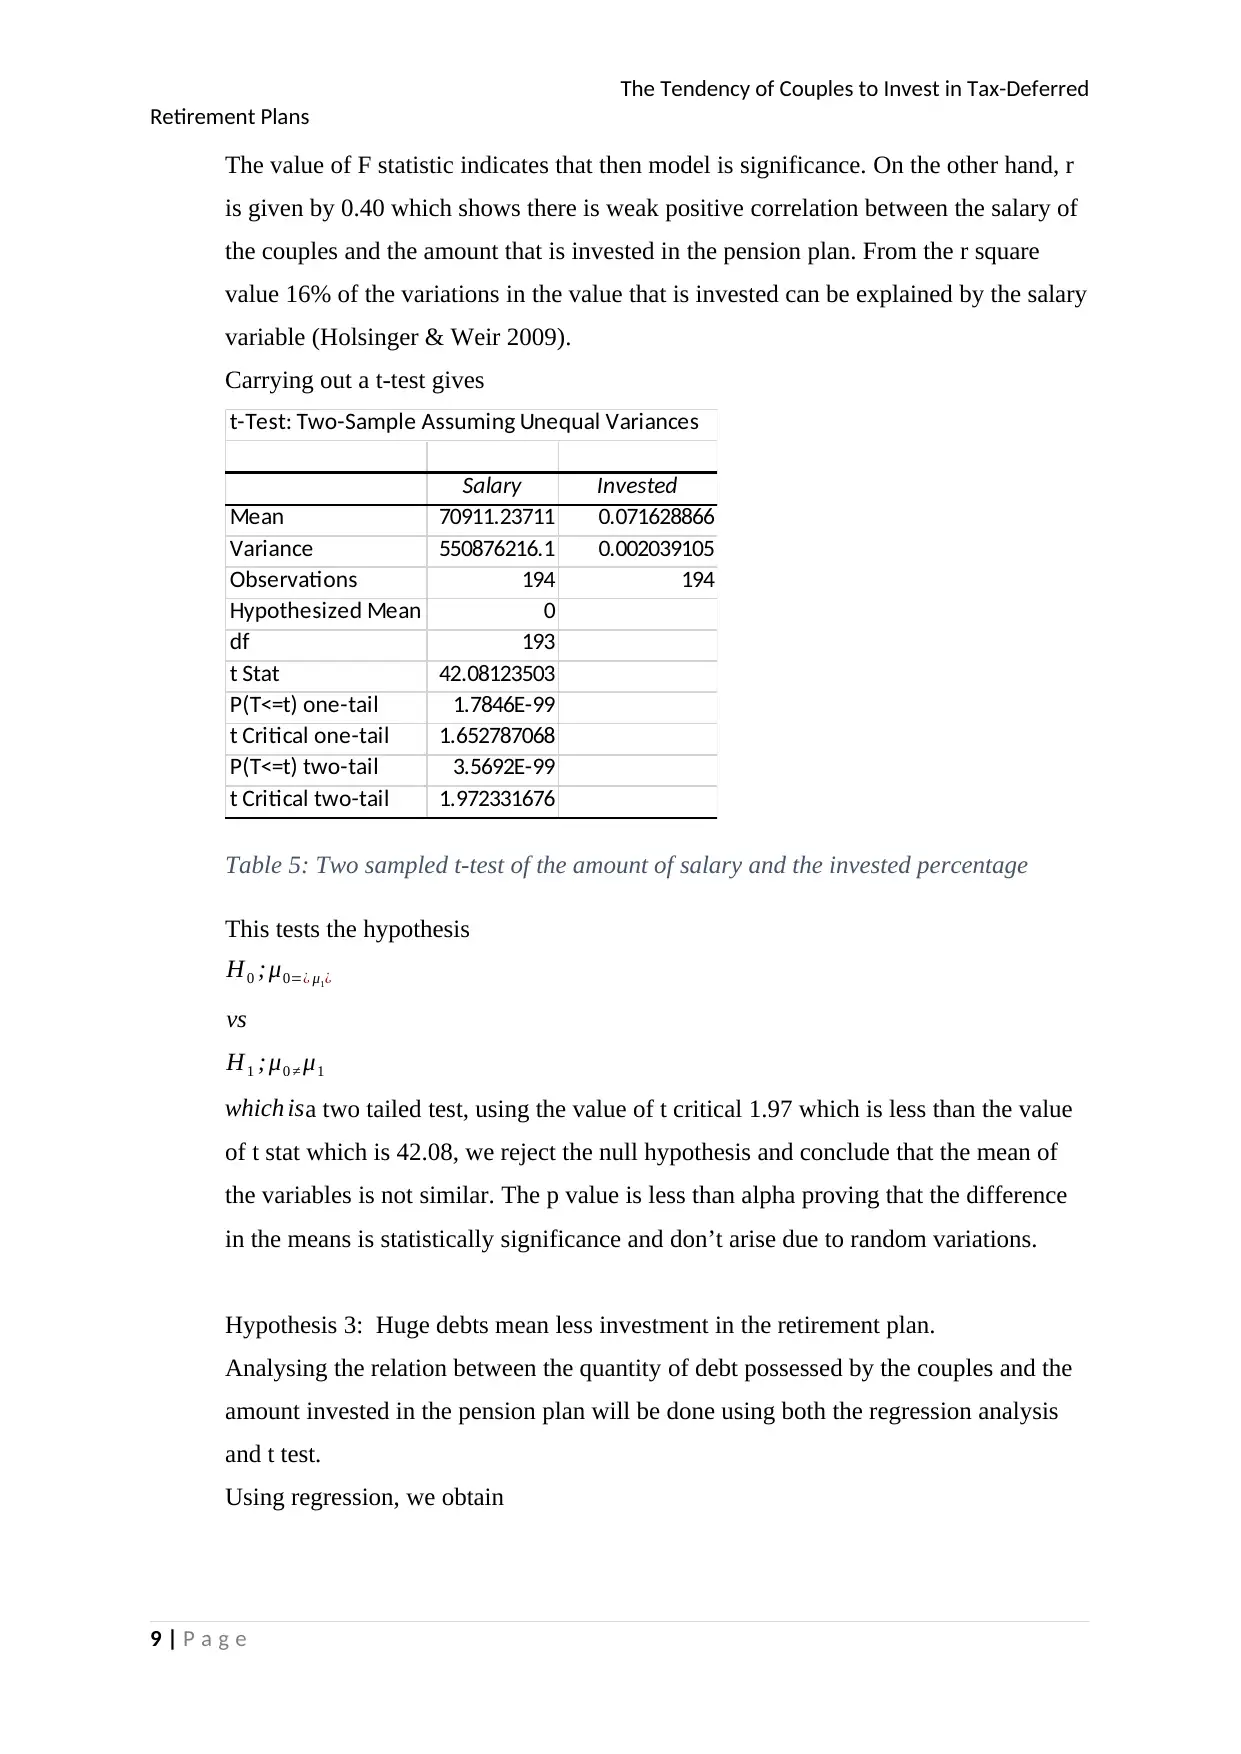
Hypothesis 2: Couples with lower salary do not benefit from the tax differed
retirement plan.
Taking the regression gives
SUMMARY OUTPUT
Regression Statistics
Multiple R 0.400575429
R Square 0.160460674
Adjusted R Square 0.156088073
Standard Error 0.041482829
Observations 194
ANOVA
df SS MS F Significance F
Regression 1 0.063148862 0.063148862 36.69685085 7.14433E-09
Residual 192 0.330398417 0.001720825
Total 193 0.393547278
Coefficients Standard Error t Stat P-value Lower 95% Upper 95% Lower 95.0%Upper 95.0%
Intercept 0.016978615 0.009500385 1.78715015 0.075490715 -0.001759912 0.035717142 -0.001759912 0.035717
Salary 7.70685E-07 1.27222E-07 6.057792572 7.14433E-09 5.19753E-07 1.02162E-06 5.19753E-07 1.02E-06
Table 4: Regression of the value of salary income and the invested percentage
8 | P a g e
Retirement Plans
Figure 3: Average investment based on the number of children
Hypothesis 2: Couples with lower salary do not benefit from the tax differed
retirement plan.
Taking the regression gives
SUMMARY OUTPUT
Regression Statistics
Multiple R 0.400575429
R Square 0.160460674
Adjusted R Square 0.156088073
Standard Error 0.041482829
Observations 194
ANOVA
df SS MS F Significance F
Regression 1 0.063148862 0.063148862 36.69685085 7.14433E-09
Residual 192 0.330398417 0.001720825
Total 193 0.393547278
Coefficients Standard Error t Stat P-value Lower 95% Upper 95% Lower 95.0%Upper 95.0%
Intercept 0.016978615 0.009500385 1.78715015 0.075490715 -0.001759912 0.035717142 -0.001759912 0.035717
Salary 7.70685E-07 1.27222E-07 6.057792572 7.14433E-09 5.19753E-07 1.02162E-06 5.19753E-07 1.02E-06
Table 4: Regression of the value of salary income and the invested percentage
8 | P a g e
The Tendency of Couples to Invest in Tax-Deferred
Retirement Plans
The value of F statistic indicates that then model is significance. On the other hand, r
is given by 0.40 which shows there is weak positive correlation between the salary of
the couples and the amount that is invested in the pension plan. From the r square
value 16% of the variations in the value that is invested can be explained by the salary
variable (Holsinger & Weir 2009).
Carrying out a t-test gives
t-Test: Two-Sample Assuming Unequal Variances
Salary Invested
Mean 70911.23711 0.071628866
Variance 550876216.1 0.002039105
Observations 194 194
Hypothesized Mean Difference 0
df 193
t Stat 42.08123503
P(T<=t) one-tail 1.7846E-99
t Critical one-tail 1.652787068
P(T<=t) two-tail 3.5692E-99
t Critical two-tail 1.972331676
Table 5: Two sampled t-test of the amount of salary and the invested percentage
This tests the hypothesis
H0 ;μ0=¿ μ1¿
vs
H1 ; μ0 ≠ μ1
which isa two tailed test, using the value of t critical 1.97 which is less than the value
of t stat which is 42.08, we reject the null hypothesis and conclude that the mean of
the variables is not similar. The p value is less than alpha proving that the difference
in the means is statistically significance and don’t arise due to random variations.
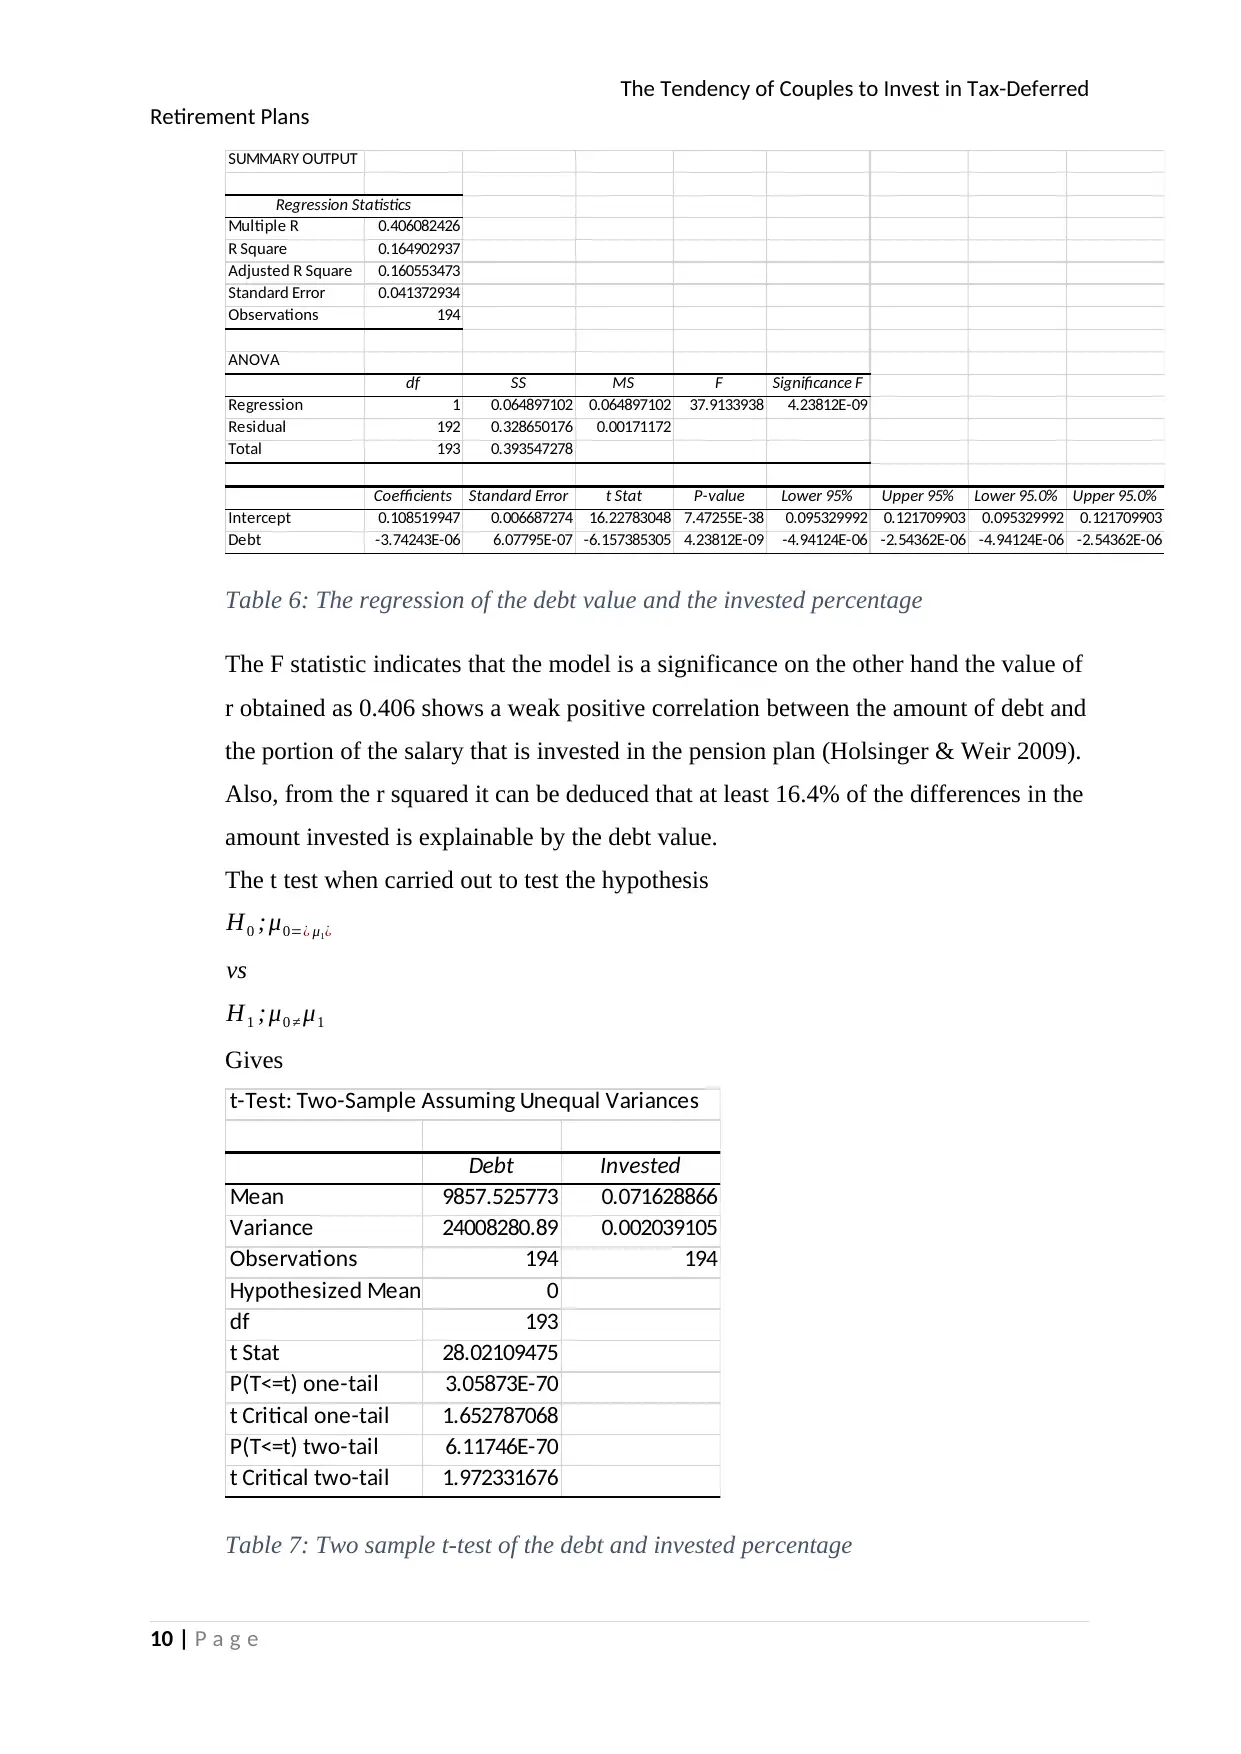
Hypothesis 3: Huge debts mean less investment in the retirement plan.
Analysing the relation between the quantity of debt possessed by the couples and the
amount invested in the pension plan will be done using both the regression analysis
and t test.
Using regression, we obtain
9 | P a g e
Retirement Plans
The value of F statistic indicates that then model is significance. On the other hand, r
is given by 0.40 which shows there is weak positive correlation between the salary of
the couples and the amount that is invested in the pension plan. From the r square
value 16% of the variations in the value that is invested can be explained by the salary
variable (Holsinger & Weir 2009).
Carrying out a t-test gives
t-Test: Two-Sample Assuming Unequal Variances
Salary Invested
Mean 70911.23711 0.071628866
Variance 550876216.1 0.002039105
Observations 194 194
Hypothesized Mean Difference 0
df 193
t Stat 42.08123503
P(T<=t) one-tail 1.7846E-99
t Critical one-tail 1.652787068
P(T<=t) two-tail 3.5692E-99
t Critical two-tail 1.972331676
Table 5: Two sampled t-test of the amount of salary and the invested percentage
This tests the hypothesis
H0 ;μ0=¿ μ1¿
vs
H1 ; μ0 ≠ μ1
which isa two tailed test, using the value of t critical 1.97 which is less than the value
of t stat which is 42.08, we reject the null hypothesis and conclude that the mean of
the variables is not similar. The p value is less than alpha proving that the difference
in the means is statistically significance and don’t arise due to random variations.
Hypothesis 3: Huge debts mean less investment in the retirement plan.
Analysing the relation between the quantity of debt possessed by the couples and the
amount invested in the pension plan will be done using both the regression analysis
and t test.
Using regression, we obtain
9 | P a g e
⊘ This is a preview!⊘
Do you want full access?
Subscribe today to unlock all pages.
Trusted by 1+ million students worldwide
The Tendency of Couples to Invest in Tax-Deferred
Retirement Plans
SUMMARY OUTPUT
Regression Statistics
Multiple R 0.406082426
R Square 0.164902937
Adjusted R Square 0.160553473
Standard Error 0.041372934
Observations 194
ANOVA
df SS MS F Significance F
Regression 1 0.064897102 0.064897102 37.9133938 4.23812E-09
Residual 192 0.328650176 0.00171172
Total 193 0.393547278
Coefficients Standard Error t Stat P-value Lower 95% Upper 95% Lower 95.0% Upper 95.0%
Intercept 0.108519947 0.006687274 16.22783048 7.47255E-38 0.095329992 0.121709903 0.095329992 0.121709903
Debt -3.74243E-06 6.07795E-07 -6.157385305 4.23812E-09 -4.94124E-06 -2.54362E-06 -4.94124E-06 -2.54362E-06
Table 6: The regression of the debt value and the invested percentage
The F statistic indicates that the model is a significance on the other hand the value of
r obtained as 0.406 shows a weak positive correlation between the amount of debt and
the portion of the salary that is invested in the pension plan (Holsinger & Weir 2009).
Also, from the r squared it can be deduced that at least 16.4% of the differences in the
amount invested is explainable by the debt value.
The t test when carried out to test the hypothesis
H0 ;μ0=¿ μ1¿
vs
H1 ;μ0 ≠ μ1
Gives
t-Test: Two-Sample Assuming Unequal Variances
Debt Invested
Mean 9857.525773 0.071628866
Variance 24008280.89 0.002039105
Observations 194 194
Hypothesized Mean Difference 0
df 193
t Stat 28.02109475
P(T<=t) one-tail 3.05873E-70
t Critical one-tail 1.652787068
P(T<=t) two-tail 6.11746E-70
t Critical two-tail 1.972331676
Table 7: Two sample t-test of the debt and invested percentage
10 | P a g e
Paraphrase This Document
Need a fresh take? Get an instant paraphrase of this document with our AI Paraphraser
The Tendency of Couples to Invest in Tax-Deferred
Retirement Plans
From the table above, we apply the p value to conclude that the differences between
the two variables are statistically significance and don’t arise due to random
occurrences.
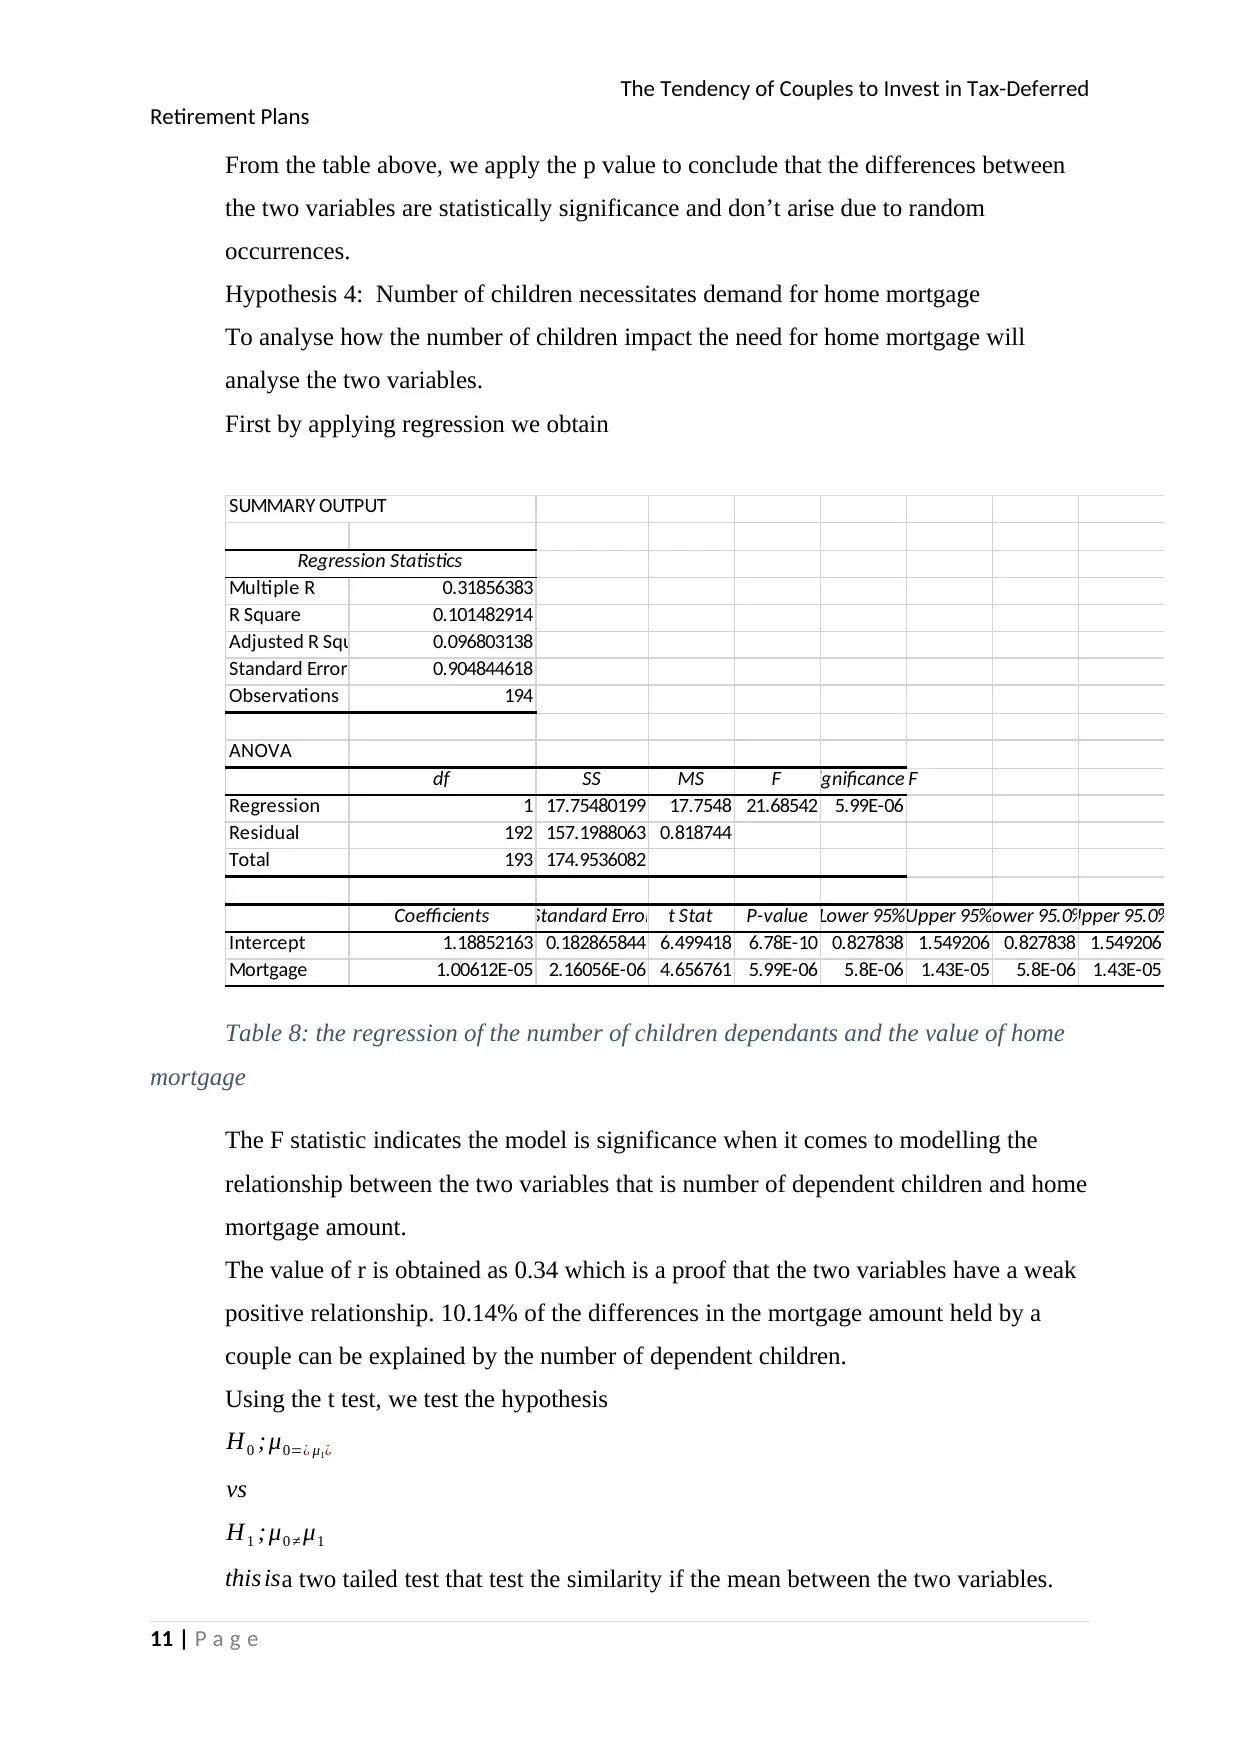
Hypothesis 4: Number of children necessitates demand for home mortgage
To analyse how the number of children impact the need for home mortgage will
analyse the two variables.
First by applying regression we obtain
SUMMARY OUTPUT
Regression Statistics
Multiple R 0.31856383
R Square 0.101482914
Adjusted R Square 0.096803138
Standard Error 0.904844618
Observations 194
ANOVA
df SS MS F Significance F
Regression 1 17.75480199 17.7548 21.68542 5.99E-06
Residual 192 157.1988063 0.818744
Total 193 174.9536082
Coefficients Standard Error t Stat P-value Lower 95%Upper 95%Lower 95.0%Upper 95.0%
Intercept 1.18852163 0.182865844 6.499418 6.78E-10 0.827838 1.549206 0.827838 1.549206
Mortgage 1.00612E-05 2.16056E-06 4.656761 5.99E-06 5.8E-06 1.43E-05 5.8E-06 1.43E-05
Table 8: the regression of the number of children dependants and the value of home
mortgage
The F statistic indicates the model is significance when it comes to modelling the
relationship between the two variables that is number of dependent children and home
mortgage amount.
The value of r is obtained as 0.34 which is a proof that the two variables have a weak
positive relationship. 10.14% of the differences in the mortgage amount held by a
couple can be explained by the number of dependent children.
Using the t test, we test the hypothesis
H0 ;μ0=¿ μ1¿
vs
H1 ;μ0 ≠ μ1
this isa two tailed test that test the similarity if the mean between the two variables.
11 | P a g e
Retirement Plans
From the table above, we apply the p value to conclude that the differences between
the two variables are statistically significance and don’t arise due to random
occurrences.
Hypothesis 4: Number of children necessitates demand for home mortgage
To analyse how the number of children impact the need for home mortgage will
analyse the two variables.
First by applying regression we obtain
SUMMARY OUTPUT
Regression Statistics
Multiple R 0.31856383
R Square 0.101482914
Adjusted R Square 0.096803138
Standard Error 0.904844618
Observations 194
ANOVA
df SS MS F Significance F
Regression 1 17.75480199 17.7548 21.68542 5.99E-06
Residual 192 157.1988063 0.818744
Total 193 174.9536082
Coefficients Standard Error t Stat P-value Lower 95%Upper 95%Lower 95.0%Upper 95.0%
Intercept 1.18852163 0.182865844 6.499418 6.78E-10 0.827838 1.549206 0.827838 1.549206
Mortgage 1.00612E-05 2.16056E-06 4.656761 5.99E-06 5.8E-06 1.43E-05 5.8E-06 1.43E-05
Table 8: the regression of the number of children dependants and the value of home
mortgage
The F statistic indicates the model is significance when it comes to modelling the
relationship between the two variables that is number of dependent children and home
mortgage amount.
The value of r is obtained as 0.34 which is a proof that the two variables have a weak
positive relationship. 10.14% of the differences in the mortgage amount held by a
couple can be explained by the number of dependent children.
Using the t test, we test the hypothesis
H0 ;μ0=¿ μ1¿
vs
H1 ;μ0 ≠ μ1
this isa two tailed test that test the similarity if the mean between the two variables.
11 | P a g e
The Tendency of Couples to Invest in Tax-Deferred
Retirement Plans
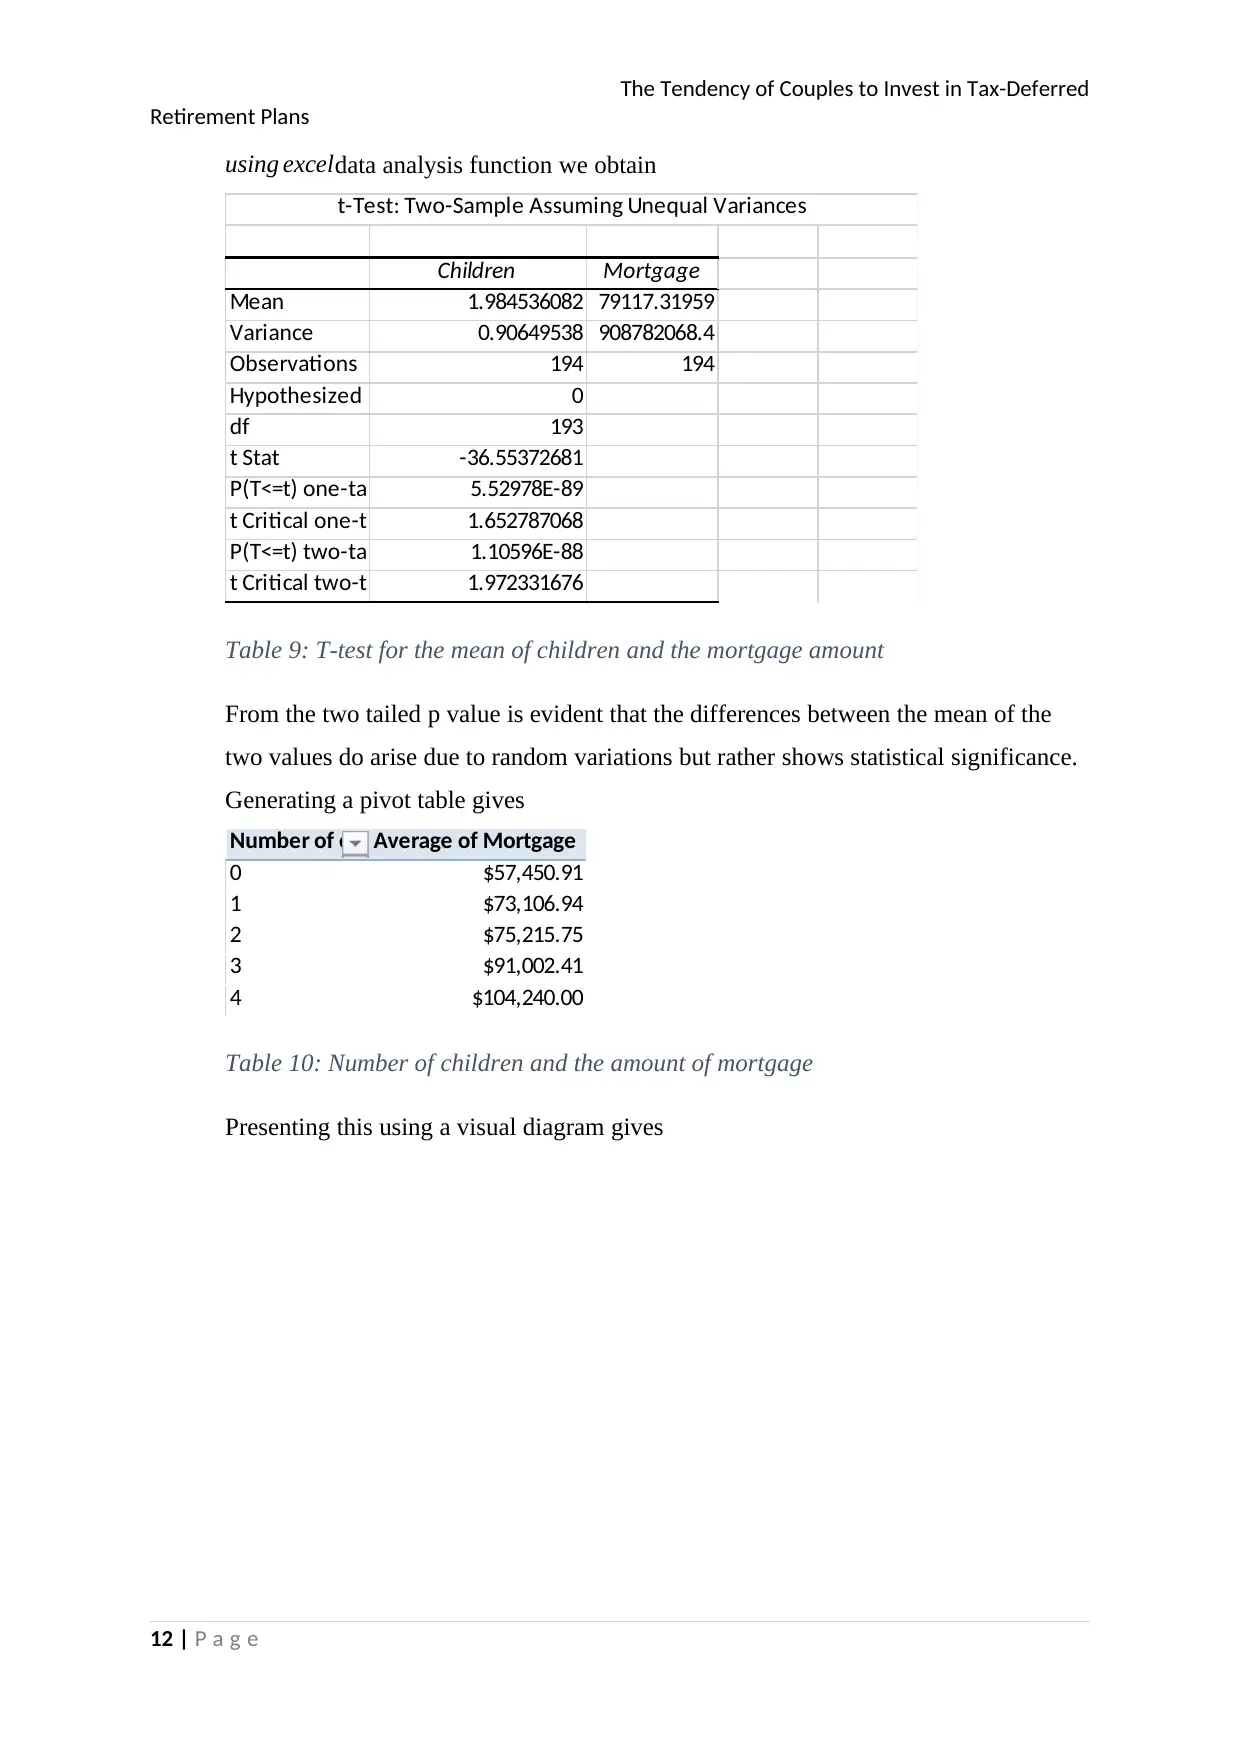
using exceldata analysis function we obtain
Children Mortgage
Mean 1.984536082 79117.31959
Variance 0.90649538 908782068.4
Observations 194 194
Hypothesized Mean Difference 0
df 193
t Stat -36.55372681
P(T<=t) one-tail 5.52978E-89
t Critical one-tail 1.652787068
P(T<=t) two-tail 1.10596E-88
t Critical two-tail 1.972331676
t-Test: Two-Sample Assuming Unequal Variances
Table 9: T-test for the mean of children and the mortgage amount
From the two tailed p value is evident that the differences between the mean of the
two values do arise due to random variations but rather shows statistical significance.
Generating a pivot table gives
Number of childrenAverage of Mortgage
0 $57,450.91
1 $73,106.94
2 $75,215.75
3 $91,002.41
4 $104,240.00
Table 10: Number of children and the amount of mortgage
Presenting this using a visual diagram gives
12 | P a g e
Retirement Plans
using exceldata analysis function we obtain
Children Mortgage
Mean 1.984536082 79117.31959
Variance 0.90649538 908782068.4
Observations 194 194
Hypothesized Mean Difference 0
df 193
t Stat -36.55372681
P(T<=t) one-tail 5.52978E-89
t Critical one-tail 1.652787068
P(T<=t) two-tail 1.10596E-88
t Critical two-tail 1.972331676
t-Test: Two-Sample Assuming Unequal Variances
Table 9: T-test for the mean of children and the mortgage amount
From the two tailed p value is evident that the differences between the mean of the
two values do arise due to random variations but rather shows statistical significance.
Generating a pivot table gives
Number of childrenAverage of Mortgage
0 $57,450.91
1 $73,106.94
2 $75,215.75
3 $91,002.41
4 $104,240.00
Table 10: Number of children and the amount of mortgage
Presenting this using a visual diagram gives
12 | P a g e
⊘ This is a preview!⊘
Do you want full access?
Subscribe today to unlock all pages.
Trusted by 1+ million students worldwide
1 out of 17
Related Documents


Your All-in-One AI-Powered Toolkit for Academic Success.
+13062052269
info@desklib.com
Available 24*7 on WhatsApp / Email
![[object Object]](/_next/static/media/star-bottom.7253800d.svg)
Unlock your academic potential
Copyright © 2020–2026 A2Z Services. All Rights Reserved. Developed and managed by ZUCOL.