Retirement Investment Trends: A Data Analysis Report (Finance)
VerifiedAdded on 2022/12/09
|14
|2442
|97
Report
AI Summary
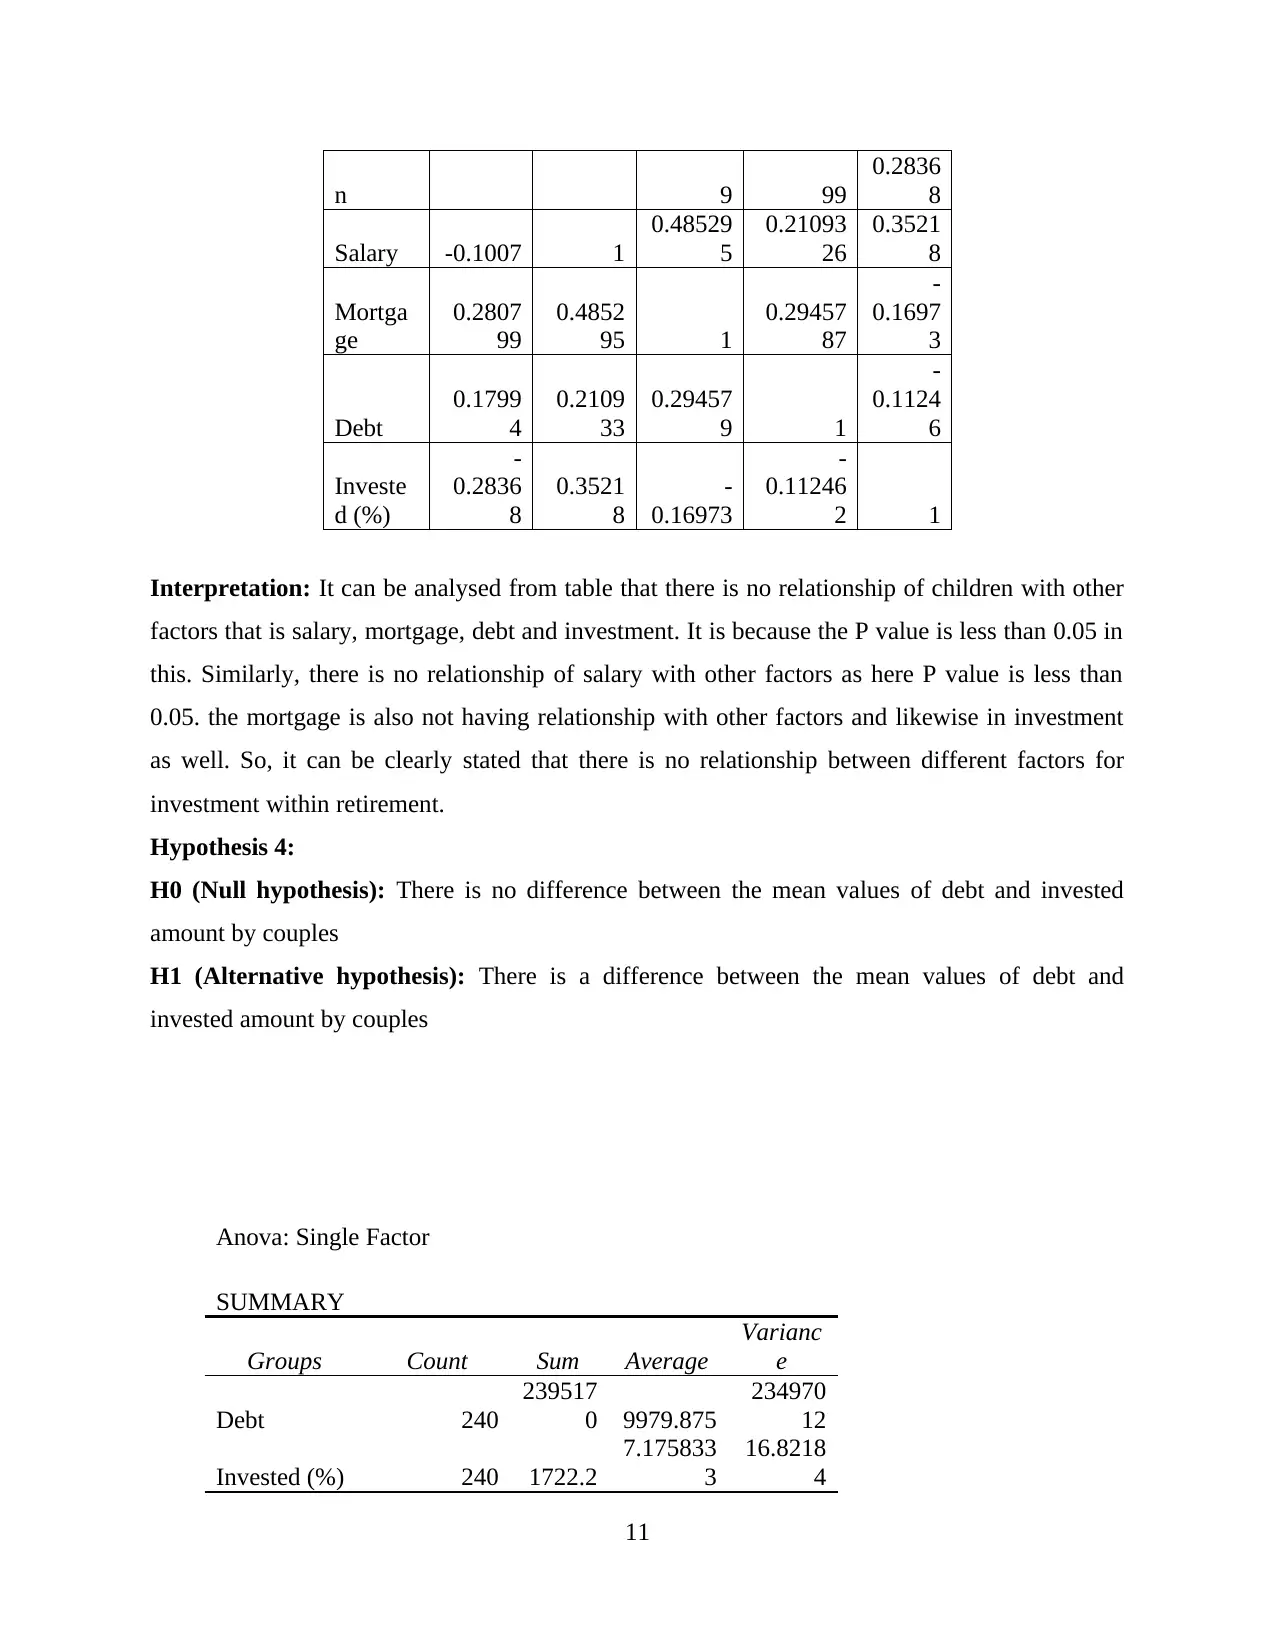
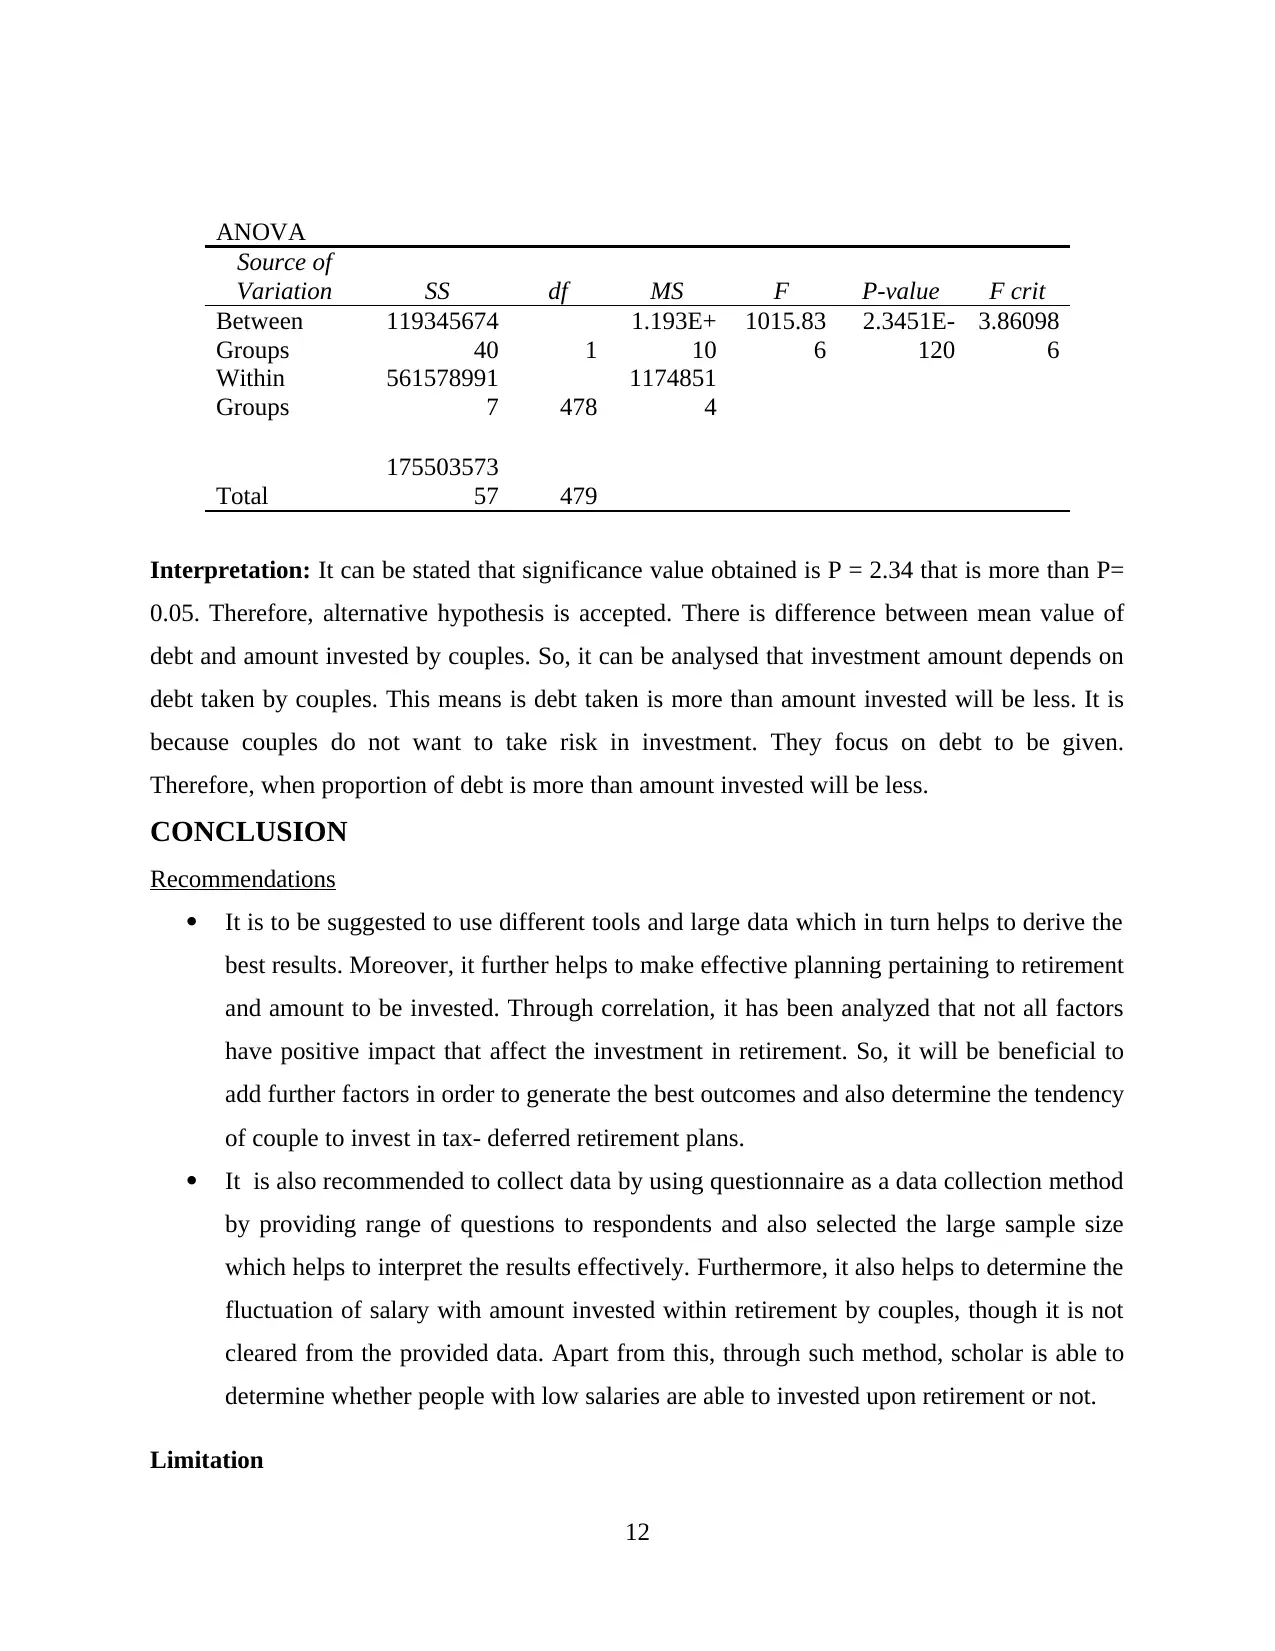
This report presents an analysis of couples' retirement investment behavior, based on a provided dataset. The study investigates the influence of various factors, including salary, mortgage, debt, and the number of children, on the amount invested in tax-deferred retirement plans. The research e...
Read More
Contribute Materials
Your contribution can guide someone’s learning journey. Share your
documents today.

Data analysis
1
1
Secure Best Marks with AI Grader
Need help grading? Try our AI Grader for instant feedback on your assignments.

Table of Contents
Introduction......................................................................................................................................3
Research design...............................................................................................................................3
Data analysis and findings...............................................................................................................8
CONCLUSION..............................................................................................................................11
Recommendations......................................................................................................................11
REFERENCES..............................................................................................................................13
2

Introduction
Explain purpose of study
There are many people who do advance planning of retirement that what they will do
after that. However, it is necessary to do planning so that it is identified from where income can
be generated. But the main concern in this is tax (Ho, Tumkaya, and Claridge-Chang, , 2019).
This is because people have to give a huge amount of tax. So, there are various schemes and
investment in which people can invest after retirement. The common scheme is tax deferred
retirement plans. They are those plan which is opted by couples to invest in. The financial
advisors give advice to invest in various options as per the salary, debt, etc. Basically tax
deferred investment plan is a safe source of investment for old age people. However, there are
various factors such as mortgage, debt, etc. which highly impact on investment done in
retirement age. Hence, couples analyse all these factors before investment. This gives them
insight on how much investment should be done, what proportion must be maintained to balance
debt and investment, etc.
Thus, the main purpose of study is to find out tendency of couples who like to invest in
tax deferred retirement scheme. The study will find out that which group that is couple with low
salary or high salary invest in tax deferred retirement scheme. Along with that, the study will
evaluate proportion of couples who invest in tax deferred scheme and how much is their salary.
Hence, the study will evaluate is only high salary couples invest as they are having low debt and
mortgage or low income couples (Jackson, and Bazeley, 2019). This topic is interesting as it will
enable in finding out is investment related to salary, debt, mortgage or not. So, it can be
examined and relevant outcomes are obtained from that.
Research question
The research question is to find out tendency of couples who invest in tax deferred
retirement plans.
Hypothesis 1: To access the relationship with number of children and Mortgage
Hypothesis 2: To ascertain the association between salaries earning and amount invested for
retirement
Hypothesis 3: To determine the relationship between different factors for invested within
retirements
Hypothesis 4: To examine the relationship between debt and invested amount by couples
3

Research design
Statistical methods used for study
In order to determine the overall results and association between the variables, excel is used in
which different tools is applied. Such that in order to prove the hypothesis 1 and 2, regression
analysis has been used. Moreover, for 3rd hypothesis, Correlation used whereas for last, anova
one factor is used that determine the significance values. Therefore, it helps to examine the
relationship and factors that cause direct impact upon the investment upon retirement. In addition
to this, by using excel, scholar tries to make efficient planning of a statistical inquiry and
interpret the quantitative data in better manner. In the study there are many statistical methods
which are used. This has enabled in obtaining relevant outcomes (Miles, , Huberman, and
Saldaña, 2018). However, the use of method has enabled in analysing data and testing of
hypothesis. Thus, the methods used are as follows:
Regression – this method is used to find out the significance value and test relationship between
two variables. Here, the main purpose of using regression is to test hypothesis and find out P
value.
Descriptive – The method was used to find out mean, mode, medina, standard deviation, etc. of
data. These all were calculated of each variable that is salary, mortgage, investment, etc. The
main purpose was to find out average of salary, mortgage, etc. of overall data set.
Describe data used for study
Data set used for the present study is as mentioned below:
Variable Name Variable Description
Couple Couple ID
City The city the couple living in
Children Number of dependent children (0≤ n ≤4)
Salary (USD) Combined annual salary of husband and wife
Mortgage (USD) Outstanding mortgage on home
Debt (USD) Average amount of (non-mortgage) debt on other items (including car)
Invested (%) Percentage of combined income invested in tax-deferred retirement
plans (0%≤ n ≤ 15 %)
Descriptive statistics:
4
Secure Best Marks with AI Grader
Need help grading? Try our AI Grader for instant feedback on your assignments.

Children
Children
Mean
2.01666
7
Standard Error
0.06627
3
Median 2
Mode 2
Standard
Deviation
1.02670
1
Sample
Variance
1.05411
4
Kurtosis -0.53379
Skewness -0.05691
Range 4
Minimum 0
Maximum 4
Sum 484
Count 240
Row
Labels
Count of Invested
(%)
0 17
1 57
2 87
3 63
4 16
Grand
Total 240
5
Children
Mean
2.01666
7
Standard Error
0.06627
3
Median 2
Mode 2
Standard
Deviation
1.02670
1
Sample
Variance
1.05411
4
Kurtosis -0.53379
Skewness -0.05691
Range 4
Minimum 0
Maximum 4
Sum 484
Count 240
Row
Labels
Count of Invested
(%)
0 17
1 57
2 87
3 63
4 16
Grand
Total 240
5

0 1 2 3 4
0
10
20
30
40
50
60
70
80
90
17
57
87
63
16
Number of children
Interpretation- it can be interpreted from graph that mean obtained dis 2.01 and median is 2.
The SD is 1.026. there are 57 couples who are having 1 child, 87 couple who are having 2
children, 63 having 3 children and 16 having 4 children.
Salary
Salary
Mean
69605.0208
3
Standard Error
1484.97797
9
Median 70940
Mode 86930
Standard
Deviation
23005.1799
2
Sample
Variance
529238303.
2
Kurtosis
-
0.43598211
3
Skewness 0.24439995
Range 108520
Minimum 23540
Maximum 132060
Sum 16705205
6

Count 240
Interpretation- By table it can be analysed that the mean of salary is 69605.0 and median is
70940. However, the SD is 23305.1 and mode is 86930.
Mortgage
Mortgage
Mean 78531.375
Standard Error
1887.30739
8
Median 78150
Mode 114050
Standard
Deviation
29238.0404
9
Sample
Variance
854863011.
9
Kurtosis
0.23694340
5
Skewness
0.04616192
9
Range 180390
Minimum 5070
Maximum 185460
Sum 18847530
Count 240
Interpretation- it can be stated from table that mean value obtained is 78531.3 and median is
78150. Also, SD is 29238.0 and mode is 114050.
Debt
Debt
Mean
9979.87
5
Standard
Error
312.896
5
Median 9845
Mode 11740
Standard 4847.37
7
Paraphrase This Document
Need a fresh take? Get an instant paraphrase of this document with our AI Paraphraser

Deviation 2
Sample
Variance
2349701
2
Kurtosis -0.13606
Skewness
0.40716
1
Range 25070
Minimum 0
Maximum 25070
Sum 2395170
Count 240
Interpretation- it is evaluated that mean of debt is 9979.8 and median is 9845. Moreover, the SD
is 4847.3 and mode is 11740.
Invested
Invested (%)
Mean
7.17583
3
Standard Error
0.26474
7
Median 7.2
Mode 0
Standard
Deviation
4.10144
4
Sample
Variance
16.8218
4
Kurtosis
-
0.67594
Skewness
0.08901
6
Range 15
Minimum 0
Maximum 15
Sum 1722.2
Count 240
Interpretation- the table state that mean of investment is 7.17 and median is 7.2. the SD is 4.10
and mode is 0.
8
Sample
Variance
2349701
2
Kurtosis -0.13606
Skewness
0.40716
1
Range 25070
Minimum 0
Maximum 25070
Sum 2395170
Count 240
Interpretation- it is evaluated that mean of debt is 9979.8 and median is 9845. Moreover, the SD
is 4847.3 and mode is 11740.
Invested
Invested (%)
Mean
7.17583
3
Standard Error
0.26474
7
Median 7.2
Mode 0
Standard
Deviation
4.10144
4
Sample
Variance
16.8218
4
Kurtosis
-
0.67594
Skewness
0.08901
6
Range 15
Minimum 0
Maximum 15
Sum 1722.2
Count 240
Interpretation- the table state that mean of investment is 7.17 and median is 7.2. the SD is 4.10
and mode is 0.
8

Data analysis and findings
Hypothesis 1:
Null hypothesis (H0): There is no statistical association between the mean difference of number
of children of couples and Mortgage
Alternative hypothesis (H1): There is a statistical association between the mean difference of
number of children of couples and Mortgage
Regression Statistics
Multiple R
0.28079
9
R Square
0.07884
8
Adjusted R
Square
0.07497
8
Standard
Error
0.98746
1
Observations 240
ANOVA
df SS MS F
Significanc
e F
Regression 1
19.8644
5
19.8644
5
20.3721
4 0.00
Residual 238
232.068
9
0.97507
9
Total 239
251.933
3
Interpretation: It can be interpreted from table the significance value obtained is P= 0.00 which
is less than P= 0.05. thus, here null hypothesis is rejected. It means that there is no difference
between number of children of couples and mortgage. Here, it is said that taking of mortgage
does not depend on how many children does couple has. They take mortgage on basis of their
needs and salary which they earn. So, if there are more number of children it does mean couple
will take mortgage.
Hypothesis 2:
9

Null hypothesis: There is no statistical difference between the mean value of salaries earn
by couples to amount invested for retirement
Alternative hypothesis: There is a statistical difference between the mean value of salaries
earn by couples to amount invested for retirement
SUMMARY OUTPUT
Regression Statistics
Multiple R 0.35218
R Square 0.12403
Adjusted R Square 0.12035
Standard Error
21576.4
8
Observations 240
ANOVA
df SS MS F Significance F
Regression 1
1.57E+1
0
1.57E+1
0
33.6989
3 2.04487E-08
Residual 238
1.11E+1
1
4.66E+0
8
Total 239
1.26E+1
1
Interpretation: from table it can be analysed that the significance value obtained is P= 2.044
that is more than P= 0.05. So, alternative hypothesis is accepted. This means there is difference
in mean value of salaries and amount invested by couples in tax referred investment. The amount
invested in tax referred depends on salary earned. When couple earn high salary then amount
invested is high in tax investment. But on other hand if salary earn is low than amount invested is
low is tax deferred. Thus, investment depends on salary earned by couples.
Hypothesis 3:
To ascertain the relationship between different factors within retirements
Childre
n Salary
Mortga
ge Debt
Invest
ed (%)
Childre 1 -0.1007 0.28079 0.17993 -
10
Secure Best Marks with AI Grader
Need help grading? Try our AI Grader for instant feedback on your assignments.

n 9 99
0.2836
8
Salary -0.1007 1
0.48529
5
0.21093
26
0.3521
8
Mortga
ge
0.2807
99
0.4852
95 1
0.29457
87
-
0.1697
3
Debt
0.1799
4
0.2109
33
0.29457
9 1
-
0.1124
6
Investe
d (%)
-
0.2836
8
0.3521
8
-
0.16973
-
0.11246
2 1
Interpretation: It can be analysed from table that there is no relationship of children with other
factors that is salary, mortgage, debt and investment. It is because the P value is less than 0.05 in
this. Similarly, there is no relationship of salary with other factors as here P value is less than
0.05. the mortgage is also not having relationship with other factors and likewise in investment
as well. So, it can be clearly stated that there is no relationship between different factors for
investment within retirement.
Hypothesis 4:
H0 (Null hypothesis): There is no difference between the mean values of debt and invested
amount by couples
H1 (Alternative hypothesis): There is a difference between the mean values of debt and
invested amount by couples
Anova: Single Factor
SUMMARY
Groups Count Sum Average
Varianc
e
Debt 240
239517
0 9979.875
234970
12
Invested (%) 240 1722.2
7.175833
3
16.8218
4
11
0.2836
8
Salary -0.1007 1
0.48529
5
0.21093
26
0.3521
8
Mortga
ge
0.2807
99
0.4852
95 1
0.29457
87
-
0.1697
3
Debt
0.1799
4
0.2109
33
0.29457
9 1
-
0.1124
6
Investe
d (%)
-
0.2836
8
0.3521
8
-
0.16973
-
0.11246
2 1
Interpretation: It can be analysed from table that there is no relationship of children with other
factors that is salary, mortgage, debt and investment. It is because the P value is less than 0.05 in
this. Similarly, there is no relationship of salary with other factors as here P value is less than
0.05. the mortgage is also not having relationship with other factors and likewise in investment
as well. So, it can be clearly stated that there is no relationship between different factors for
investment within retirement.
Hypothesis 4:
H0 (Null hypothesis): There is no difference between the mean values of debt and invested
amount by couples
H1 (Alternative hypothesis): There is a difference between the mean values of debt and
invested amount by couples
Anova: Single Factor
SUMMARY
Groups Count Sum Average
Varianc
e
Debt 240
239517
0 9979.875
234970
12
Invested (%) 240 1722.2
7.175833
3
16.8218
4
11

ANOVA
Source of
Variation SS df MS F P-value F crit
Between
Groups
119345674
40 1
1.193E+
10
1015.83
6
2.3451E-
120
3.86098
6
Within
Groups
561578991
7 478
1174851
4
Total
175503573
57 479
Interpretation: It can be stated that significance value obtained is P = 2.34 that is more than P=
0.05. Therefore, alternative hypothesis is accepted. There is difference between mean value of
debt and amount invested by couples. So, it can be analysed that investment amount depends on
debt taken by couples. This means is debt taken is more than amount invested will be less. It is
because couples do not want to take risk in investment. They focus on debt to be given.
Therefore, when proportion of debt is more than amount invested will be less.
CONCLUSION
Recommendations
It is to be suggested to use different tools and large data which in turn helps to derive the
best results. Moreover, it further helps to make effective planning pertaining to retirement
and amount to be invested. Through correlation, it has been analyzed that not all factors
have positive impact that affect the investment in retirement. So, it will be beneficial to
add further factors in order to generate the best outcomes and also determine the tendency
of couple to invest in tax- deferred retirement plans.
It is also recommended to collect data by using questionnaire as a data collection method
by providing range of questions to respondents and also selected the large sample size
which helps to interpret the results effectively. Furthermore, it also helps to determine the
fluctuation of salary with amount invested within retirement by couples, though it is not
cleared from the provided data. Apart from this, through such method, scholar is able to
determine whether people with low salaries are able to invested upon retirement or not.
Limitation
12

From the above, it is unclear from where the sample is collected, it is because it is clearly
not mentioned about the data collection methods. Apart from this, another limitation pertaining
to the present study is related to sample size which 240 and this is quite low. In order to
determine the relationship between factors to the invested for retirement, it is necessary to have a
sample size of at least 500 that assists to derive better results (Munch, 2017). On the other side,
it is also examined that there are limited factors mentioned within data set which somehow does
not determine the relationship between the amount invested within retirement. Thus, it might
affect the results in positive manner
13
Paraphrase This Document
Need a fresh take? Get an instant paraphrase of this document with our AI Paraphraser

REFERENCES
Books and journals
Ho, J., Tumkaya, T. and Claridge-Chang, A., 2019. Moving beyond P values: data analysis with
estimation graphics. Nature methods, 16(7), pp.565-566.
Jackson, K. and Bazeley, P., 2019. Qualitative data analysis with NVivo. Sage.
Miles, M.B., Huberman, A.M. and Saldaña, J., 2018. Qualitative data analysis: A methods
sourcebook. Sage publications.
Munch, E., 2017. A user’s guide to topological data analysis. Journal of Learning
Analytics, 4(2), pp.47-61.
14
1 out of 14
Related Documents

Your All-in-One AI-Powered Toolkit for Academic Success.
+13062052269
info@desklib.com
Available 24*7 on WhatsApp / Email
Unlock your academic potential
© 2024 | Zucol Services PVT LTD | All rights reserved.