Coventry Station Usage Data Analysis and Linear Forecasting Report
VerifiedAdded on 2020/10/05
|8
|1389
|321
Report
AI Summary
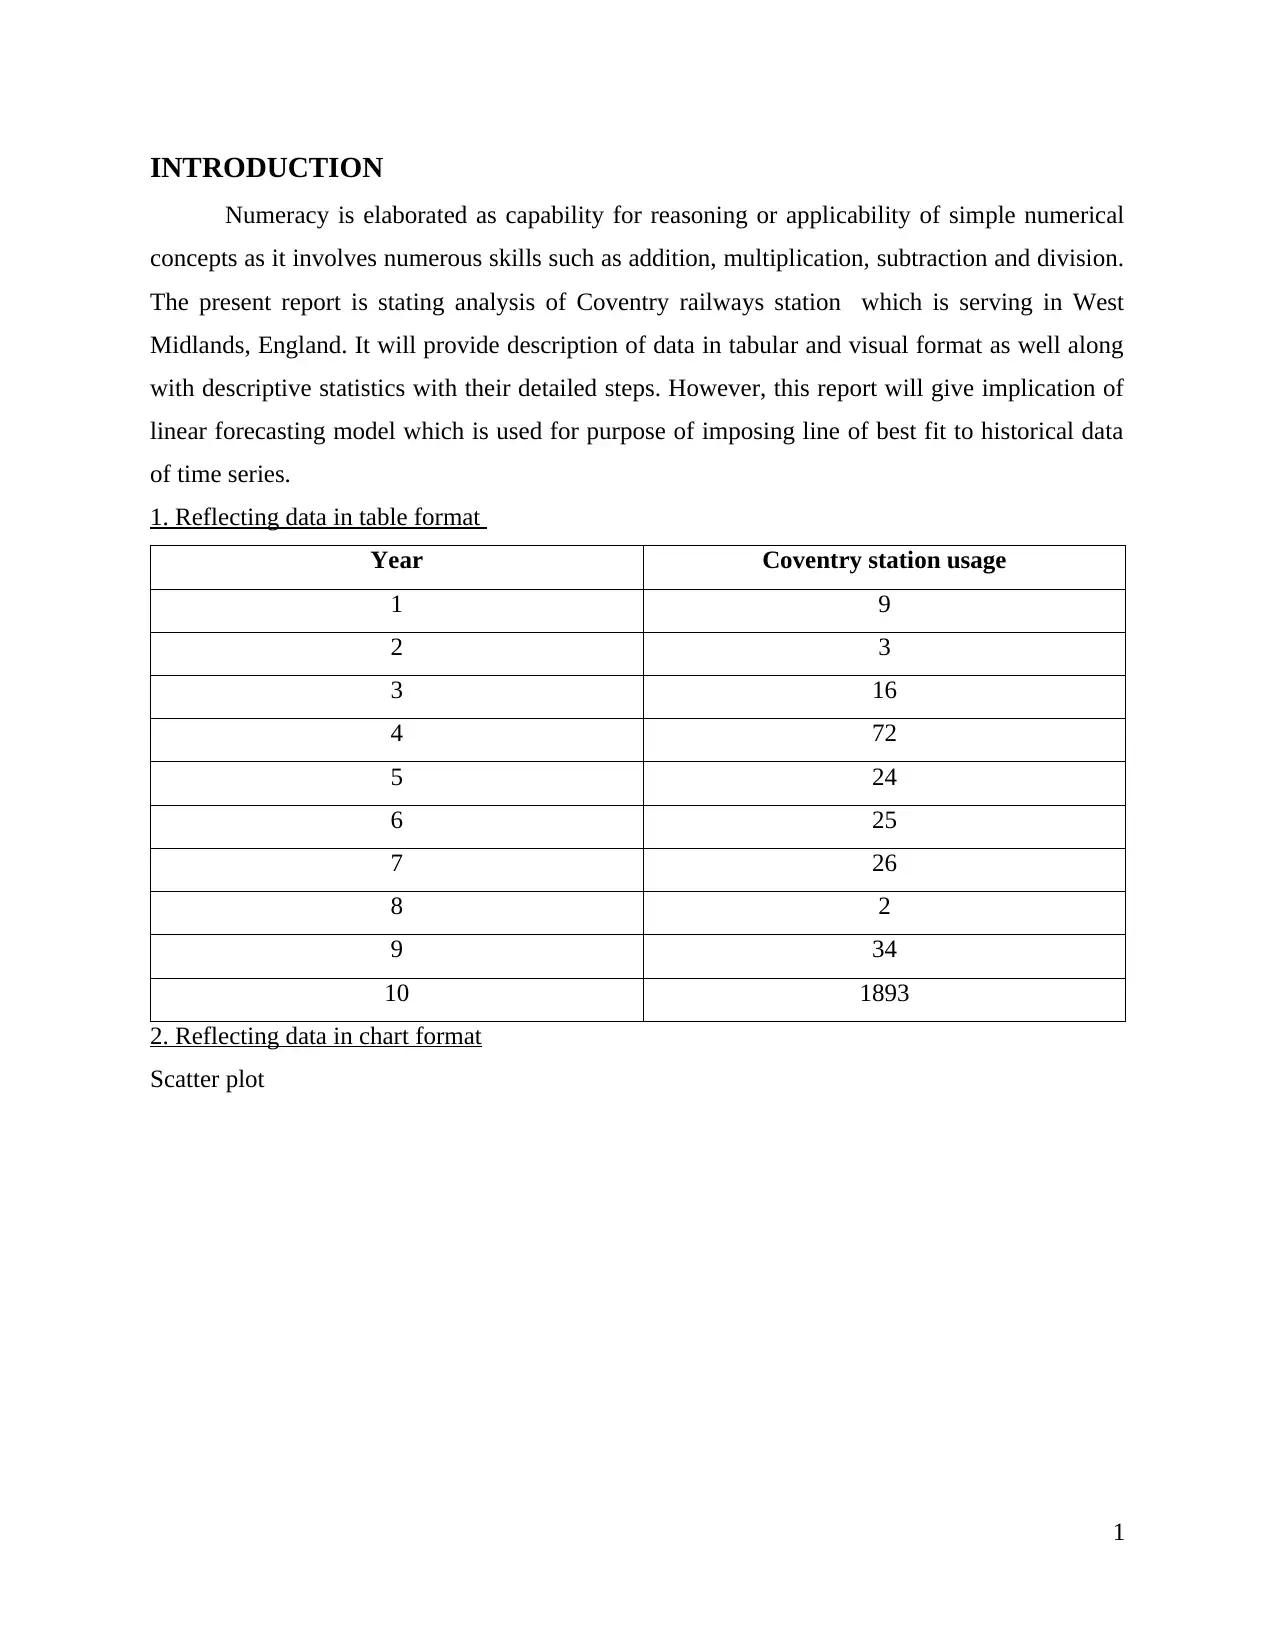
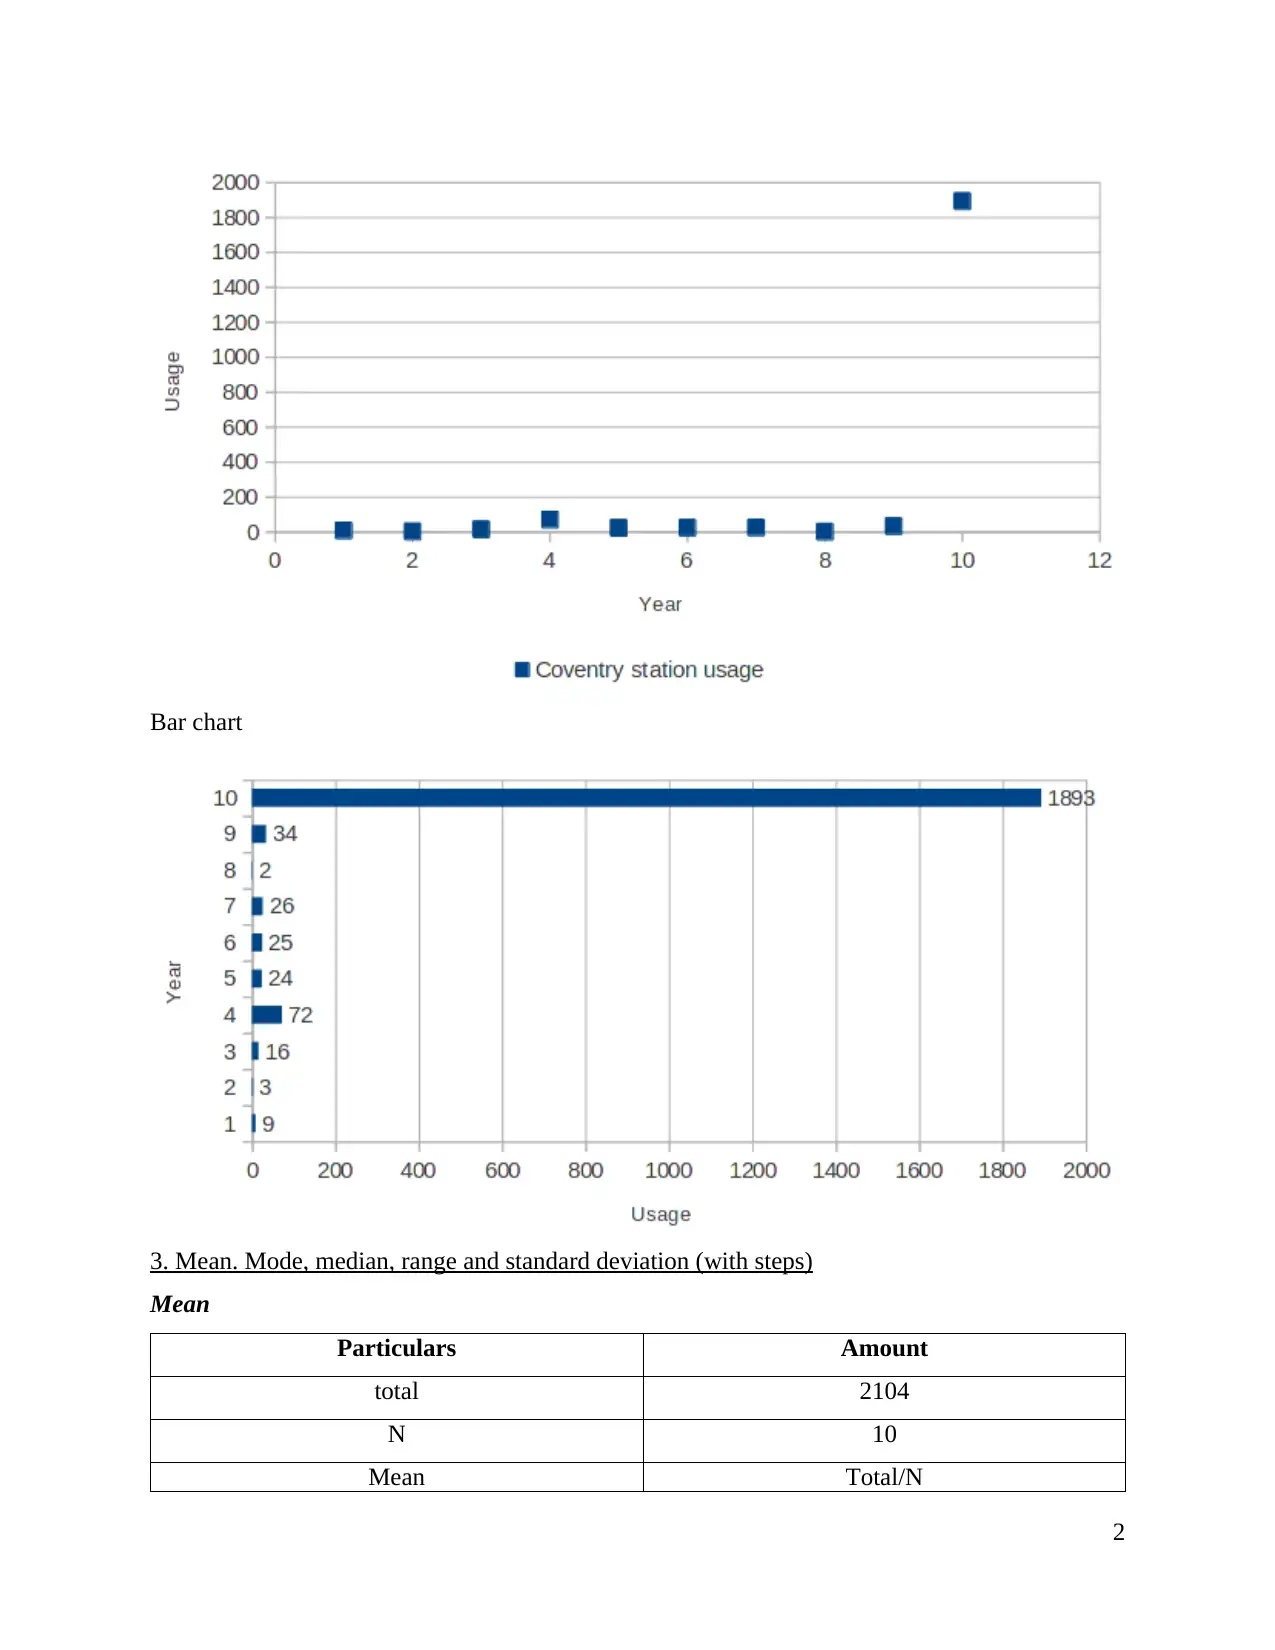
This report provides a comprehensive analysis of Coventry railway station usage data over a 10-year period. It begins with an introduction to numeracy and data analysis, followed by a presentation of the data in both tabular and chart formats. The report then delves into descriptive statistics, calculating the mean, mode, median, range, and standard deviation, with detailed step-by-step explanations. Furthermore, it applies a linear forecasting model to predict future station usage, extracting the 'm' and 'c' values and forecasting for the 12th and 15th years. The conclusion emphasizes the importance of statistics in business decision-making and data interpretation. The report uses relevant references to support its findings.

NUMERACY AND DATA
ANALYSIS
ANALYSIS
Paraphrase This Document
Need a fresh take? Get an instant paraphrase of this document with our AI Paraphraser

TABLE OF CONTENTS
INTRODUCTION...........................................................................................................................1
1. Reflecting data in table format ...............................................................................................1
2. Reflecting data in chart format................................................................................................1
3. Mean. Mode, median, range and standard deviation (with steps)...........................................2
4. Using linear forecasting model ..............................................................................................4
Extracting m value......................................................................................................................5
Extracting c value........................................................................................................................5
Predict for 12th and 15th year.....................................................................................................5
CONCLUSION................................................................................................................................5
REFERENCES................................................................................................................................6

INTRODUCTION
Numeracy is elaborated as capability for reasoning or applicability of simple numerical
concepts as it involves numerous skills such as addition, multiplication, subtraction and division.
The present report is stating analysis of Coventry railways station which is serving in West
Midlands, England. It will provide description of data in tabular and visual format as well along
with descriptive statistics with their detailed steps. However, this report will give implication of
linear forecasting model which is used for purpose of imposing line of best fit to historical data
of time series.
1. Reflecting data in table format
Year Coventry station usage
1 9
2 3
3 16
4 72
5 24
6 25
7 26
8 2
9 34
10 1893
2. Reflecting data in chart format
Scatter plot
1
⊘ This is a preview!⊘
Do you want full access?
Subscribe today to unlock all pages.

Trusted by 1+ million students worldwide

Bar chart
3. Mean. Mode, median, range and standard deviation (with steps)
Mean
Particulars Amount
total 2104
N 10
Mean Total/N
2
3. Mean. Mode, median, range and standard deviation (with steps)
Mean
Particulars Amount
total 2104
N 10
Mean Total/N
2
Paraphrase This Document
Need a fresh take? Get an instant paraphrase of this document with our AI Paraphraser

Mean 210.4
Mean value of a series of data is the average found by dividing the number of total units
in the frequency. The steps to calculate it are:
Calculate the number of units in the given set.
Determine the sum of all the numbers in the set of value (Pampaka, Hutcheson and
Williams, 2016).
Dived the total sum by the number of frequency in the set, the final value reached is the
mean value.
For the present calculation total number of frequency in set is 10. The sum total of all
thee 10 values is 2014. Mean value is reached by dividing 2014 by 10 as 210.4
Mode
Mode is considered as statistical term which is replicated to frequent occurring in set of
numbers which is found through gathering and organising data with reference to count of
frequency of every outcome. In the above analysis, no number of Coventry station usage is
repeated often so it has absence of mode.
Median
Median is the exact middle value of a given set of values The median value have exactly
same number before and after it (Mean, Median, Mode, 2019).
Steps to calculate median:
First all the values in the given set of frequency are arranged in ace sending order.
For even series two of the midden values are taken and added up.
The total sum is then dived by 2 to reach the average values and the resultant is the
median value for the even numbered series.
Present series have even numbers of unit that I 10 and after arranging the number in
ascending order the mid value at number 5 and 6 are 24 and 25. the median values is calculated
as 24.5 as average of two middle values.
Particulars Amount
Median (5th and 6th)/2
(24 + 25) / 2
3

Median 24.5
Range
range is considered as complete group which comprises among two points on a scale of
measurement or quality. It is the size of lowest interval which consists of every data and it gives
indication of statistical dispersion.
Listing all numbers in ascending order (Sullivan and Brown, 2015).
Determining the lowest and highest and then subtracting minimum from maximum.
Moreover, it is measured in same units along with data as it is only dependent on two of the
observations which is very significant to reflect dispersion of small data base. In the below
scenario, minimum range is 2 and maximum is 1893, however, there difference (maximum
minus minimum) is outcome of range as 1891.
Particulars Amount
Minimum 2
Maximum 1893
Range Maximum – Minimum
1893 – 2
1891
Standard deviation
Standard deviation is replicated as quantity of expressing the lower case and implied
through quantity the amount of variation of dispersion of set of its data values. The detailed steps
for extracting outcome are stated below:
Consider mean and extracting it from every number.
In order to this, outcome of first step must be squared and then its aggregated should be
undertaken.
The above outcome must be divided by n – 1 where n is total number of observations and
its result is considered as variance of the data set.
On basis of reaching to standard deviation, square root of variance must be worked for
final outcome.
Particulars amount
4
⊘ This is a preview!⊘
Do you want full access?
Subscribe today to unlock all pages.

Trusted by 1+ million students worldwide

Variance [Sum of (X – X bar) ^ 2] / N - 1
N – 1 10 – 1
9
Sum of (X – X bar) ^ 2 3149334.4 / 9
Variance 349926.04
Standard deviation Square root (Variance)
591.55
In the above scenario, it shows standard deviation of 591.55 which is far from mean as it
is high standard deviation where numbers are more spread.
4. Using linear forecasting model
Year (x) Coventry station usage XY X^2
1 9 9 1
2 3 6 4
3 16 48 9
4 72 288 16
5 24 120 25
6 25 150 36
7 26 182 49
8 2 16 64
9 34 306 81
10 1893 18930 100
55 2104 20055 385
Extracting m value
Particulars Details
m NΣxy – Σx Σy / NΣ x^2 – (Σx)^2
(10 * 20055) – (55 * 2104) / (10 * 385) – (55)^2
(20050 – 115720)/ (3850 – 3025)
m 102.82
5
Paraphrase This Document
Need a fresh take? Get an instant paraphrase of this document with our AI Paraphraser

Extracting c value
Particulars Details
c Σy - m Σx / N
(2104 – (102.82 * 55))/10
c -355.13
Predict for 12th and 15th year
Forecast of 12th year
Y = mX + C
Y 102.82 (X) – 355.13
X 12
Y 102.82 (12) – 355.13
878.76
Forecast of 15th year
Y = mX + C
Y 102.82 (X) – 355.13
X 15
Y 102.82 (15) – 355.13
1187.23
CONCLUSION
On basis of above report it could be concluded that statistics play censorious role in
business decision making and even for purpose of appropriate interpretation of numbers of train
station usage of Coventry over past 10 consecutive years. It has shown analysis with help of
descriptive analysis of past 10 consecutive years with use of mean, median, range, standard
deviation and mode. However, it has replicated use of linear regression equation for predicting
usage of coming future.
6
1 out of 8
Related Documents
Your All-in-One AI-Powered Toolkit for Academic Success.
+13062052269
info@desklib.com
Available 24*7 on WhatsApp / Email
Unlock your academic potential
Copyright © 2020–2025 A2Z Services. All Rights Reserved. Developed and managed by ZUCOL.


