Analysis of COVID-19 Cases: Data Handling and Statistical Techniques

Verified

Added on  2022/12/23

|12
|1760
|57
Report
AI Summary
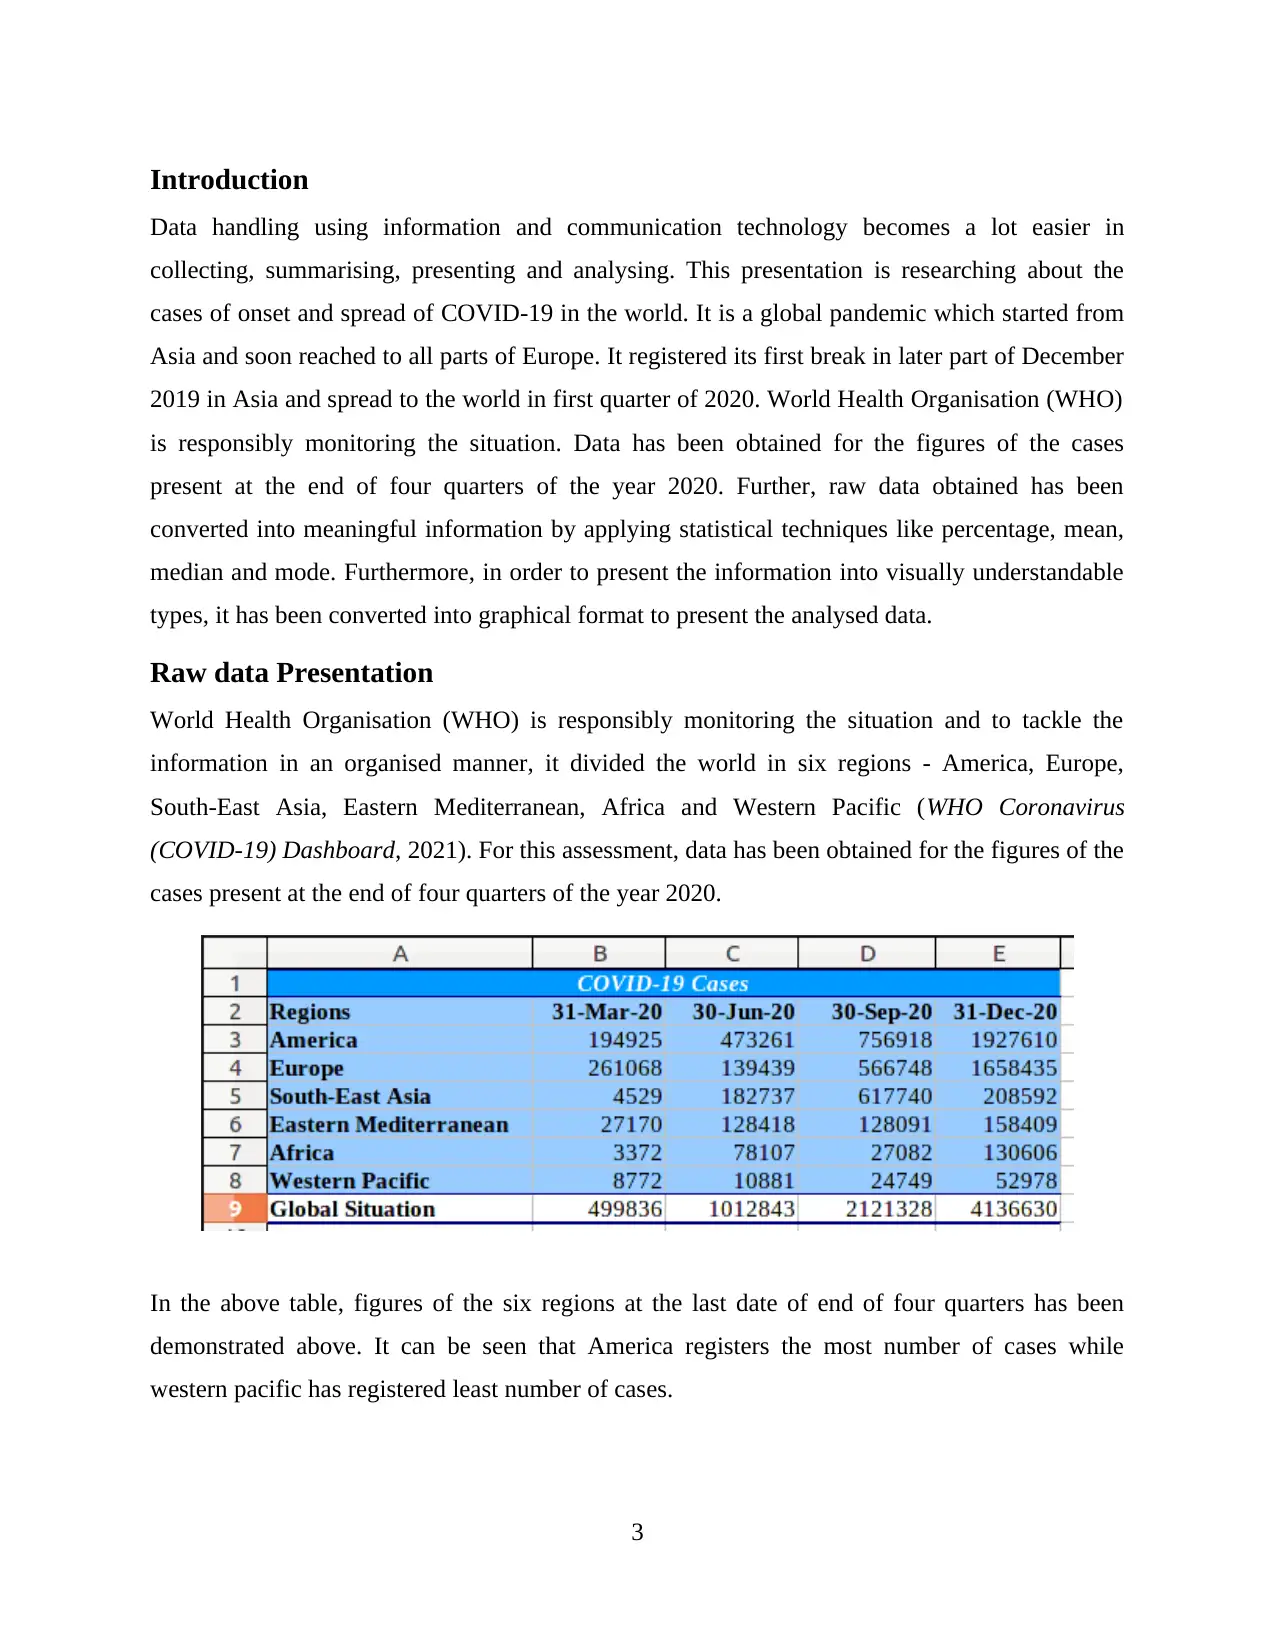
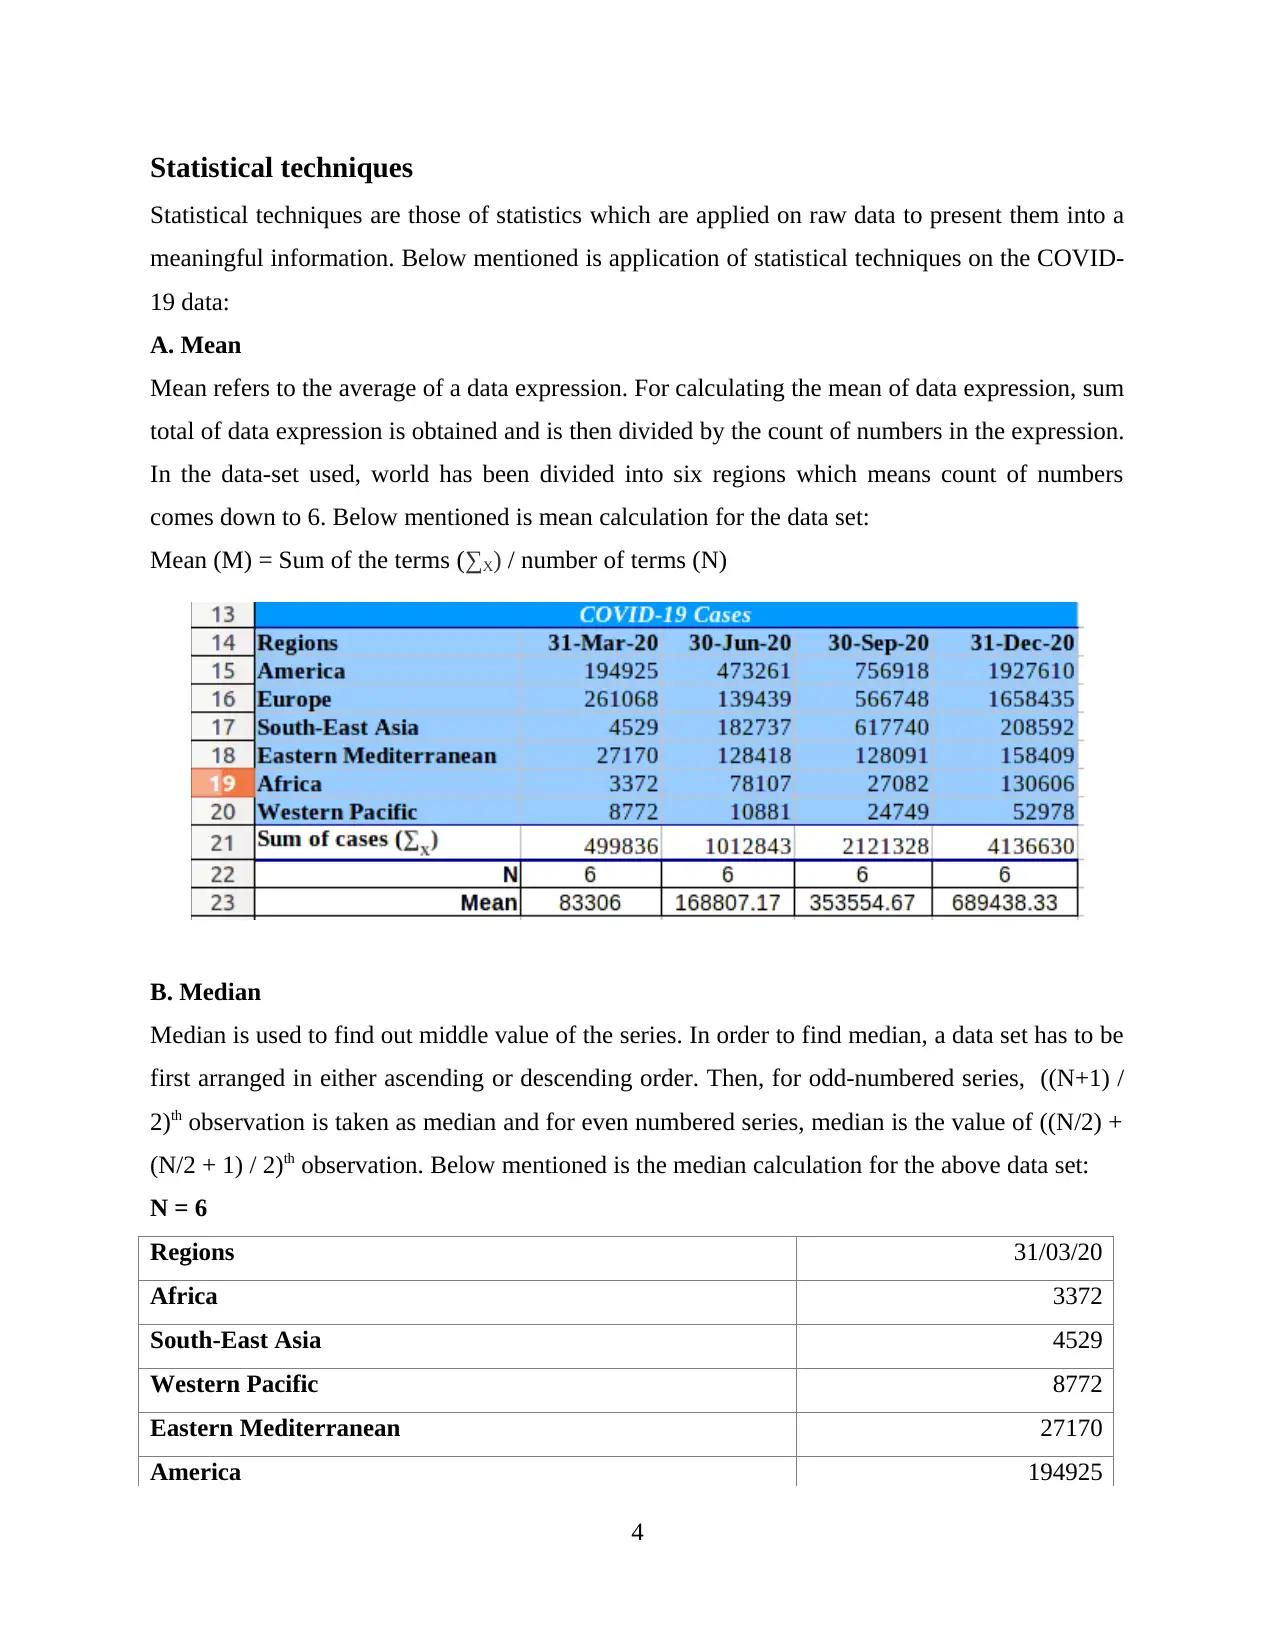
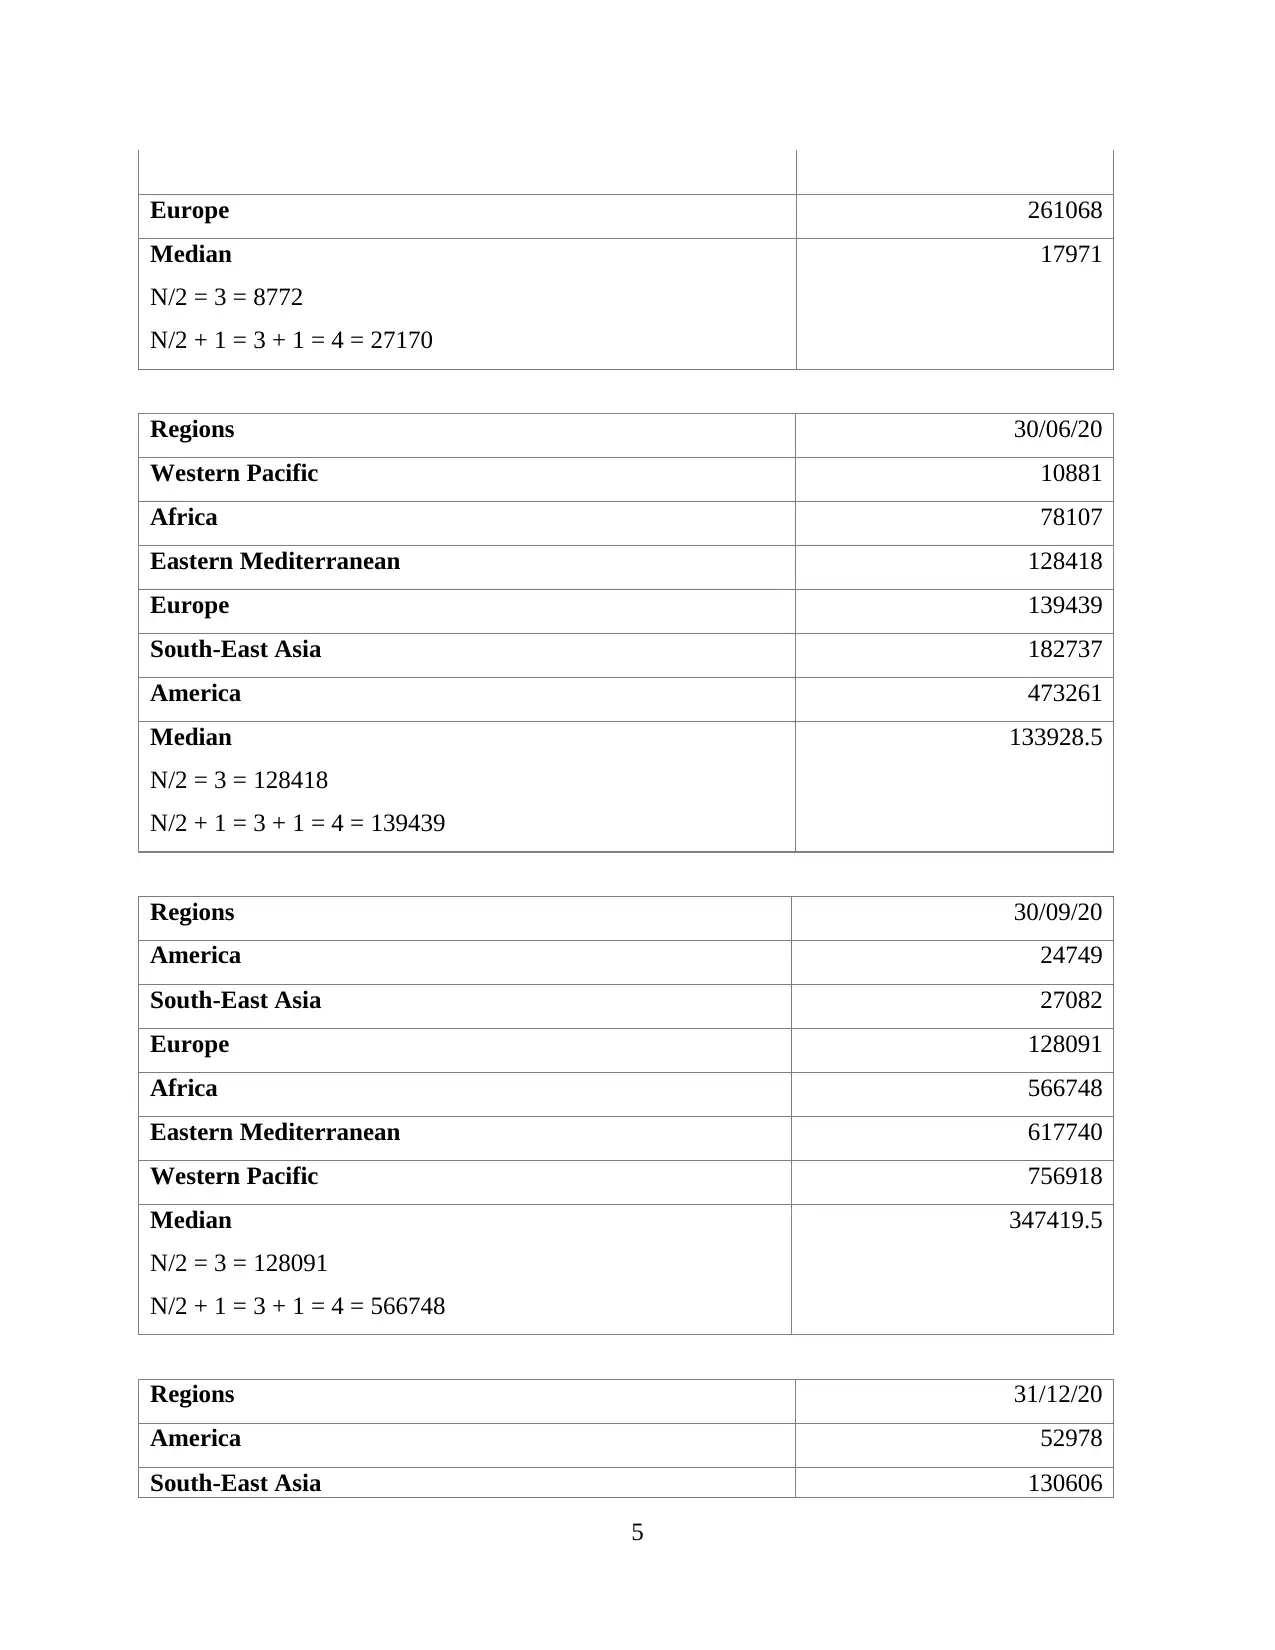
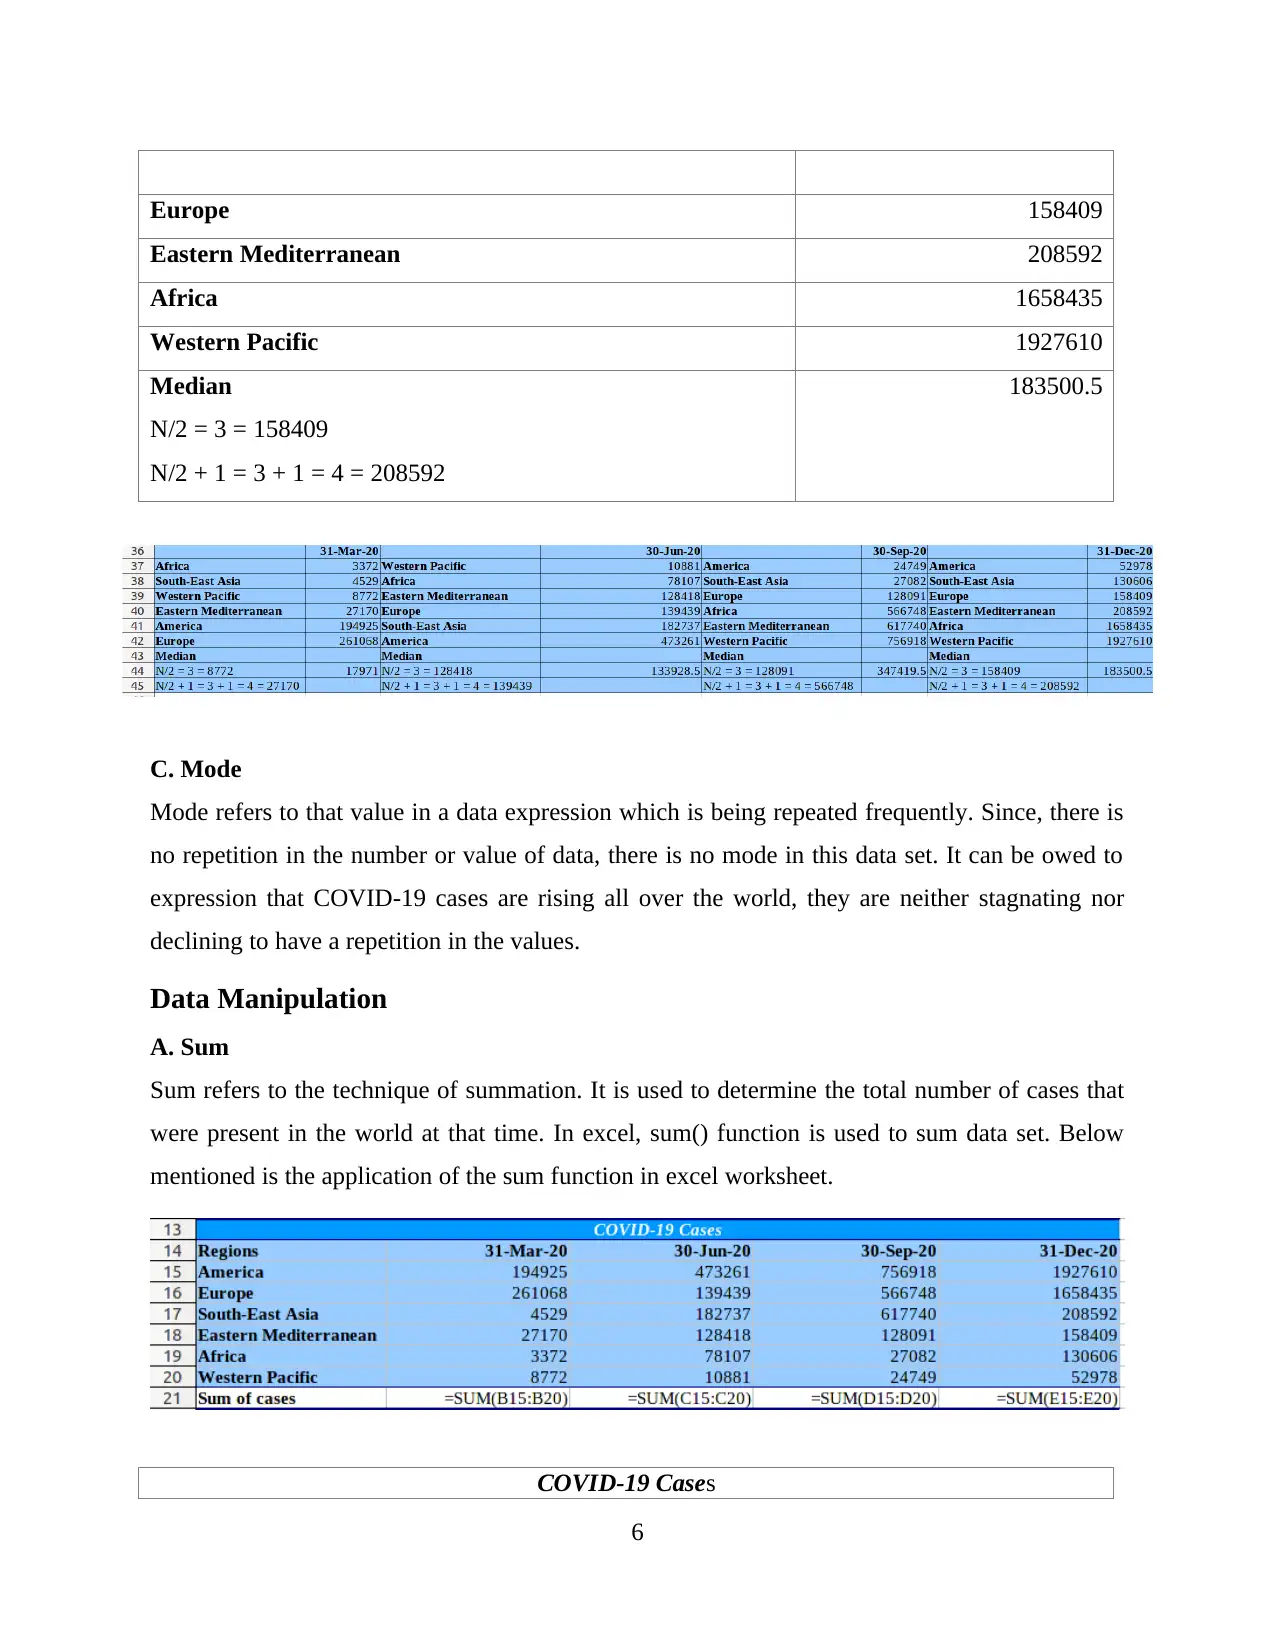
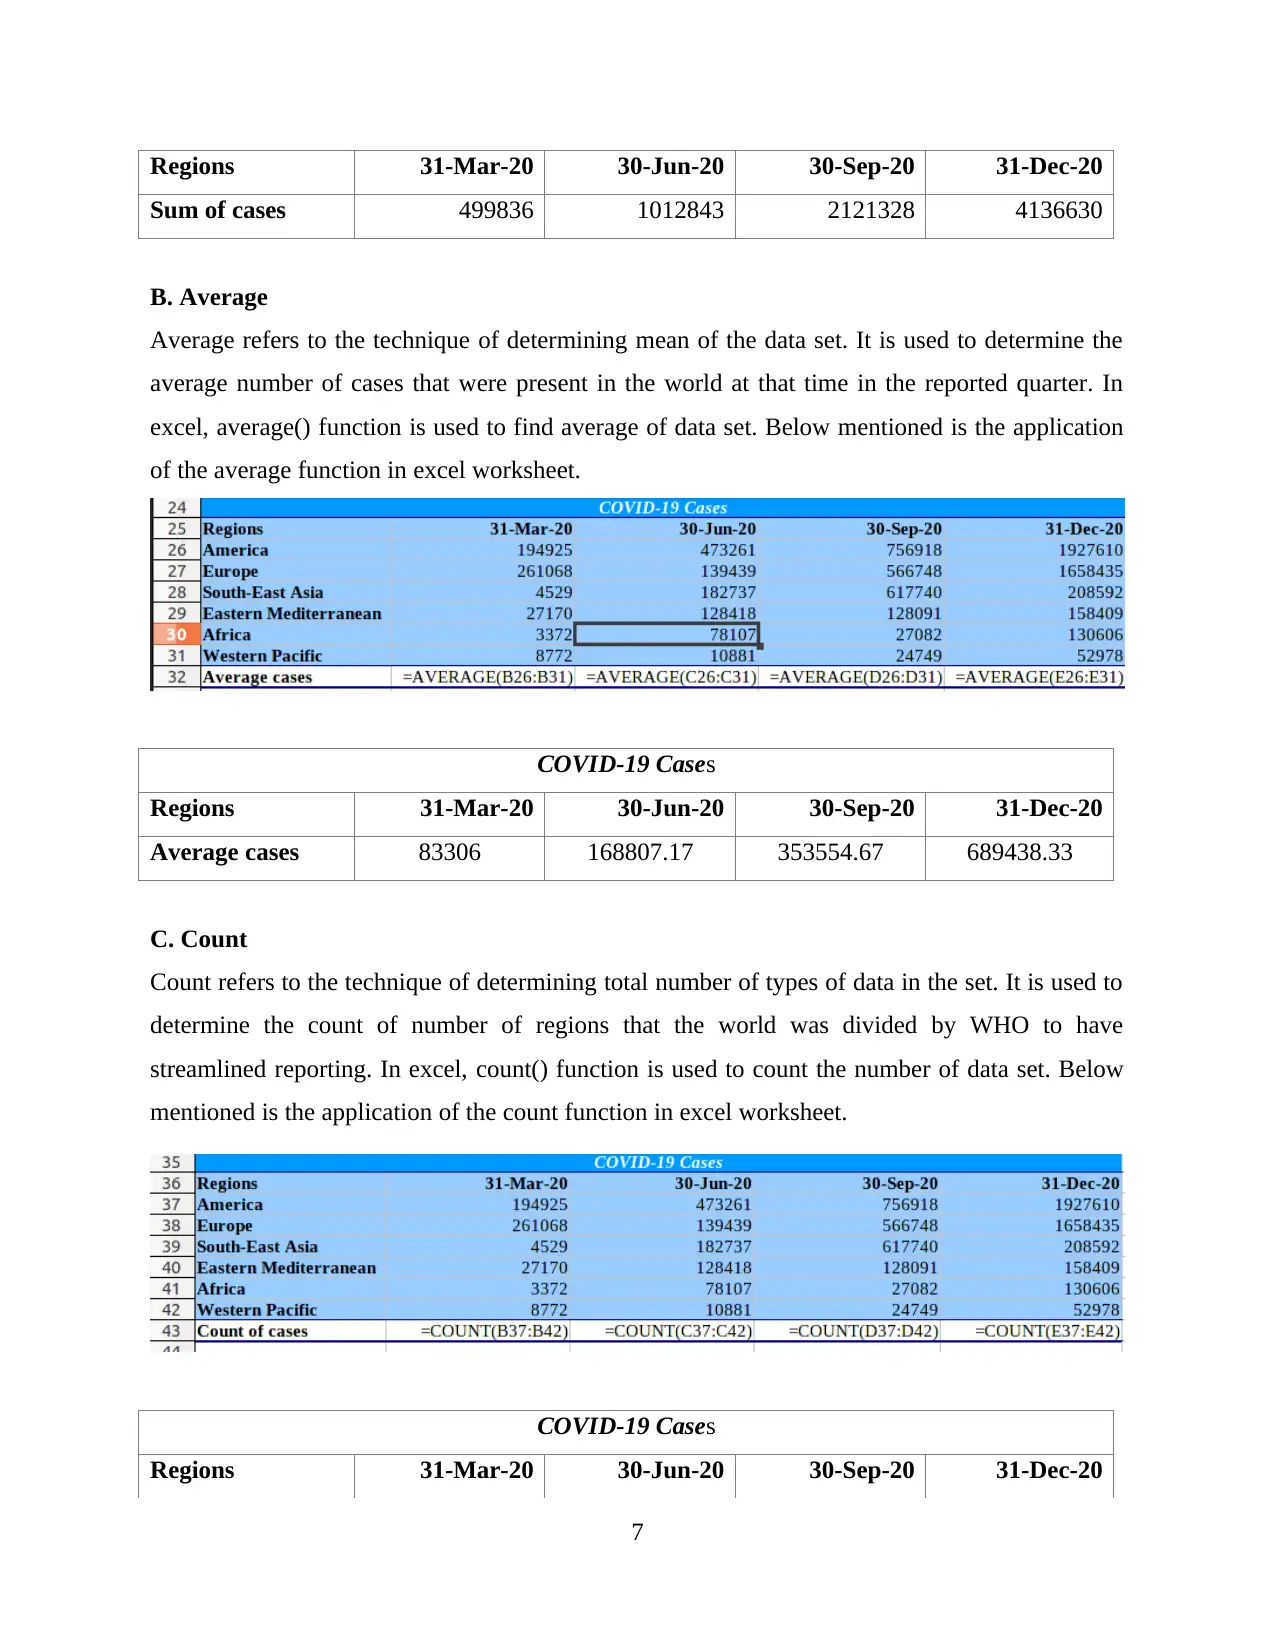
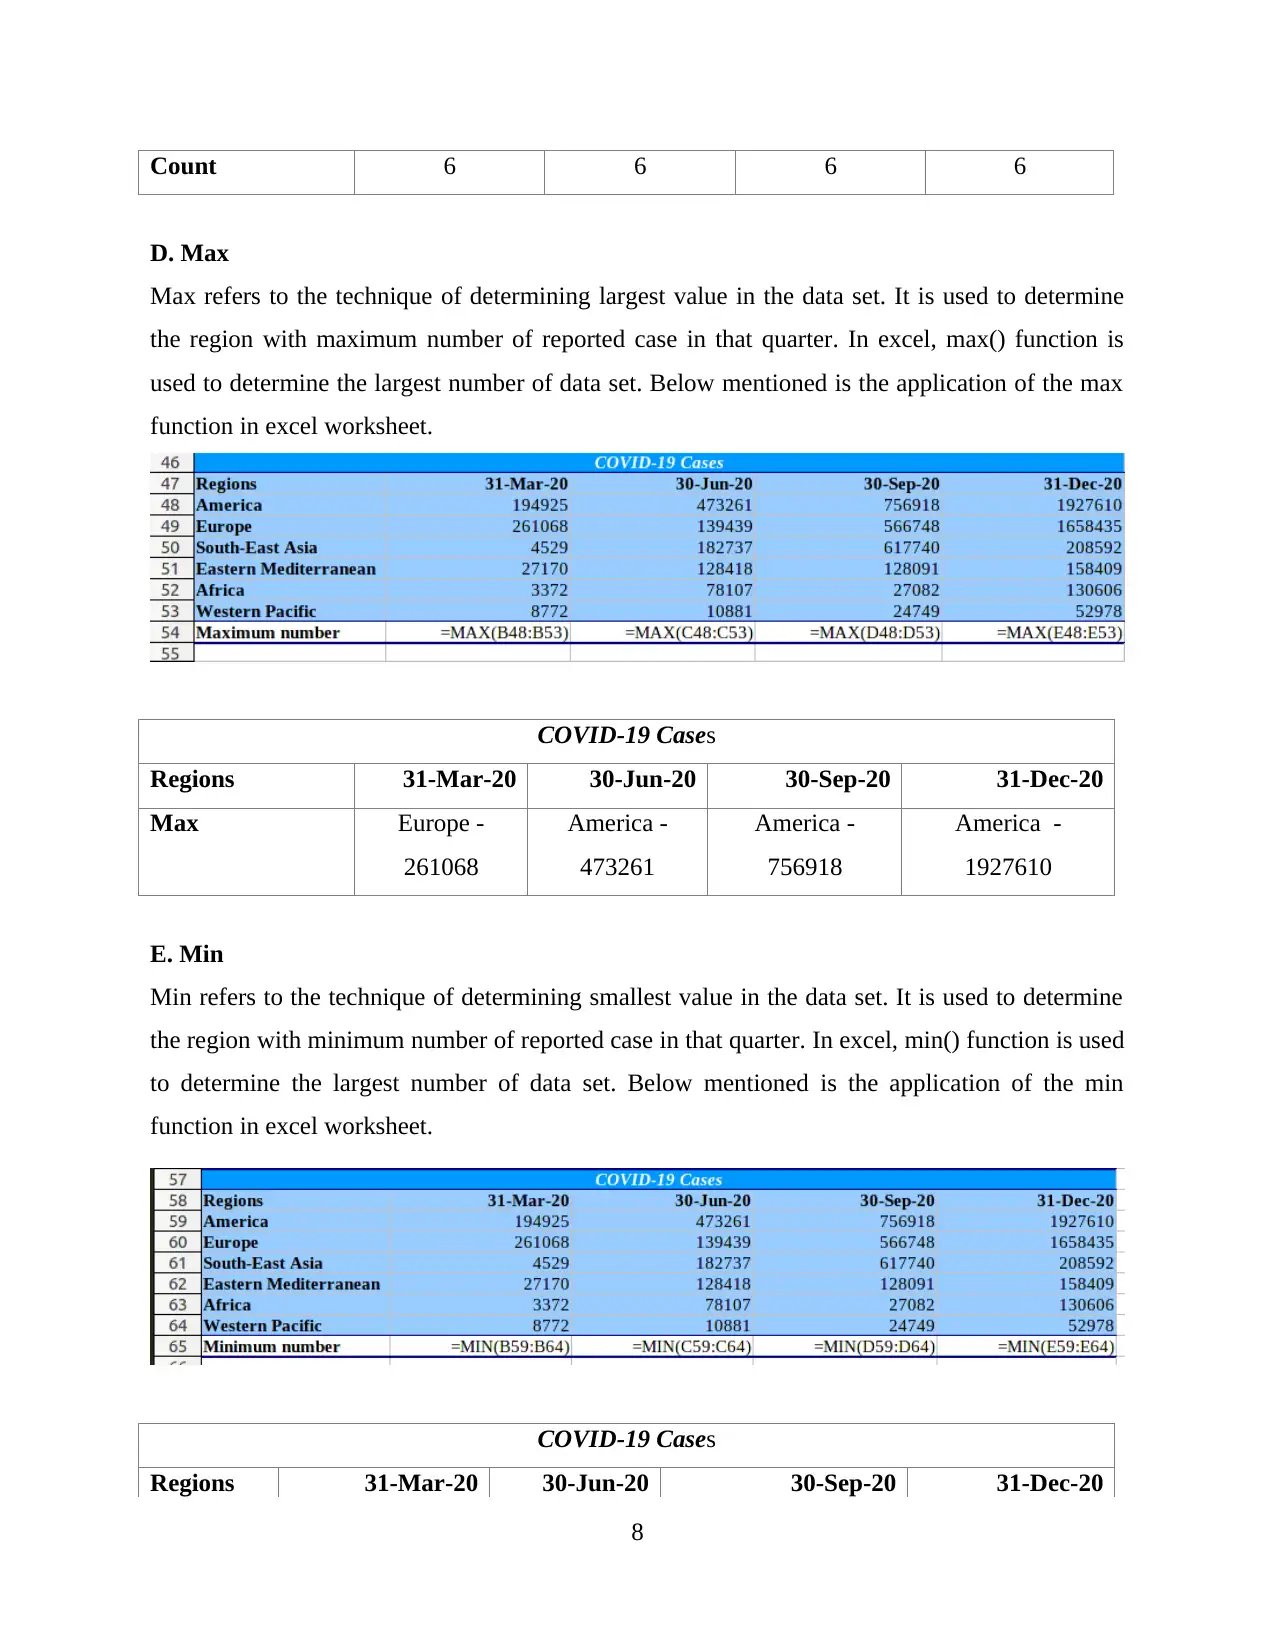
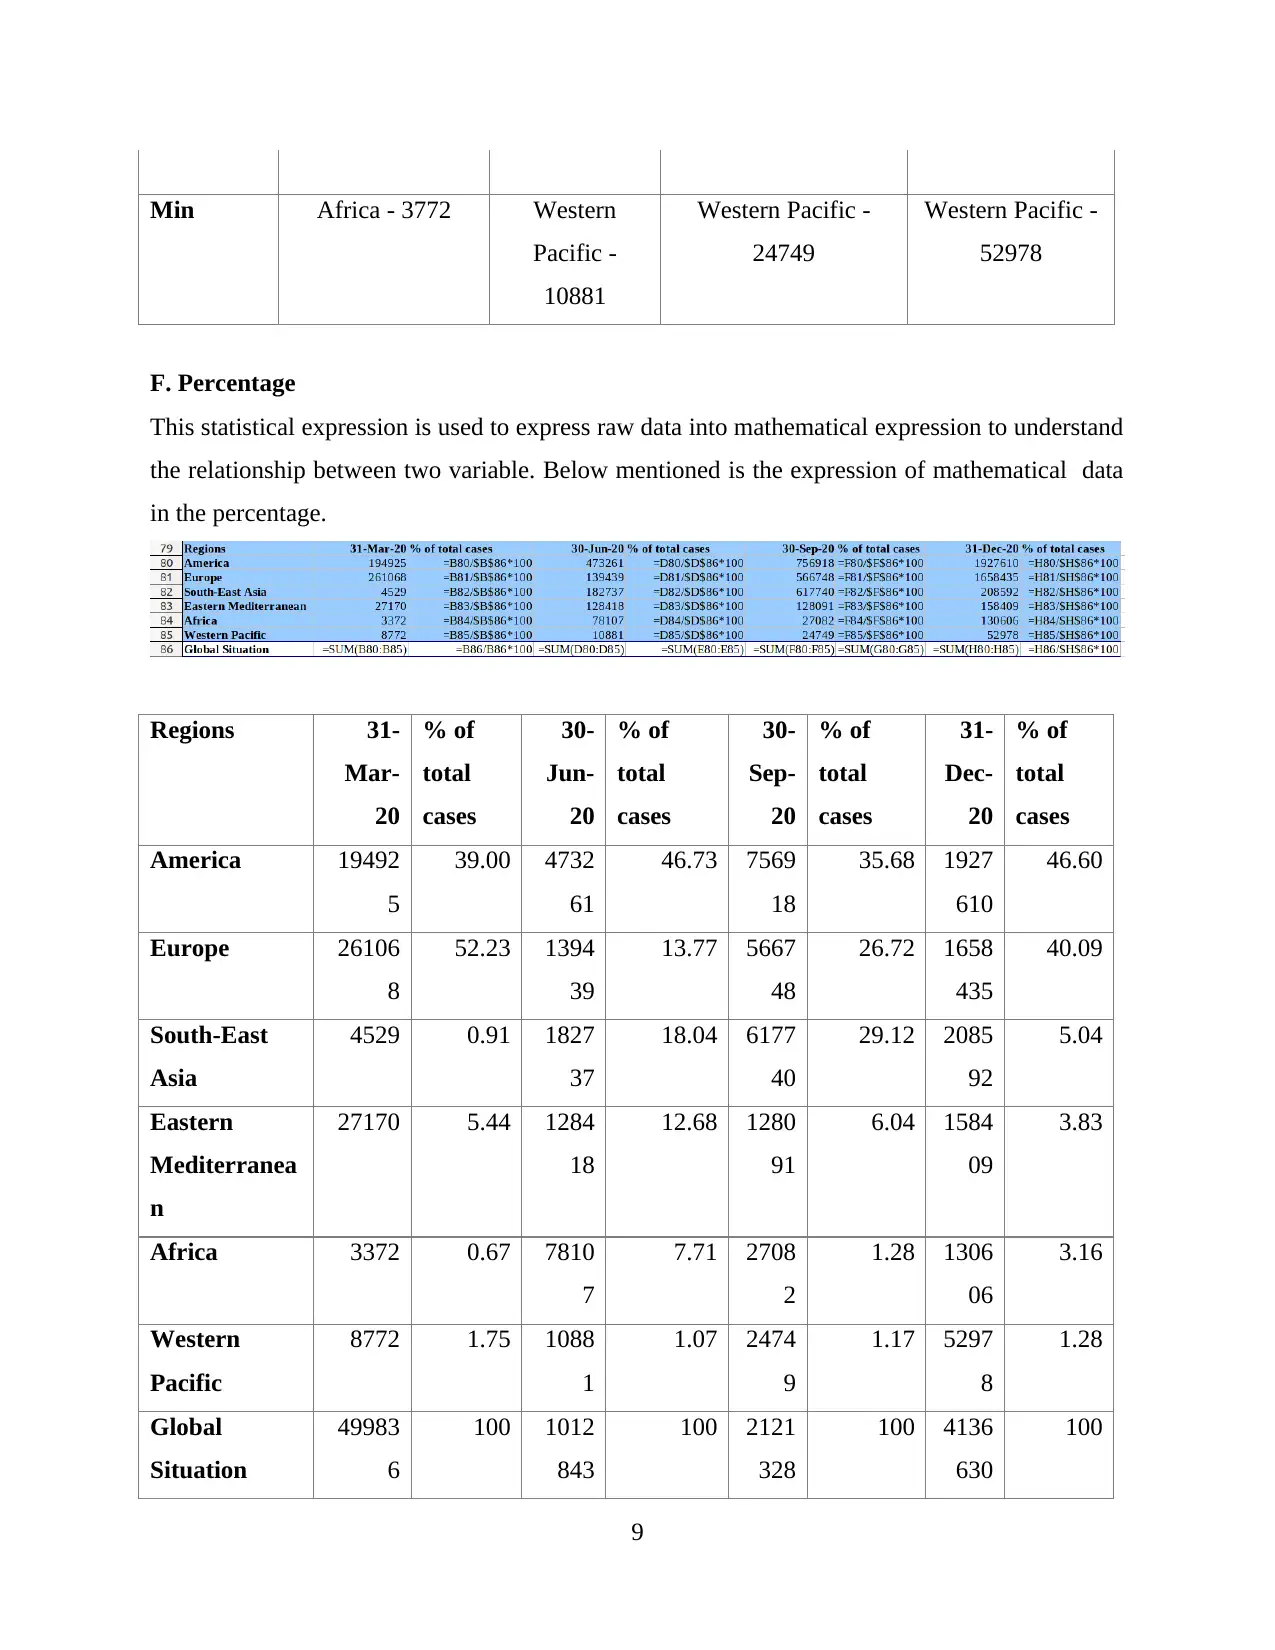
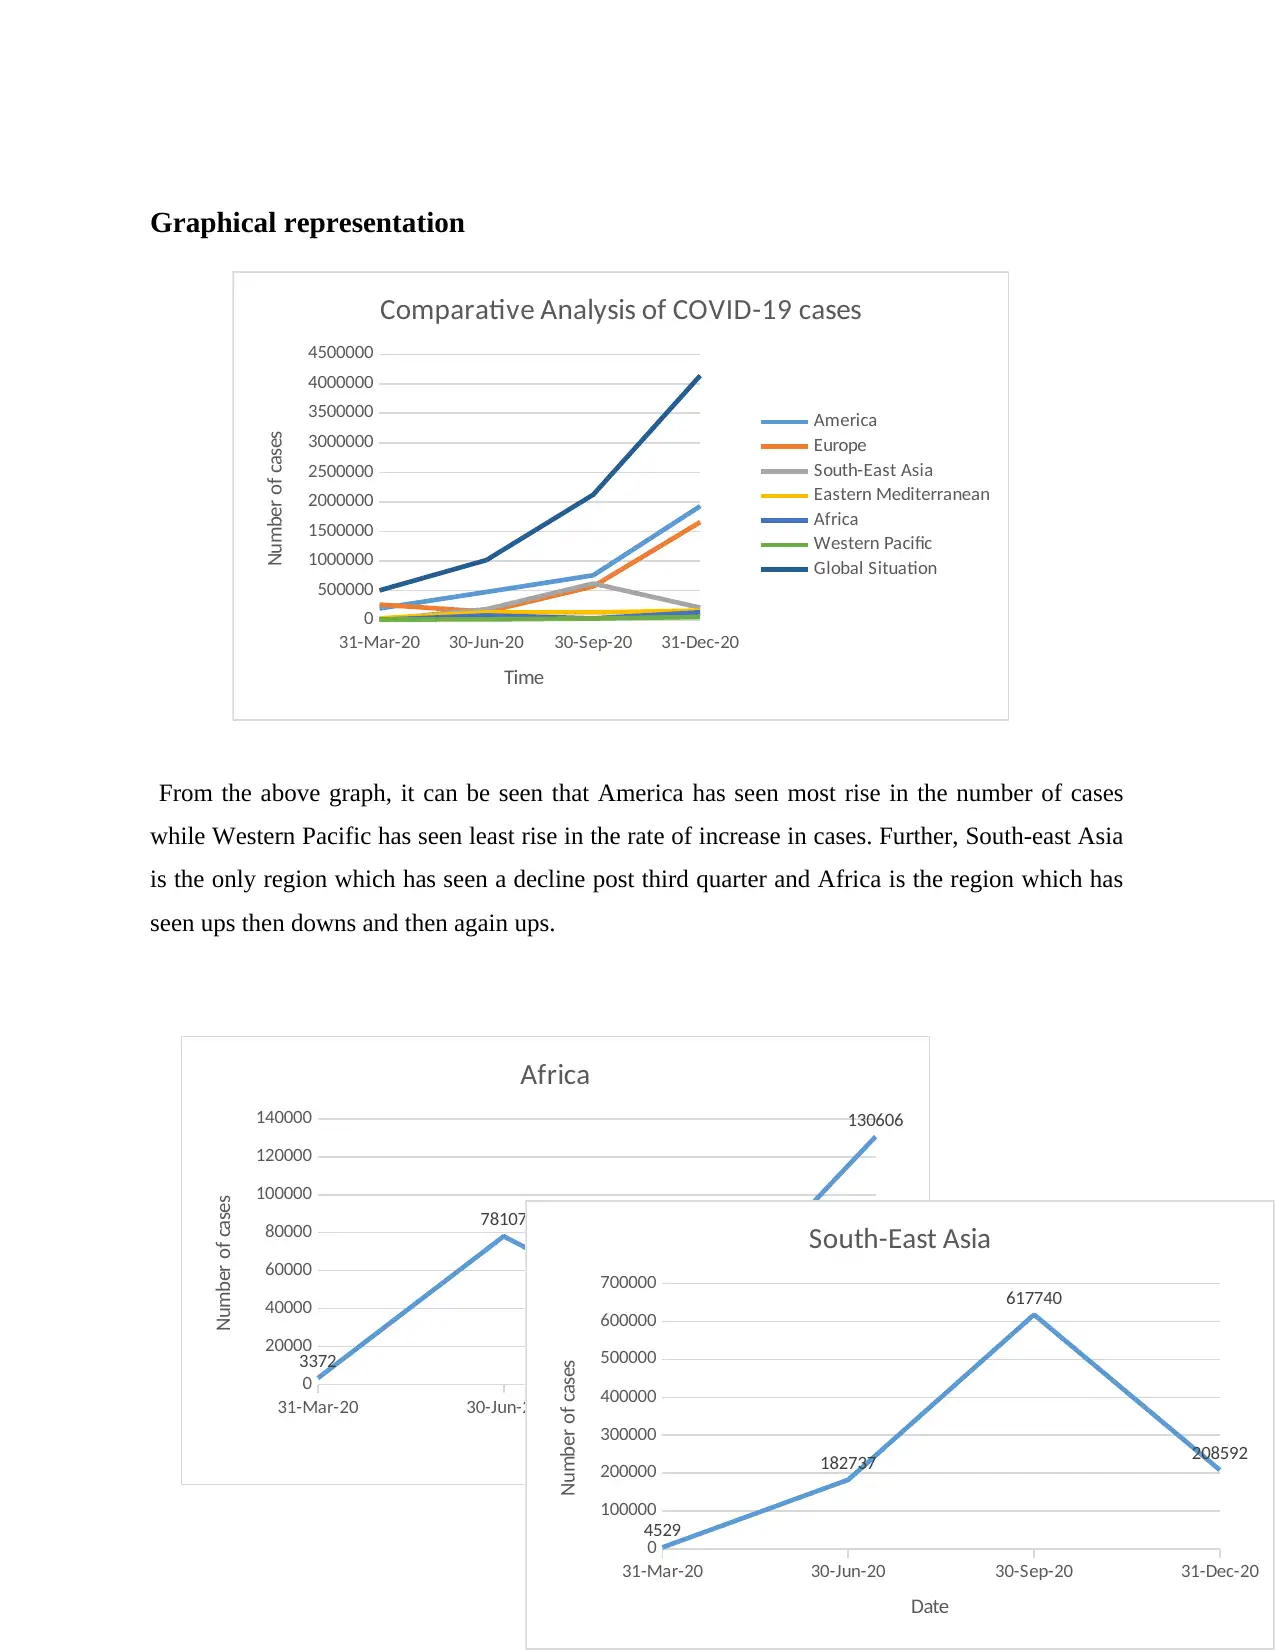
This report presents a comprehensive analysis of COVID-19 data, focusing on the cases reported across six WHO regions during the four quarters of 2020. The analysis involves data handling, statistical techniques like calculating mean, median, and identifying the absence of a mode due to the increasing nature of the cases. Data manipulation techniques, including sum, average, count, max, min, and percentage calculations, are applied using Excel. The report further visualizes the data through graphical representations, comparing the trends in different regions. The findings indicate that America experienced the most significant rise in cases, while the Western Pacific had the least. The report concludes with an overview of the global situation, highlighting the impact of the pandemic and the expected return to normalcy with preventive measures and vaccinations. The report uses data from the WHO dashboard and provides a detailed overview of the data handling and analysis process.
Document Page
Data handling and using
ICT
1
tabler-icon-diamond-filled.svg

Paraphrase This Document

Need a fresh take? Get an instant paraphrase of this document with our AI Paraphraser
Document Page
Table of Contents
Introduction .....................................................................................................................................3
Raw data Presentation .....................................................................................................................3
Statistical techniques........................................................................................................................4
Data Manipulation...........................................................................................................................6
Graphical representation..................................................................................................................9
Conclusion.....................................................................................................................................10
References......................................................................................................................................12
2
Document Page
Introduction
Data handling using information and communication technology becomes a lot easier in
collecting, summarising, presenting and analysing. This presentation is researching about the
cases of onset and spread of COVID-19 in the world. It is a global pandemic which started from
Asia and soon reached to all parts of Europe. It registered its first break in later part of December
2019 in Asia and spread to the world in first quarter of 2020. World Health Organisation (WHO)
is responsibly monitoring the situation. Data has been obtained for the figures of the cases
present at the end of four quarters of the year 2020. Further, raw data obtained has been
converted into meaningful information by applying statistical techniques like percentage, mean,
median and mode. Furthermore, in order to present the information into visually understandable
types, it has been converted into graphical format to present the analysed data.
Raw data Presentation
World Health Organisation (WHO) is responsibly monitoring the situation and to tackle the
information in an organised manner, it divided the world in six regions - America, Europe,
South-East Asia, Eastern Mediterranean, Africa and Western Pacific (WHO Coronavirus
(COVID-19) Dashboard, 2021). For this assessment, data has been obtained for the figures of the
cases present at the end of four quarters of the year 2020.
In the above table, figures of the six regions at the last date of end of four quarters has been
demonstrated above. It can be seen that America registers the most number of cases while
western pacific has registered least number of cases.
3
Document Page
Statistical techniques
Statistical techniques are those of statistics which are applied on raw data to present them into a
meaningful information. Below mentioned is application of statistical techniques on the COVID-
19 data:
A. Mean
Mean refers to the average of a data expression. For calculating the mean of data expression, sum
total of data expression is obtained and is then divided by the count of numbers in the expression.
In the data-set used, world has been divided into six regions which means count of numbers
comes down to 6. Below mentioned is mean calculation for the data set:
Mean (M) = Sum of the terms (∑X) / number of terms (N)
B. Median
Median is used to find out middle value of the series. In order to find median, a data set has to be
first arranged in either ascending or descending order. Then, for odd-numbered series, ((N+1) /
2)th observation is taken as median and for even numbered series, median is the value of ((N/2) +
(N/2 + 1) / 2)th observation. Below mentioned is the median calculation for the above data set:
N = 6
Regions 31/03/20
Africa 3372
South-East Asia 4529
Western Pacific 8772
Eastern Mediterranean 27170
America 194925
4
tabler-icon-diamond-filled.svg

Paraphrase This Document

Need a fresh take? Get an instant paraphrase of this document with our AI Paraphraser
Document Page
Europe 261068
Median
N/2 = 3 = 8772
N/2 + 1 = 3 + 1 = 4 = 27170
17971
Regions 30/06/20
Western Pacific 10881
Africa 78107
Eastern Mediterranean 128418
Europe 139439
South-East Asia 182737
America 473261
Median
N/2 = 3 = 128418
N/2 + 1 = 3 + 1 = 4 = 139439
133928.5
Regions 30/09/20
America 24749
South-East Asia 27082
Europe 128091
Africa 566748
Eastern Mediterranean 617740
Western Pacific 756918
Median
N/2 = 3 = 128091
N/2 + 1 = 3 + 1 = 4 = 566748
347419.5
Regions 31/12/20
America 52978
South-East Asia 130606
5
Document Page
Europe 158409
Eastern Mediterranean 208592
Africa 1658435
Western Pacific 1927610
Median
N/2 = 3 = 158409
N/2 + 1 = 3 + 1 = 4 = 208592
183500.5
C. Mode
Mode refers to that value in a data expression which is being repeated frequently. Since, there is
no repetition in the number or value of data, there is no mode in this data set. It can be owed to
expression that COVID-19 cases are rising all over the world, they are neither stagnating nor
declining to have a repetition in the values.
Data Manipulation
A. Sum
Sum refers to the technique of summation. It is used to determine the total number of cases that
were present in the world at that time. In excel, sum() function is used to sum data set. Below
mentioned is the application of the sum function in excel worksheet.
COVID-19 Cases
6
Document Page
Regions 31-Mar-20 30-Jun-20 30-Sep-20 31-Dec-20
Sum of cases 499836 1012843 2121328 4136630
B. Average
Average refers to the technique of determining mean of the data set. It is used to determine the
average number of cases that were present in the world at that time in the reported quarter. In
excel, average() function is used to find average of data set. Below mentioned is the application
of the average function in excel worksheet.
COVID-19 Cases
Regions 31-Mar-20 30-Jun-20 30-Sep-20 31-Dec-20
Average cases 83306 168807.17 353554.67 689438.33
C. Count
Count refers to the technique of determining total number of types of data in the set. It is used to
determine the count of number of regions that the world was divided by WHO to have
streamlined reporting. In excel, count() function is used to count the number of data set. Below
mentioned is the application of the count function in excel worksheet.
COVID-19 Cases
Regions 31-Mar-20 30-Jun-20 30-Sep-20 31-Dec-20
7
tabler-icon-diamond-filled.svg

Paraphrase This Document

Need a fresh take? Get an instant paraphrase of this document with our AI Paraphraser
Document Page
Count 6 6 6 6
D. Max
Max refers to the technique of determining largest value in the data set. It is used to determine
the region with maximum number of reported case in that quarter. In excel, max() function is
used to determine the largest number of data set. Below mentioned is the application of the max
function in excel worksheet.
COVID-19 Cases
Regions 31-Mar-20 30-Jun-20 30-Sep-20 31-Dec-20
Max Europe -
261068
America -
473261
America -
756918
America -
1927610
E. Min
Min refers to the technique of determining smallest value in the data set. It is used to determine
the region with minimum number of reported case in that quarter. In excel, min() function is used
to determine the largest number of data set. Below mentioned is the application of the min
function in excel worksheet.
COVID-19 Cases
Regions 31-Mar-20 30-Jun-20 30-Sep-20 31-Dec-20
8
Document Page
Min Africa - 3772 Western
Pacific -
10881
Western Pacific -
24749
Western Pacific -
52978
F. Percentage
This statistical expression is used to express raw data into mathematical expression to understand
the relationship between two variable. Below mentioned is the expression of mathematical data
in the percentage.
Regions 31-
Mar-
20
% of
total
cases
30-
Jun-
20
% of
total
cases
30-
Sep-
20
% of
total
cases
31-
Dec-
20
% of
total
cases
America 19492
5
39.00 4732
61
46.73 7569
18
35.68 1927
610
46.60
Europe 26106
8
52.23 1394
39
13.77 5667
48
26.72 1658
435
40.09
South-East
Asia
4529 0.91 1827
37
18.04 6177
40
29.12 2085
92
5.04
Eastern
Mediterranea
n
27170 5.44 1284
18
12.68 1280
91
6.04 1584
09
3.83
Africa 3372 0.67 7810
7
7.71 2708
2
1.28 1306
06
3.16
Western
Pacific
8772 1.75 1088
1
1.07 2474
9
1.17 5297
8
1.28
Global
Situation
49983
6
100 1012
843
100 2121
328
100 4136
630
100
9
Document Page
Graphical representation
From the above graph, it can be seen that America has seen most rise in the number of cases
while Western Pacific has seen least rise in the rate of increase in cases. Further, South-east Asia
is the only region which has seen a decline post third quarter and Africa is the region which has
seen ups then downs and then again ups.
10
31-Mar-20 30-Jun-20 30-Sep-20 31-Dec-20
0
500000
1000000
1500000
2000000
2500000
3000000
3500000
4000000
4500000
Comparative Analysis of COVID-19 cases
America
Europe
South-East Asia
Eastern Mediterranean
Africa
Western Pacific
Global Situation
Time
Number of cases
31-Mar-20 30-Jun-20 30-Sep-20 31-Dec-20
0
20000
40000
60000
80000
100000
120000
140000
3372
78107
27082
130606
Africa
Date
Number of cases
31-Mar-20 30-Jun-20 30-Sep-20 31-Dec-20
0
100000
200000
300000
400000
500000
600000
700000
4529
182737
617740
208592
South-East Asia
Date
Number of cases
tabler-icon-diamond-filled.svg

Paraphrase This Document

Need a fresh take? Get an instant paraphrase of this document with our AI Paraphraser
Document Page
Conclusion
Above assessment has been on data handling using information and communication technology.
Data for the COVID-19 cases across the six regions of the world, as divided by the WHO has
been taken in the consideration for the four quarters of the year 2020. It can be concluded from
above analysis that America has seen most rise in the number of cases while Western Pacific has
seen least rise in the rate of increase in cases. Further, South-east Asia is the only region which
has seen a decline post third quarter and Africa is the region which has seen ups then downs and
then again ups. Other than data analysis in the graphical presentation, statistical techniques has
also been applied to evaluate the various metrics related to the raw data undertaken for the
research. From mean,it can be seen that average number of cases gradually see only increment.
Median, on the other hand has seen ups and downs in the four quarters. Since, there was no
repetition in the numbers of data, there was no modal value. All this data in a summary present a
picture of the situation that has been prevalent all over the world. It represents the situation that
has stopped the world at one point of time. However, with the passage of time, prevention and
post vaccination, things are improving and are expected to return to normalcy in the year 2021.
11
Document Page
References
Online
WHO Coronavirus (COVID-19) Dashboard. 2021. [Online]. Available
through:<https://covid19.who.int/>
12
chevron_up_icon
1 out of 12
circle_padding
hide_on_mobile
zoom_out_icon
[object Object]