Analysis and Visualization of Data Table: A COVID-19 Case Study
VerifiedAdded on 2023/06/18
|6
|1286
|318
Report
AI Summary
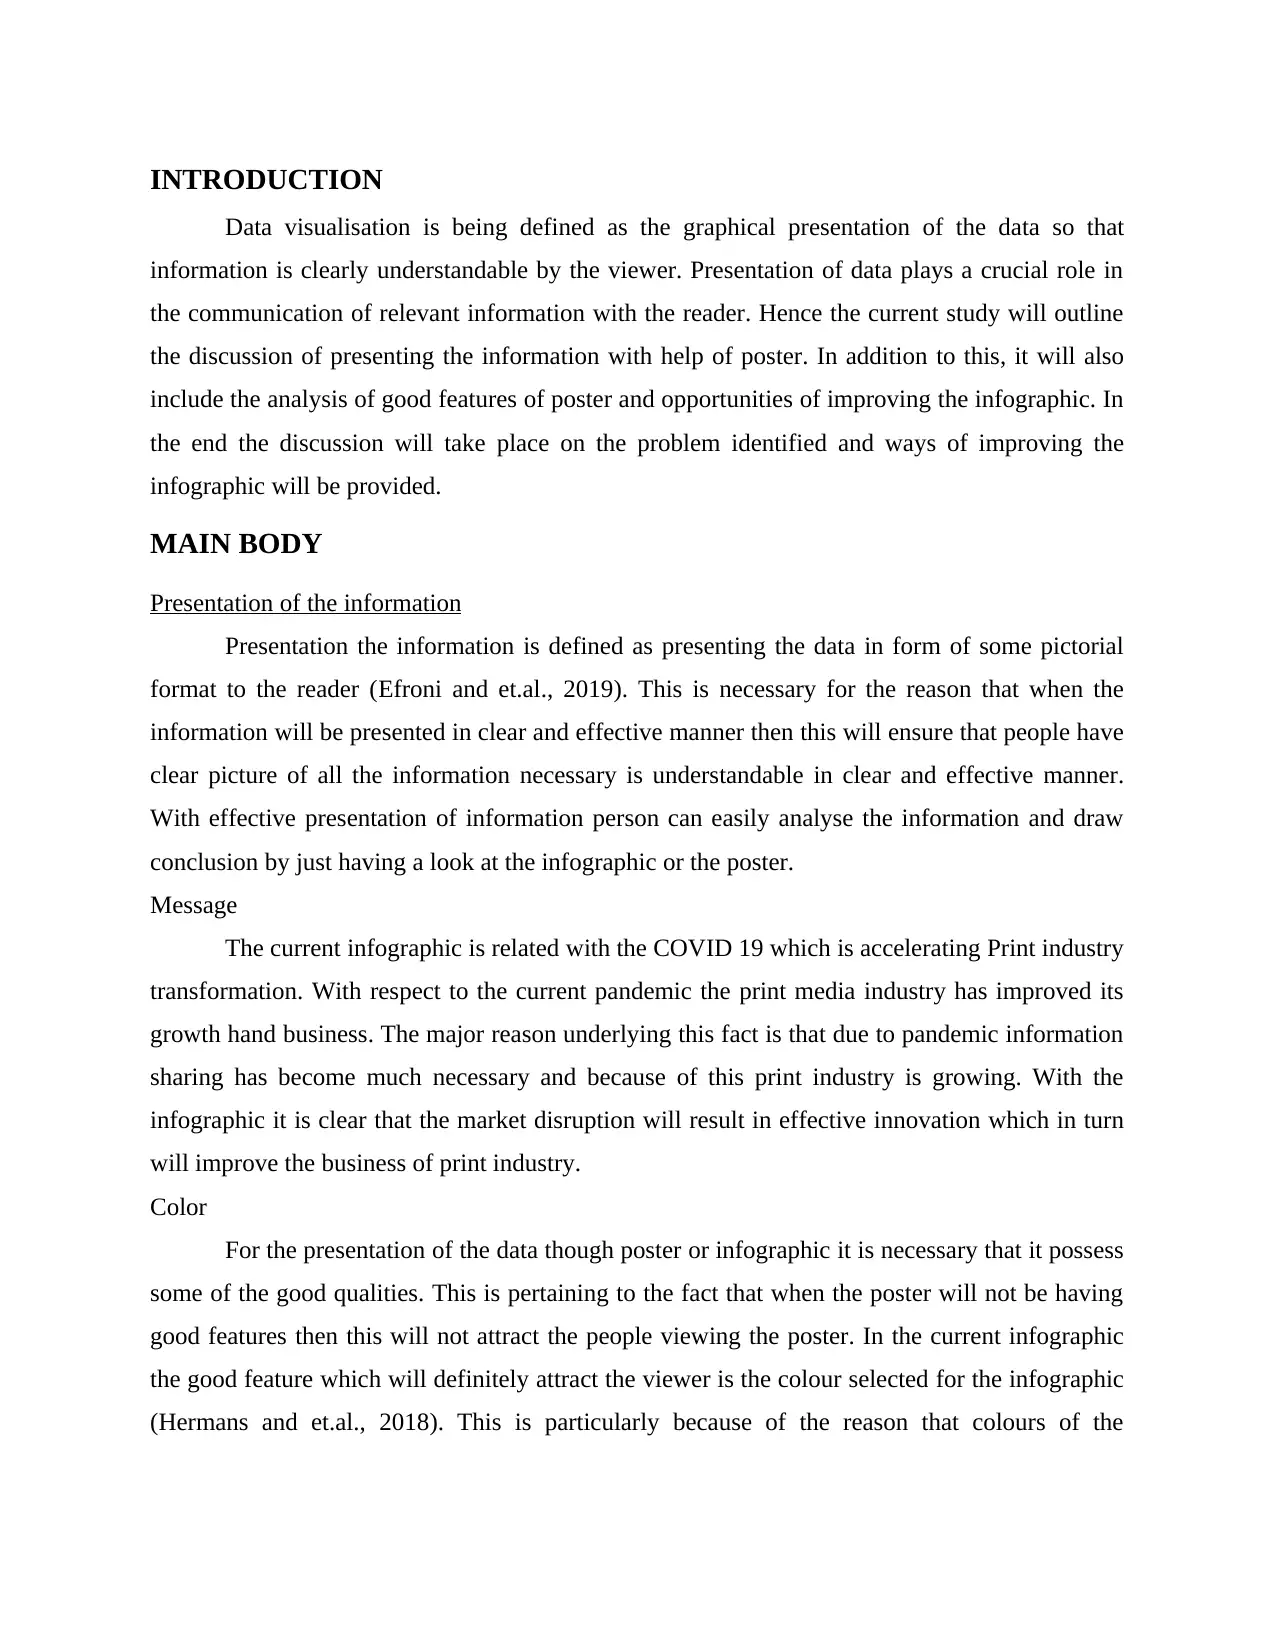
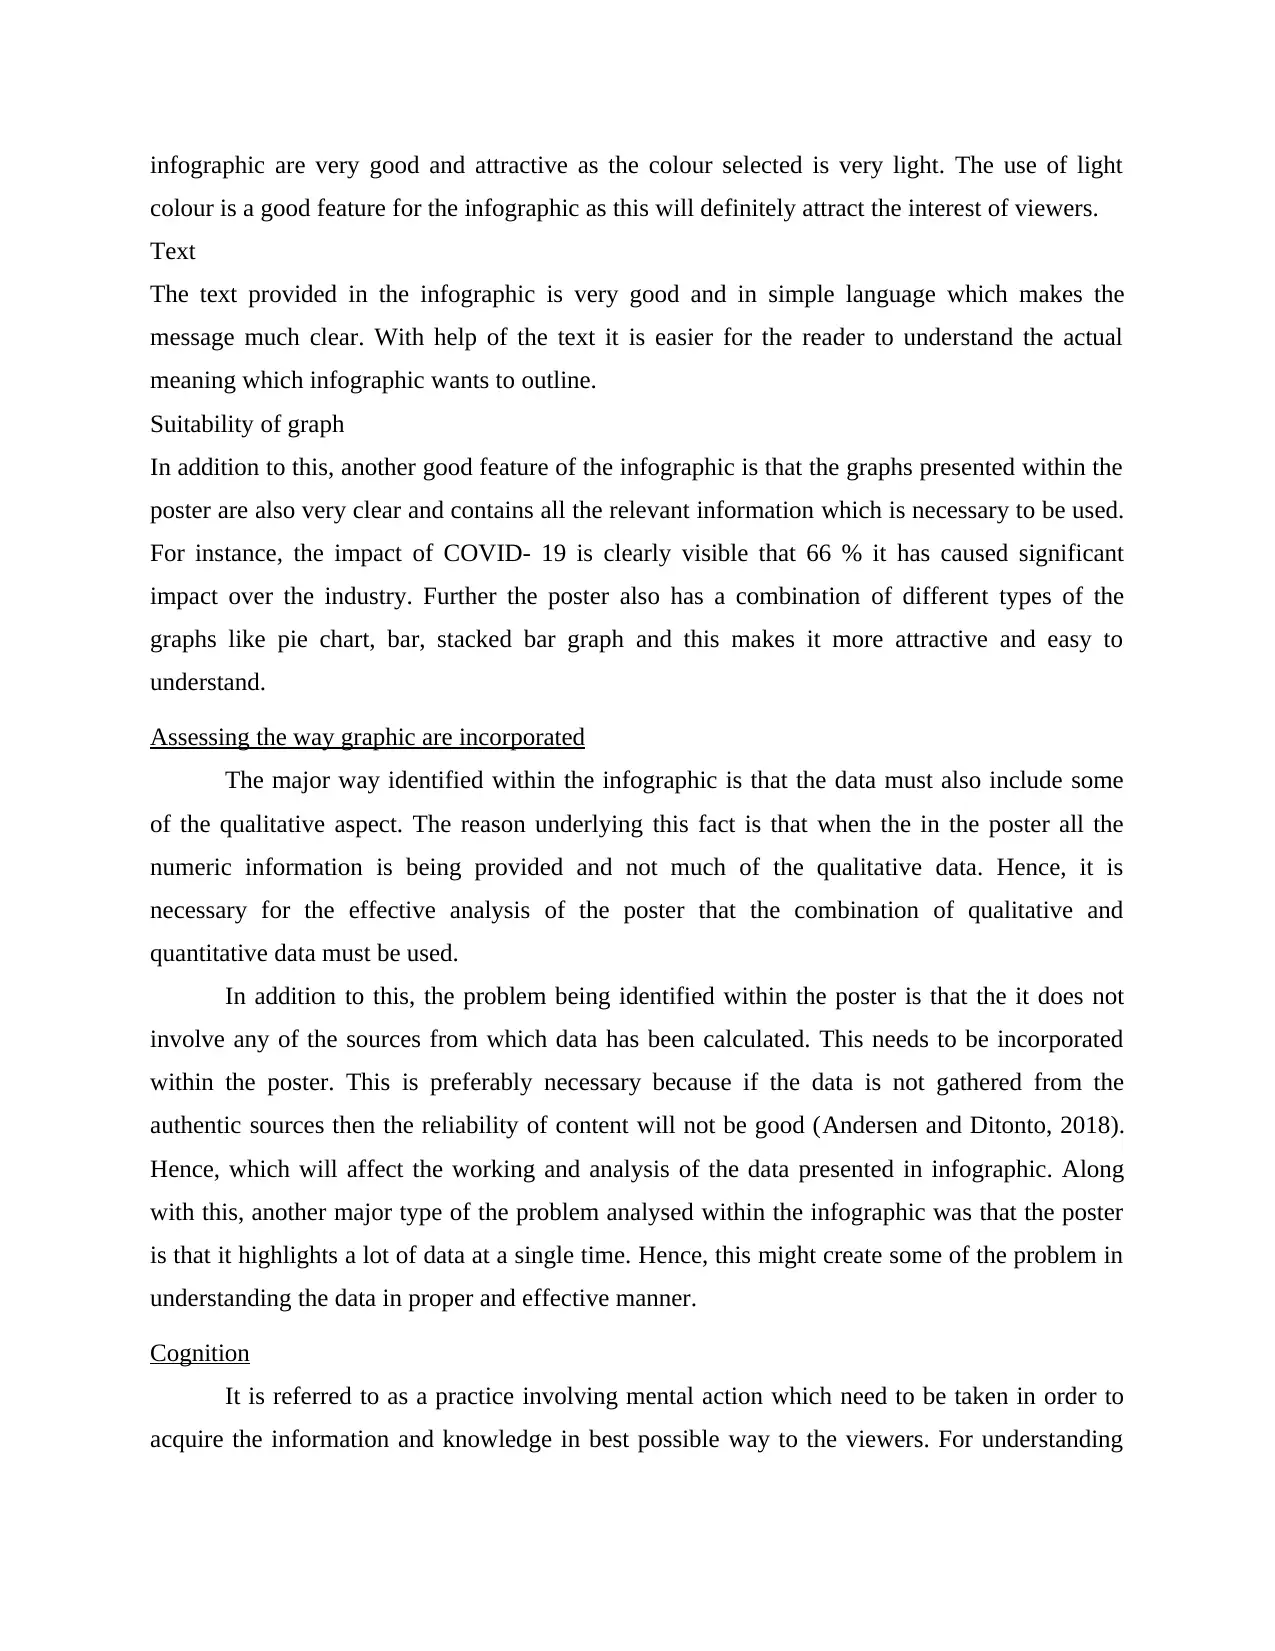
This report provides an analysis of data visualization techniques, specifically focusing on an infographic illustrating the impact of COVID-19 on the print industry. The report assesses the infographic's presentation of information, including its message, use of color, text, and suitability of graphs. It identifies strengths such as the attractive color scheme and clear text, as well as areas for improvement, such as incorporating qualitative data and source information. The report also discusses the importance of cognition in understanding infographics and recommends simplifying content and maintaining an appropriate length to enhance user engagement. The conclusion emphasizes the significance of effective data visualization for clear communication and suggests using diverse charts and simple language for improved reader comprehension. Desklib provides this assignment solution along with a wealth of study resources, including past papers and solved assignments, to support students in their academic endeavors.

AND VISUALISATION OF
DATA
DATA
Paraphrase This Document
Need a fresh take? Get an instant paraphrase of this document with our AI Paraphraser

TABLE OF CONTENTS
INTRODUCTION...........................................................................................................................3
MAIN BODY...................................................................................................................................3
Presentation of the information...................................................................................................3
Assessing the way graphic are incorporated...............................................................................4
Cognition.....................................................................................................................................4
Improving infographic................................................................................................................5
CONCLUSION AND RECOMMEDNATION...............................................................................5
REFERENCES................................................................................................................................6

INTRODUCTION
Data visualisation is being defined as the graphical presentation of the data so that
information is clearly understandable by the viewer. Presentation of data plays a crucial role in
the communication of relevant information with the reader. Hence the current study will outline
the discussion of presenting the information with help of poster. In addition to this, it will also
include the analysis of good features of poster and opportunities of improving the infographic. In
the end the discussion will take place on the problem identified and ways of improving the
infographic will be provided.
MAIN BODY
Presentation of the information
Presentation the information is defined as presenting the data in form of some pictorial
format to the reader (Efroni and et.al., 2019). This is necessary for the reason that when the
information will be presented in clear and effective manner then this will ensure that people have
clear picture of all the information necessary is understandable in clear and effective manner.
With effective presentation of information person can easily analyse the information and draw
conclusion by just having a look at the infographic or the poster.
Message
The current infographic is related with the COVID 19 which is accelerating Print industry
transformation. With respect to the current pandemic the print media industry has improved its
growth hand business. The major reason underlying this fact is that due to pandemic information
sharing has become much necessary and because of this print industry is growing. With the
infographic it is clear that the market disruption will result in effective innovation which in turn
will improve the business of print industry.
Color
For the presentation of the data though poster or infographic it is necessary that it possess
some of the good qualities. This is pertaining to the fact that when the poster will not be having
good features then this will not attract the people viewing the poster. In the current infographic
the good feature which will definitely attract the viewer is the colour selected for the infographic
(Hermans and et.al., 2018). This is particularly because of the reason that colours of the
⊘ This is a preview!⊘
Do you want full access?
Subscribe today to unlock all pages.

Trusted by 1+ million students worldwide

infographic are very good and attractive as the colour selected is very light. The use of light
colour is a good feature for the infographic as this will definitely attract the interest of viewers.
Text
The text provided in the infographic is very good and in simple language which makes the
message much clear. With help of the text it is easier for the reader to understand the actual
meaning which infographic wants to outline.
Suitability of graph
In addition to this, another good feature of the infographic is that the graphs presented within the
poster are also very clear and contains all the relevant information which is necessary to be used.
For instance, the impact of COVID- 19 is clearly visible that 66 % it has caused significant
impact over the industry. Further the poster also has a combination of different types of the
graphs like pie chart, bar, stacked bar graph and this makes it more attractive and easy to
understand.
Assessing the way graphic are incorporated
The major way identified within the infographic is that the data must also include some
of the qualitative aspect. The reason underlying this fact is that when the in the poster all the
numeric information is being provided and not much of the qualitative data. Hence, it is
necessary for the effective analysis of the poster that the combination of qualitative and
quantitative data must be used.
In addition to this, the problem being identified within the poster is that the it does not
involve any of the sources from which data has been calculated. This needs to be incorporated
within the poster. This is preferably necessary because if the data is not gathered from the
authentic sources then the reliability of content will not be good (Andersen and Ditonto, 2018).
Hence, which will affect the working and analysis of the data presented in infographic. Along
with this, another major type of the problem analysed within the infographic was that the poster
is that it highlights a lot of data at a single time. Hence, this might create some of the problem in
understanding the data in proper and effective manner.
Cognition
It is referred to as a practice involving mental action which need to be taken in order to
acquire the information and knowledge in best possible way to the viewers. For understanding
Paraphrase This Document
Need a fresh take? Get an instant paraphrase of this document with our AI Paraphraser

the infographic, it is essential that every aspect of the information is understandable in clear and
effective manner to the readers.
Improving infographic
Hence, for managing this, the major recommendation for improving the data and poster is
that it must be kept simple. This is particularly because of the reason that when the content of the
poster is kept simple then this will definitely attract the attention of the people viewing the data
can easily understand what is the crux of the poster. Further, it is analysed that another way to
improve the poster is that it must not be too lengthy (Hadi, Almilia and Nita, 2019). This is
particularly because of the reason that when the poster will be lengthy or too short then it might
be possible that some of the relevant information is being missed. Hence, it is necessary that the
when the poster is being prepared then it must be of relevant size that is not too short and not too
long. This will definitely attract the attention of the user as the poster is not too lengthy.
CONCLUSION AND RECOMMEDNATION
In the end it is concluded that analysis and visualisation of data is essential for effective
presentation of data. This is particularly because of the reason that when the infographic outlines
the information in proper and effective manner and because of this viewer can easily understand
the information.
Recommendation
 For improving the infographic, it is advisable that they must also involve use of more
good chart in order to attract readers.
 Further it is also advisable to use simple and easy language and make the meaning clearly
understandable.

REFERENCES
Books and Journals
Andersen, D.J. and Ditonto, T., 2018. Information and its presentation: Treatment effects in low-
information vs. high-information experiments. Political Analysis, 26(4), pp.379-398.
Efroni, Z., Metzger, J., Mischau, L. and Schirmbeck, M., 2019. Privacy icons: a risk-based
approach to visualisation of data processing. Eur. Data Prot. L. Rev., 5, p.352.
Hadi, M.Z.M., Almilia, L.S. and Nita, R.A., 2019. Information Presentation Pattern, Information
Order and Framing Effect in Taking Investment Decisions. The Indonesian Journal of
Accounting Research, 22(3).
Hermans, K., and et.al., 2018. Interpretation and visualisation of data from dairy herds. In
Practice, 40(5), pp.195-203.
⊘ This is a preview!⊘
Do you want full access?
Subscribe today to unlock all pages.

Trusted by 1+ million students worldwide
1 out of 6
Related Documents

Your All-in-One AI-Powered Toolkit for Academic Success.
+13062052269
info@desklib.com
Available 24*7 on WhatsApp / Email
Unlock your academic potential
Copyright © 2020–2025 A2Z Services. All Rights Reserved. Developed and managed by ZUCOL.


