COVID-19 Data Analysis: Exploring Impact on GDP and Health Factors
VerifiedAdded on 2023/06/18
|13
|2685
|98
Report
AI Summary
This report analyzes the impact of COVID-19 on GDP and health indicators across 29 European countries using data from the European Centre for Disease Prevention and Control (ECDC). The study employs T-tests to determine differences between COVID-19 cases and GDP classes, as well as GDP classes and first dose administrations. Regression analysis is used to assess the relationship between COVID-19 cases and testing rates, while correlation analysis explores the association between deaths and GDP. The report also investigates predictors of mortality, including COVID-19 cases, GDP, testing, and vaccination rates, ultimately concluding that while strong associations exist between these variables, none can be definitively identified as predictors of death based on the statistical criteria applied. Descriptive statistics further detail the population means, standard deviations, and other key metrics for various health and economic indicators.

Analysing the set of given data
Paraphrase This Document
Need a fresh take? Get an instant paraphrase of this document with our AI Paraphraser
TABLE OF CONTENTS
INTRODUCTION...........................................................................................................................3
Objectives....................................................................................................................................3
Presenting the reason to use inferential statistical technique.......................................................3
Statistical results..........................................................................................................................4
Descriptive statistics....................................................................................................................9
CONCLUSION..............................................................................................................................11
Reflective log.............................................................................................................................11
REFERENCES..............................................................................................................................12
INTRODUCTION
In recent times, entire world I badly affected with pandemic and this not only affect the
human lives, but decrease the economic rates as well. Along with this, there are many countries
where unemployment rates and political stability affected in negative manner. Similarly, the
present study will help to develop an understanding with regard to the changes and impact of
Covid-19 upon the human lives, with number of doses administrated. The entire study is based
upon European Centre for Disease Prevention and Control (ECDC) where number of doses
administrated, where sample of 29 countries are randomly selected in order to meet the
objectives by using relevant inferential statistics.
Objectives
The objectives of the present study is to determine whether:
1. There is a difference between number of COVID cases registered and GDP 2020 classes
2. There is a difference between GDP class and number of first COVID-19 doses
administered.
3. There is an interrelation between
Covid-19 cases and number of test
Number of deaths and GDP (PPP) 2020
Predictors of number of deaths between Covid cases, GDP, sum of tests done and first
dose administered
Presenting the reason to use inferential statistical technique
In order to answer the research question/ objectives, it is necessary to use inferential
statistics that helps to determine the results. There are range of inferential statistics used by the
scholar, depend upon their requirements. Similarly, in order to determine the answer of objective
1 and 2, T-Test as an inferential statistic uses which helps to determine the mean of two groups
i.e. Covid cases registered and GDP 2020 as well as GDP classes and first doses administered.
Apart from this, in order to determine the interrelationship between the values of Covid-19 cases
and number of test done, regression will be used (Data on the daily number of new reported
COVID-19 cases and deaths by EU/EEA country, 2021). This inferential tool will assist to
⊘ This is a preview!⊘
Do you want full access?
Subscribe today to unlock all pages.
Trusted by 1+ million students worldwide
determine the dependency between the variables and identify whether there is an association
between them or not.
In addition to this, to prove the association between the variables such as Number of
deaths and GDP (PPP) 2020, Correlation as an inferential tool has used. This in turn reflect the
association between the variables which entails there is any impact of one variable over other.
Apart from this, in order to determine the predictors of number of deaths between Covid-19 and
others, regression analysis has performed that assists to answer the research objectives.
Statistical results
T-test
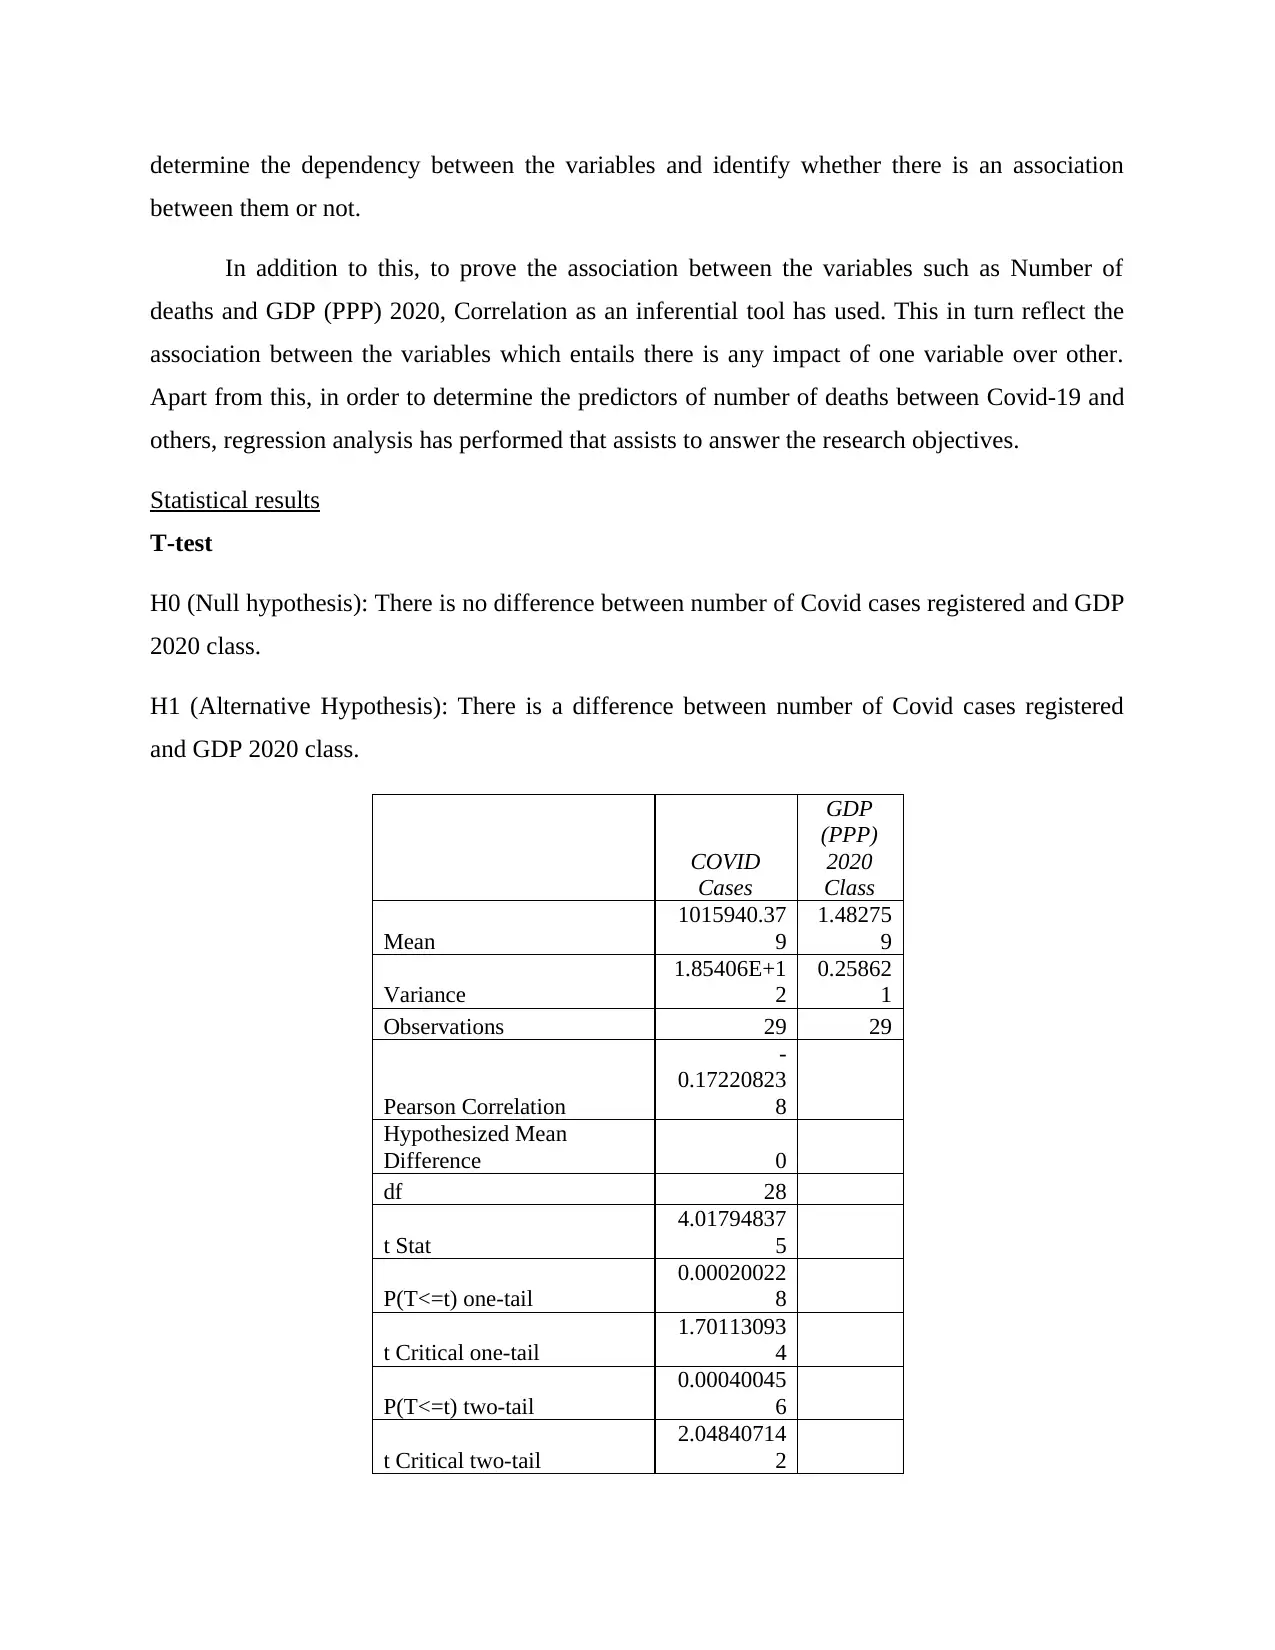
H0 (Null hypothesis): There is no difference between number of Covid cases registered and GDP
2020 class.
H1 (Alternative Hypothesis): There is a difference between number of Covid cases registered
and GDP 2020 class.
COVID
Cases
GDP
(PPP)
2020
Class
Mean
1015940.37
9
1.48275
9
Variance
1.85406E+1
2
0.25862
1
Observations 29 29
Pearson Correlation
-
0.17220823
8
Hypothesized Mean
Difference 0
df 28
t Stat
4.01794837
5
P(T<=t) one-tail
0.00020022
8
t Critical one-tail
1.70113093
4
P(T<=t) two-tail
0.00040045
6
t Critical two-tail
2.04840714
2
between them or not.
In addition to this, to prove the association between the variables such as Number of
deaths and GDP (PPP) 2020, Correlation as an inferential tool has used. This in turn reflect the
association between the variables which entails there is any impact of one variable over other.
Apart from this, in order to determine the predictors of number of deaths between Covid-19 and
others, regression analysis has performed that assists to answer the research objectives.
Statistical results
T-test
H0 (Null hypothesis): There is no difference between number of Covid cases registered and GDP
2020 class.
H1 (Alternative Hypothesis): There is a difference between number of Covid cases registered
and GDP 2020 class.
COVID
Cases
GDP
(PPP)
2020
Class
Mean
1015940.37
9
1.48275
9
Variance
1.85406E+1
2
0.25862
1
Observations 29 29
Pearson Correlation
-
0.17220823
8
Hypothesized Mean
Difference 0
df 28
t Stat
4.01794837
5
P(T<=t) one-tail
0.00020022
8
t Critical one-tail
1.70113093
4
P(T<=t) two-tail
0.00040045
6
t Critical two-tail
2.04840714
2
Paraphrase This Document
Need a fresh take? Get an instant paraphrase of this document with our AI Paraphraser
Interpretation: In accordance with the above table, it has been interpreted that there is a
difference between number of covid cases registered and GDP 2020 classes. It is so because the
value of P (0.00) is less than 0.05 which reflected that null hypothesis is rejected over other. This
in turn reflected that there due to rise in Covid cases, the GDP class is also changes. It is so
because once the cases increases, it affects the GDP cases and this in turn might increase or
decreases the GDP class within countries. Moreover, the mean of Covid cases is 1015940.39
whereas GDP (PPP) cases is 1.48 only. Thus, it shows that there is a direct impact over the
variables when there is change in one of them.
T-Test
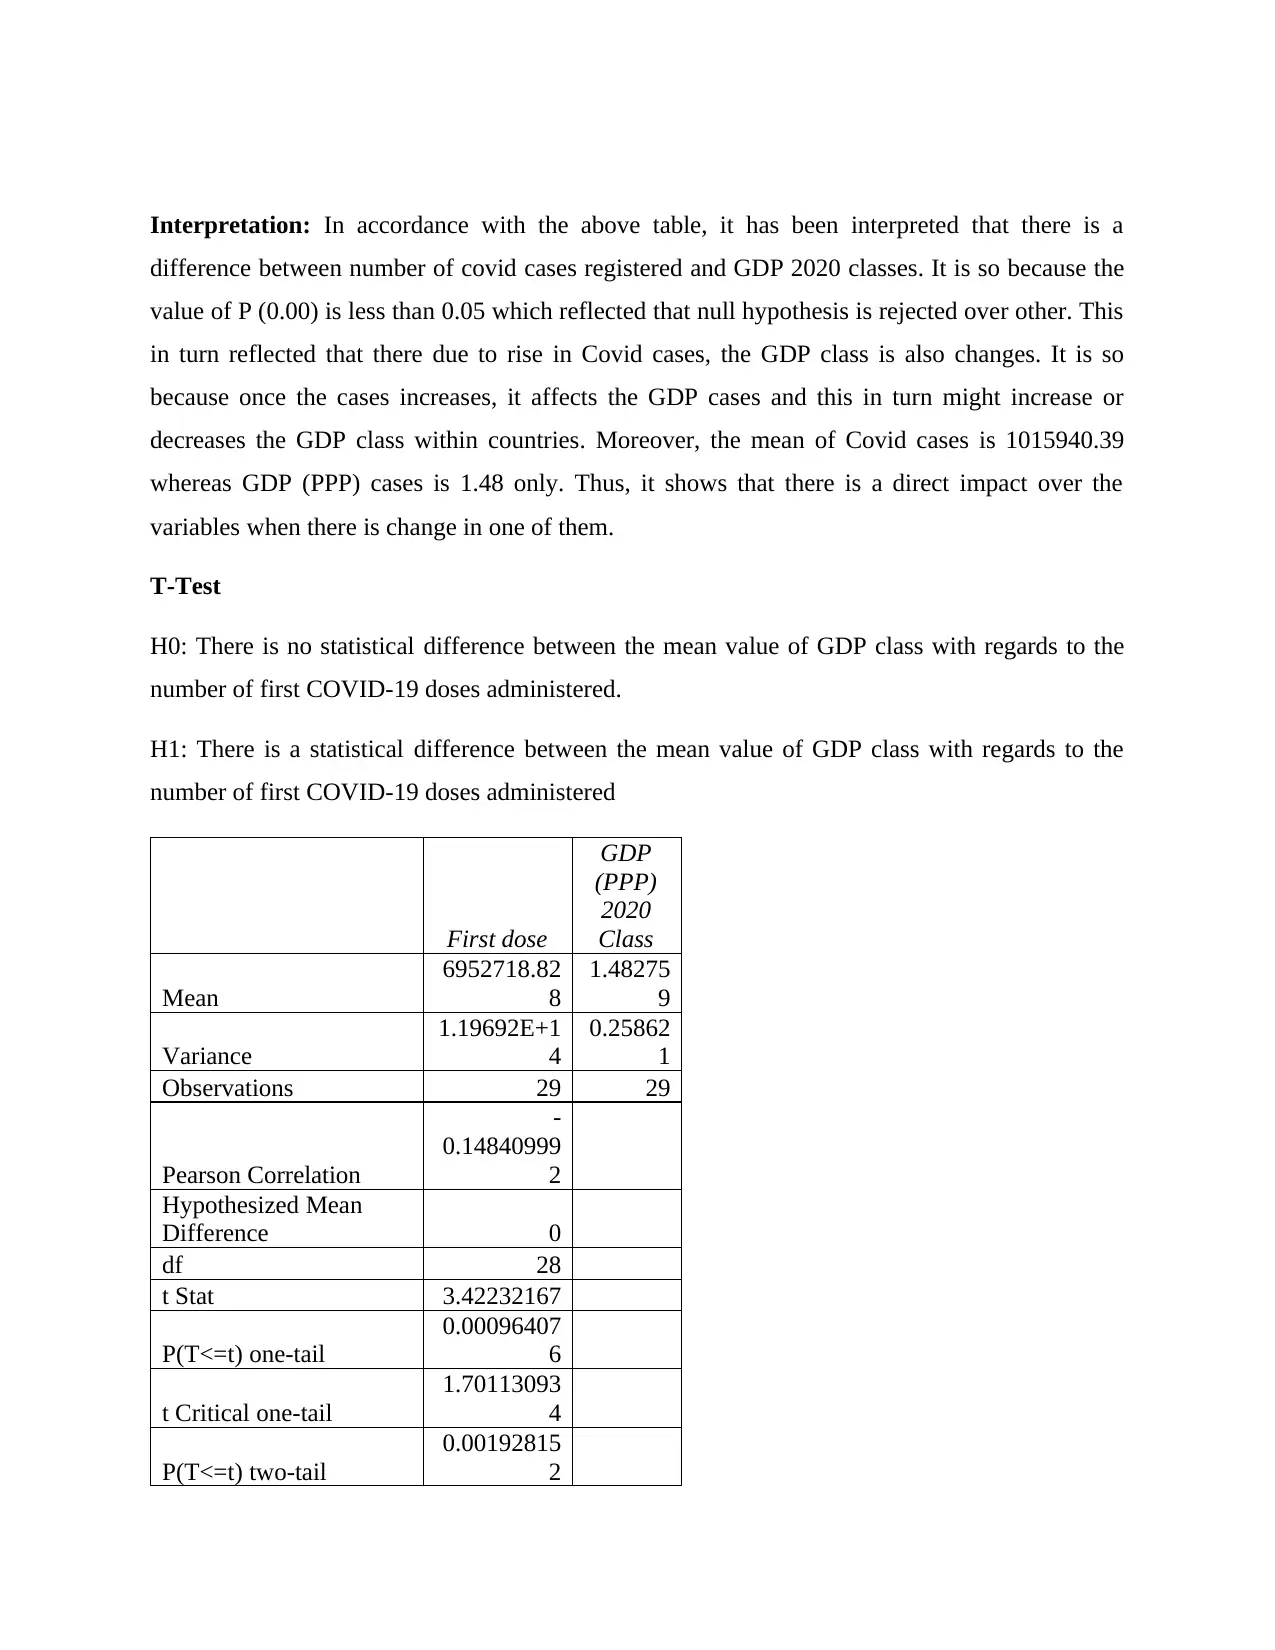
H0: There is no statistical difference between the mean value of GDP class with regards to the
number of first COVID-19 doses administered.
H1: There is a statistical difference between the mean value of GDP class with regards to the
number of first COVID-19 doses administered
First dose
GDP
(PPP)
2020
Class
Mean
6952718.82
8
1.48275
9
Variance
1.19692E+1
4
0.25862
1
Observations 29 29
Pearson Correlation
-
0.14840999
2
Hypothesized Mean
Difference 0
df 28
t Stat 3.42232167
P(T<=t) one-tail
0.00096407
6
t Critical one-tail
1.70113093
4
P(T<=t) two-tail
0.00192815
2
difference between number of covid cases registered and GDP 2020 classes. It is so because the
value of P (0.00) is less than 0.05 which reflected that null hypothesis is rejected over other. This
in turn reflected that there due to rise in Covid cases, the GDP class is also changes. It is so
because once the cases increases, it affects the GDP cases and this in turn might increase or
decreases the GDP class within countries. Moreover, the mean of Covid cases is 1015940.39
whereas GDP (PPP) cases is 1.48 only. Thus, it shows that there is a direct impact over the
variables when there is change in one of them.
T-Test
H0: There is no statistical difference between the mean value of GDP class with regards to the
number of first COVID-19 doses administered.
H1: There is a statistical difference between the mean value of GDP class with regards to the
number of first COVID-19 doses administered
First dose
GDP
(PPP)
2020
Class
Mean
6952718.82
8
1.48275
9
Variance
1.19692E+1
4
0.25862
1
Observations 29 29
Pearson Correlation
-
0.14840999
2
Hypothesized Mean
Difference 0
df 28
t Stat 3.42232167
P(T<=t) one-tail
0.00096407
6
t Critical one-tail
1.70113093
4
P(T<=t) two-tail
0.00192815
2
t Critical two-tail
2.04840714
2
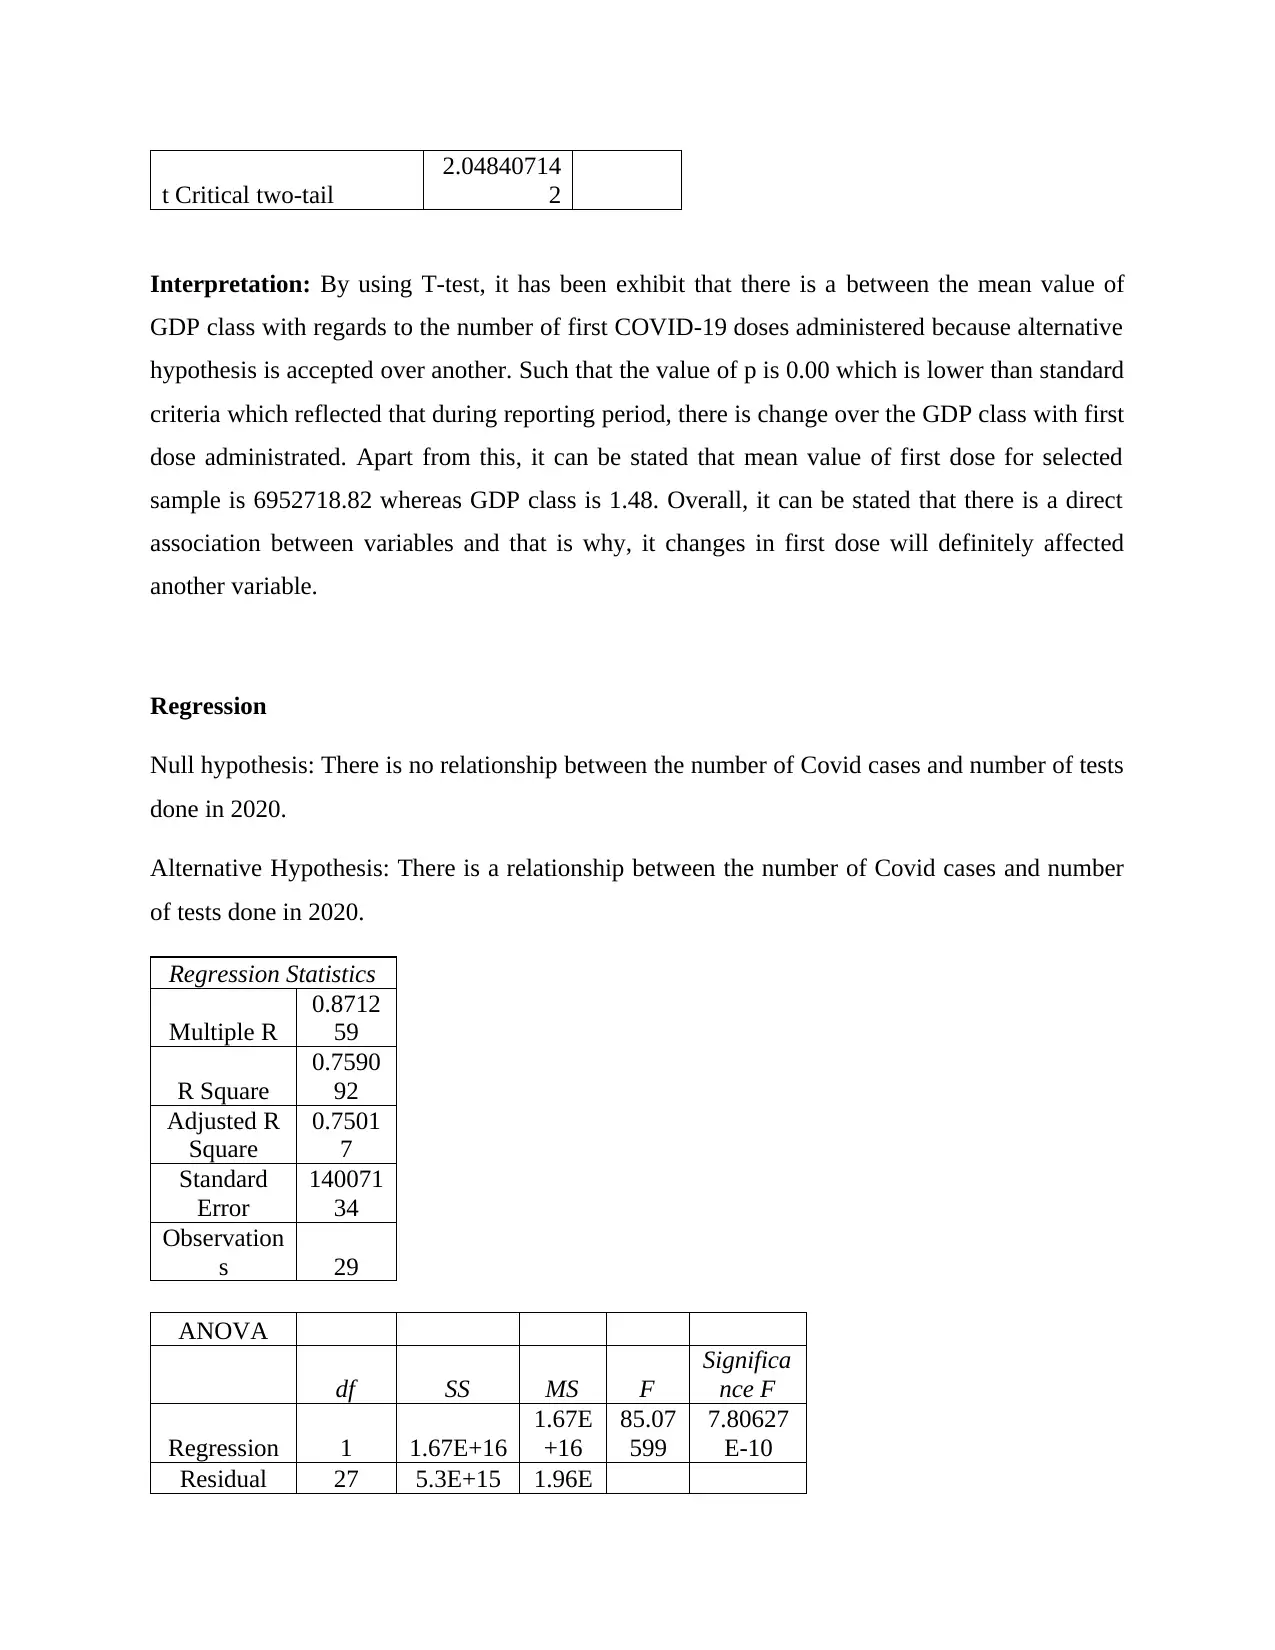
Interpretation: By using T-test, it has been exhibit that there is a between the mean value of
GDP class with regards to the number of first COVID-19 doses administered because alternative
hypothesis is accepted over another. Such that the value of p is 0.00 which is lower than standard
criteria which reflected that during reporting period, there is change over the GDP class with first
dose administrated. Apart from this, it can be stated that mean value of first dose for selected
sample is 6952718.82 whereas GDP class is 1.48. Overall, it can be stated that there is a direct
association between variables and that is why, it changes in first dose will definitely affected
another variable.
Regression
Null hypothesis: There is no relationship between the number of Covid cases and number of tests
done in 2020.
Alternative Hypothesis: There is a relationship between the number of Covid cases and number
of tests done in 2020.
Regression Statistics
Multiple R
0.8712
59
R Square
0.7590
92
Adjusted R
Square
0.7501
7
Standard
Error
140071
34
Observation
s 29
ANOVA
df SS MS F
Significa
nce F
Regression 1 1.67E+16
1.67E
+16
85.07
599
7.80627
E-10
Residual 27 5.3E+15 1.96E
2.04840714
2
Interpretation: By using T-test, it has been exhibit that there is a between the mean value of
GDP class with regards to the number of first COVID-19 doses administered because alternative
hypothesis is accepted over another. Such that the value of p is 0.00 which is lower than standard
criteria which reflected that during reporting period, there is change over the GDP class with first
dose administrated. Apart from this, it can be stated that mean value of first dose for selected
sample is 6952718.82 whereas GDP class is 1.48. Overall, it can be stated that there is a direct
association between variables and that is why, it changes in first dose will definitely affected
another variable.
Regression
Null hypothesis: There is no relationship between the number of Covid cases and number of tests
done in 2020.
Alternative Hypothesis: There is a relationship between the number of Covid cases and number
of tests done in 2020.
Regression Statistics
Multiple R
0.8712
59
R Square
0.7590
92
Adjusted R
Square
0.7501
7
Standard
Error
140071
34
Observation
s 29
ANOVA
df SS MS F
Significa
nce F
Regression 1 1.67E+16
1.67E
+16
85.07
599
7.80627
E-10
Residual 27 5.3E+15 1.96E
⊘ This is a preview!⊘
Do you want full access?
Subscribe today to unlock all pages.
Trusted by 1+ million students worldwide
+14
Total 28 2.2E+16
Coeffic
ients
Standard
Error t Stat
P-
value
Lower
95%
Upper
95%
Lower
95.0%
Upper
95.0%
Intercept
127420
3 3265930
0.390
15
0.699
487
-
5426932.
278
797533
8
-
5426932 7975338
COVID
Cases
17.931
29 1.944053
9.223
665
7.81E
-10
13.94242
438
21.920
16
13.9424
2
21.9201
6
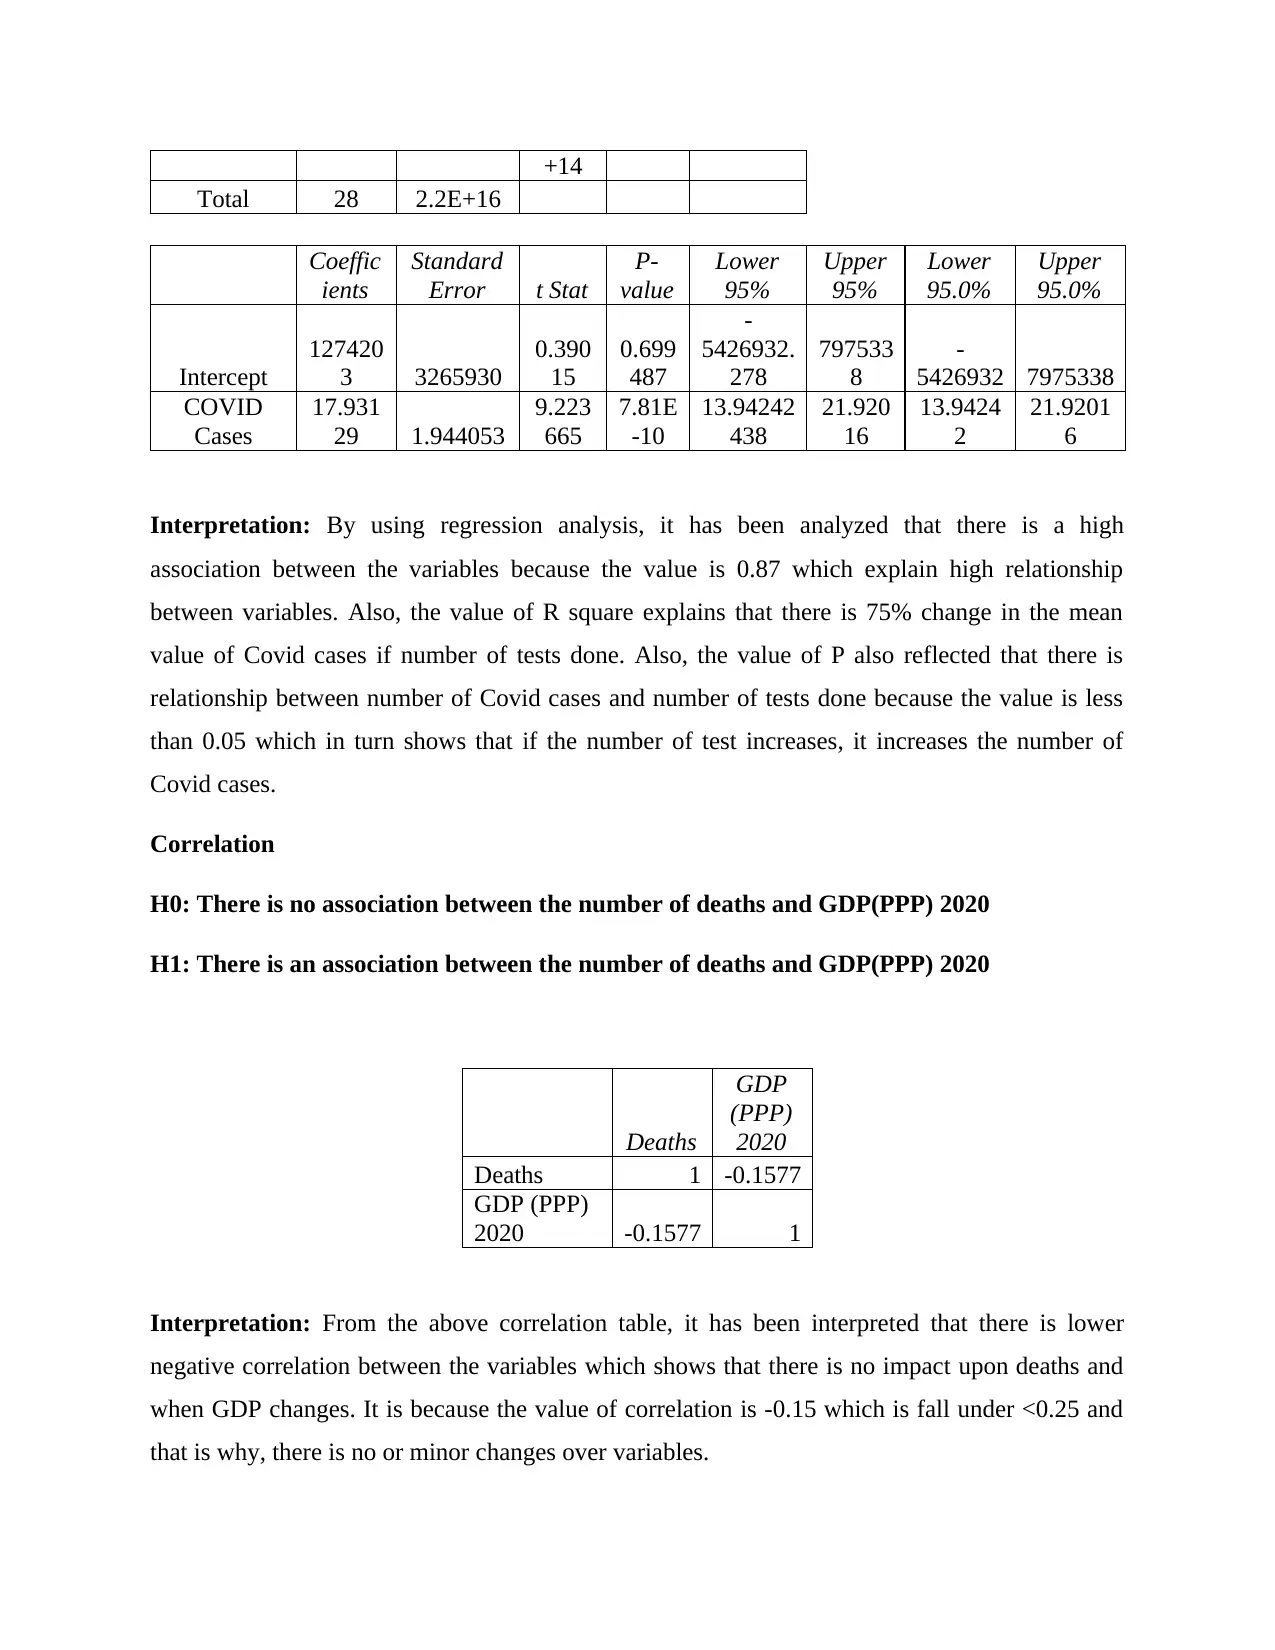
Interpretation: By using regression analysis, it has been analyzed that there is a high
association between the variables because the value is 0.87 which explain high relationship
between variables. Also, the value of R square explains that there is 75% change in the mean
value of Covid cases if number of tests done. Also, the value of P also reflected that there is
relationship between number of Covid cases and number of tests done because the value is less
than 0.05 which in turn shows that if the number of test increases, it increases the number of
Covid cases.
Correlation
H0: There is no association between the number of deaths and GDP(PPP) 2020
H1: There is an association between the number of deaths and GDP(PPP) 2020
Deaths
GDP
(PPP)
2020
Deaths 1 -0.1577
GDP (PPP)
2020 -0.1577 1
Interpretation: From the above correlation table, it has been interpreted that there is lower
negative correlation between the variables which shows that there is no impact upon deaths and
when GDP changes. It is because the value of correlation is -0.15 which is fall under <0.25 and
that is why, there is no or minor changes over variables.
Total 28 2.2E+16
Coeffic
ients
Standard
Error t Stat
P-
value
Lower
95%
Upper
95%
Lower
95.0%
Upper
95.0%
Intercept
127420
3 3265930
0.390
15
0.699
487
-
5426932.
278
797533
8
-
5426932 7975338
COVID
Cases
17.931
29 1.944053
9.223
665
7.81E
-10
13.94242
438
21.920
16
13.9424
2
21.9201
6
Interpretation: By using regression analysis, it has been analyzed that there is a high
association between the variables because the value is 0.87 which explain high relationship
between variables. Also, the value of R square explains that there is 75% change in the mean
value of Covid cases if number of tests done. Also, the value of P also reflected that there is
relationship between number of Covid cases and number of tests done because the value is less
than 0.05 which in turn shows that if the number of test increases, it increases the number of
Covid cases.
Correlation
H0: There is no association between the number of deaths and GDP(PPP) 2020
H1: There is an association between the number of deaths and GDP(PPP) 2020
Deaths
GDP
(PPP)
2020
Deaths 1 -0.1577
GDP (PPP)
2020 -0.1577 1
Interpretation: From the above correlation table, it has been interpreted that there is lower
negative correlation between the variables which shows that there is no impact upon deaths and
when GDP changes. It is because the value of correlation is -0.15 which is fall under <0.25 and
that is why, there is no or minor changes over variables.
Paraphrase This Document
Need a fresh take? Get an instant paraphrase of this document with our AI Paraphraser
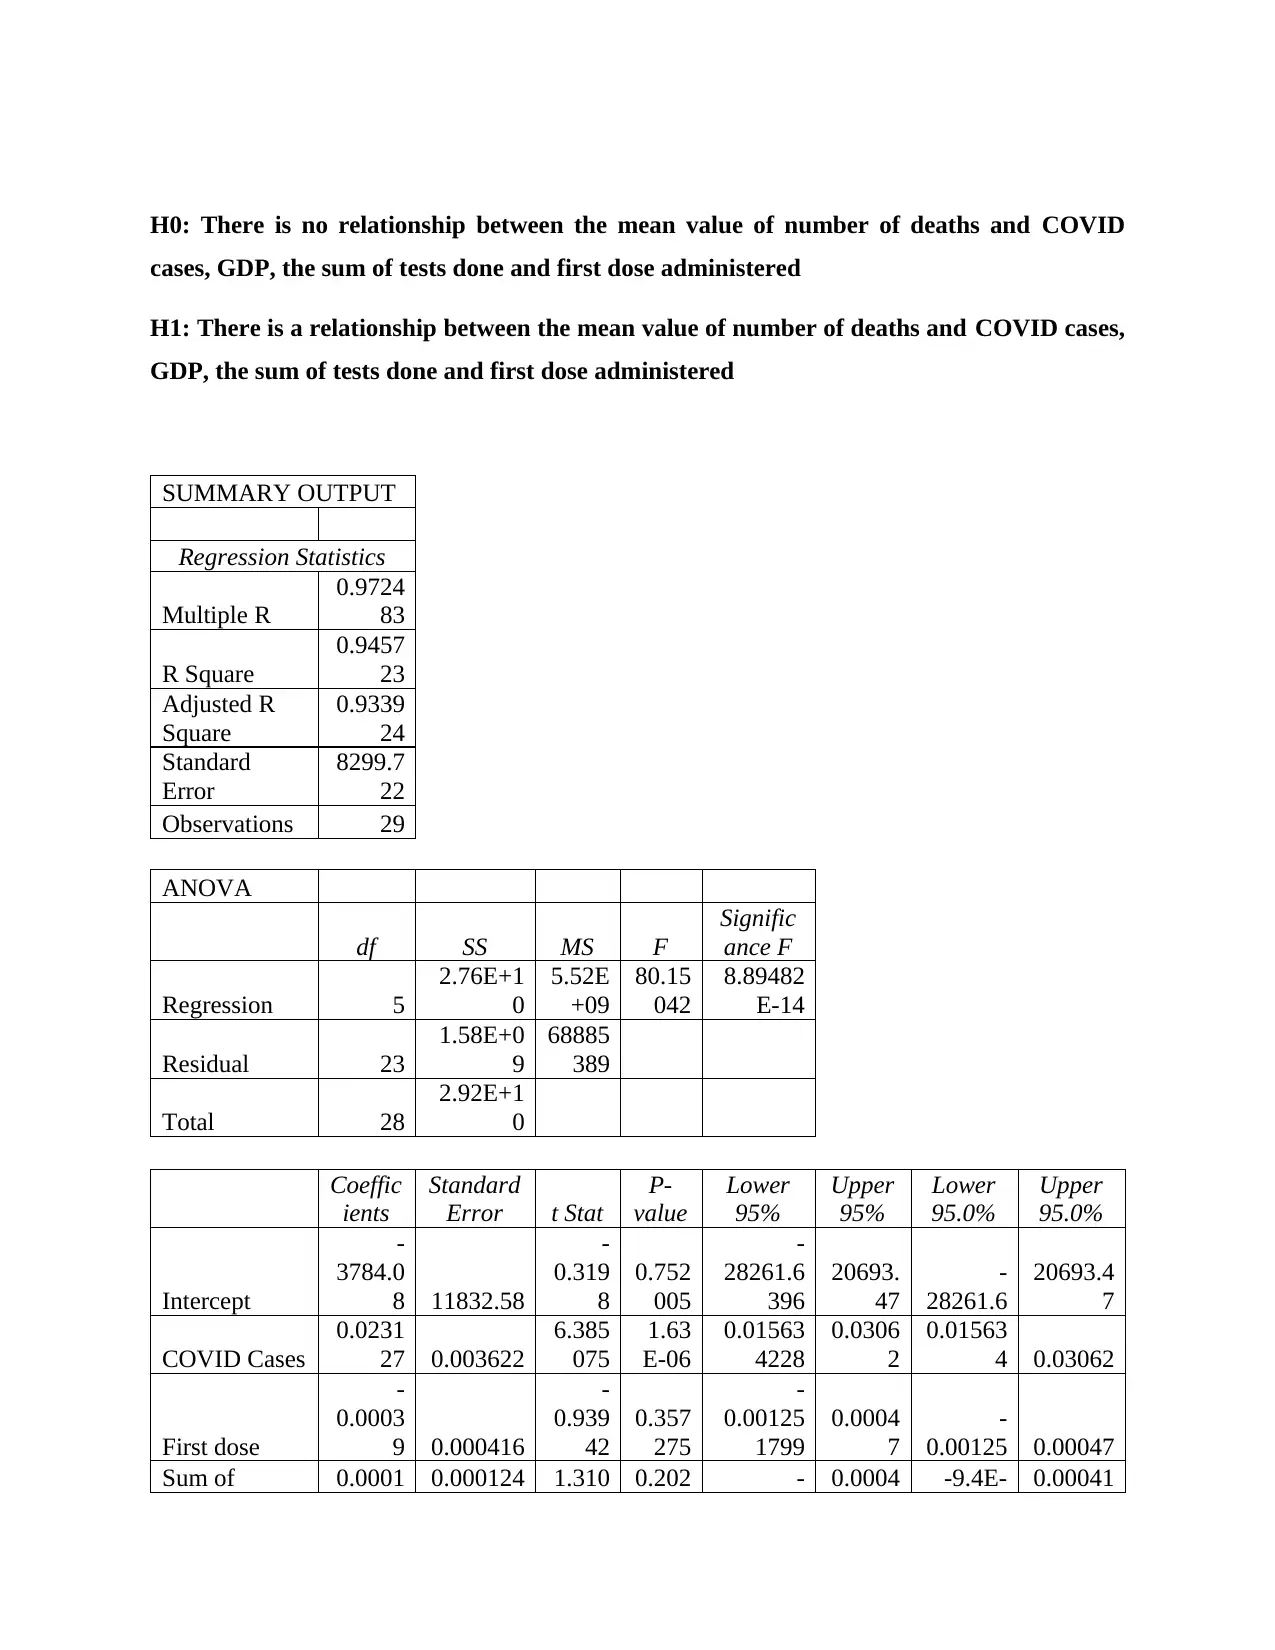
H0: There is no relationship between the mean value of number of deaths and COVID
cases, GDP, the sum of tests done and first dose administered
H1: There is a relationship between the mean value of number of deaths and COVID cases,
GDP, the sum of tests done and first dose administered
SUMMARY OUTPUT
Regression Statistics
Multiple R
0.9724
83
R Square
0.9457
23
Adjusted R
Square
0.9339
24
Standard
Error
8299.7
22
Observations 29
ANOVA
df SS MS F
Signific
ance F
Regression 5
2.76E+1
0
5.52E
+09
80.15
042
8.89482
E-14
Residual 23
1.58E+0
9
68885
389
Total 28
2.92E+1
0
Coeffic
ients
Standard
Error t Stat
P-
value
Lower
95%
Upper
95%
Lower
95.0%
Upper
95.0%
Intercept
-
3784.0
8 11832.58
-
0.319
8
0.752
005
-
28261.6
396
20693.
47
-
28261.6
20693.4
7
COVID Cases
0.0231
27 0.003622
6.385
075
1.63
E-06
0.01563
4228
0.0306
2
0.01563
4 0.03062
First dose
-
0.0003
9 0.000416
-
0.939
42
0.357
275
-
0.00125
1799
0.0004
7
-
0.00125 0.00047
Sum of 0.0001 0.000124 1.310 0.202 - 0.0004 -9.4E- 0.00041
tests_done 63 917 824
9.40405
E-05 19 05 9
GDP (PPP)
2020
-
0.0424 0.117519
-
0.360
76
0.721
57
-
0.28550
3836
0.2007
11 -0.2855
0.20071
1
GDP (PPP)
2020 Class
3159.6
06 4567.346
0.691
782
0.495
999
-
6288.67
0002
12607.
88
-
6288.67
12607.8
8
1 2 3 4 5 6 7 8 9 10 11 12 13 14 15 16 17 18 19 20 21 22 23 24 25 26 27 28 29
0
20,000,000
40,000,000
60,000,000
80,000,000
100,000,000
120,000,000
f(x) = − 233892.303448276 x + 22999710.3448276
Regression
COVID Cases First dose
Sum of tests_done Linear (Sum of tests_done)
GDP (PPP) 2020 GDP (PPP) 2020 Class
Deaths
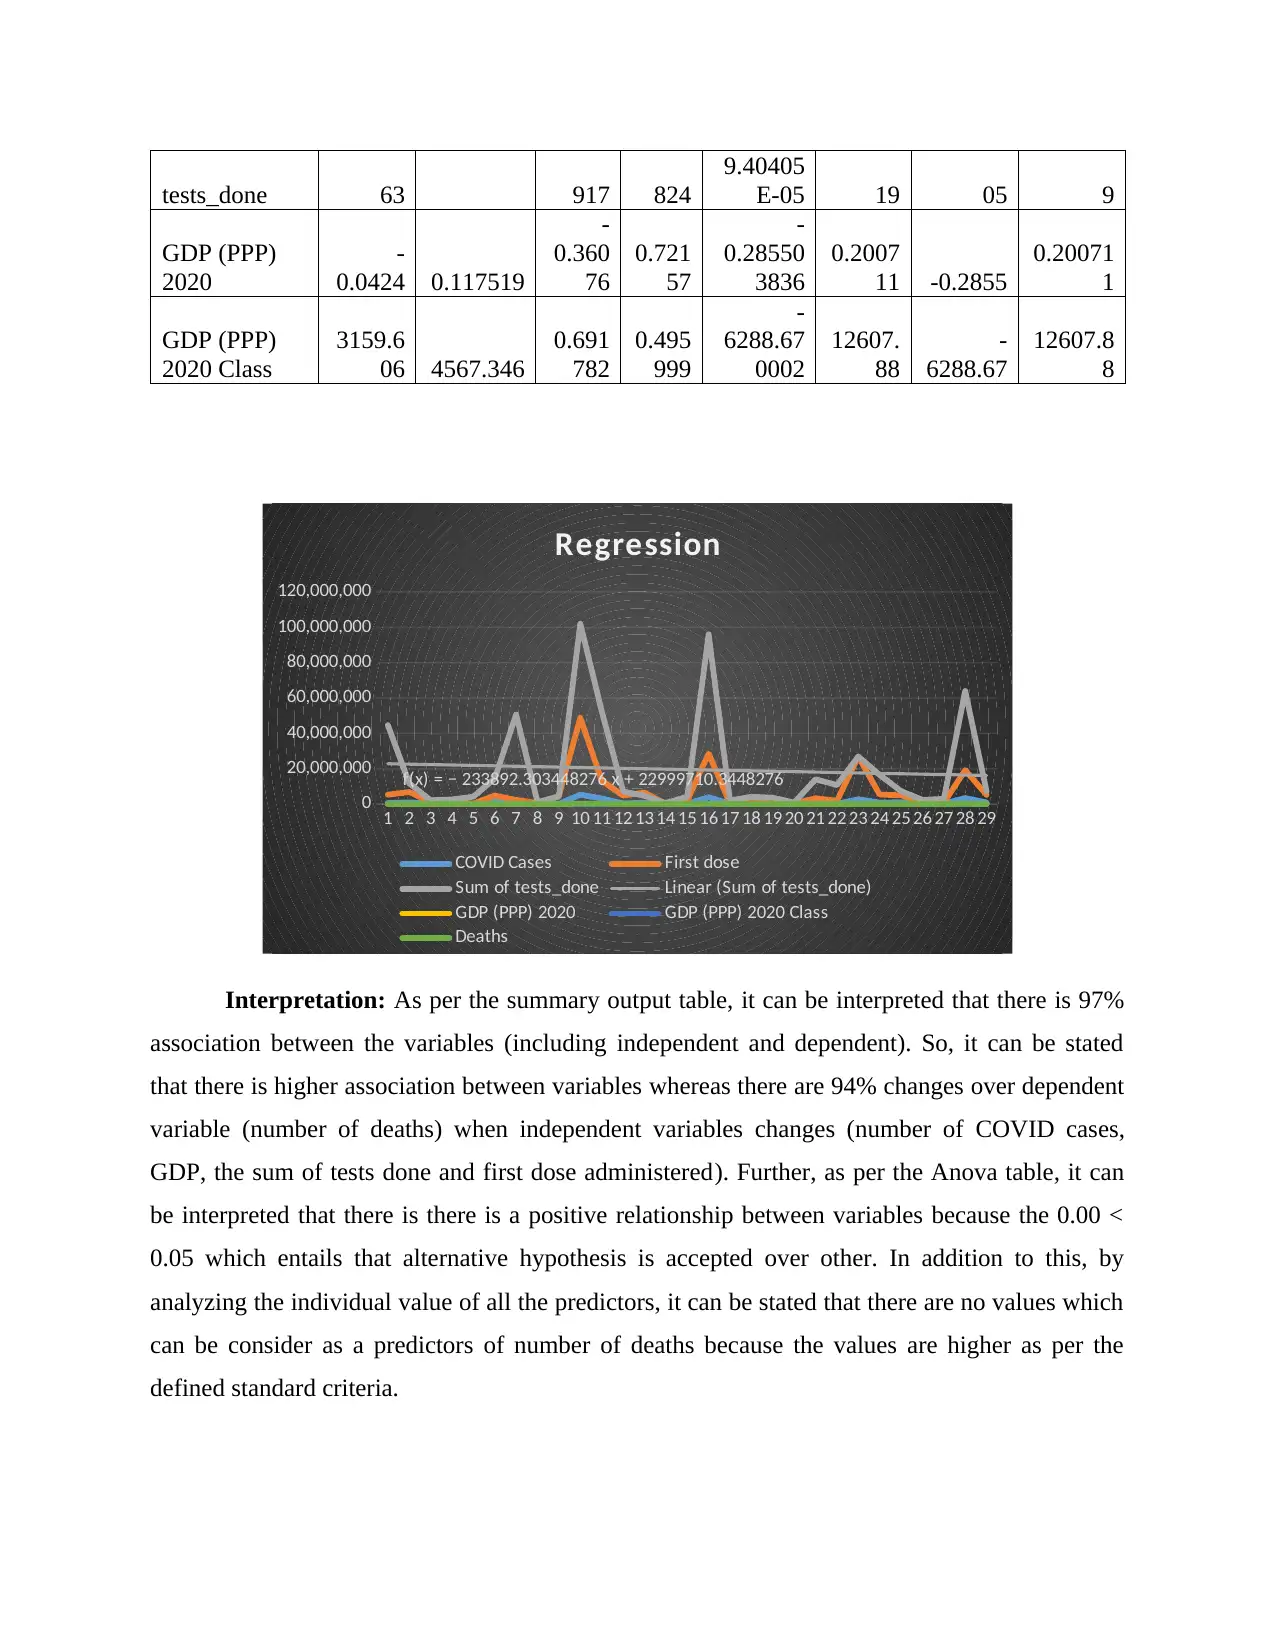
Interpretation: As per the summary output table, it can be interpreted that there is 97%
association between the variables (including independent and dependent). So, it can be stated
that there is higher association between variables whereas there are 94% changes over dependent
variable (number of deaths) when independent variables changes (number of COVID cases,
GDP, the sum of tests done and first dose administered). Further, as per the Anova table, it can
be interpreted that there is there is a positive relationship between variables because the 0.00 <
0.05 which entails that alternative hypothesis is accepted over other. In addition to this, by
analyzing the individual value of all the predictors, it can be stated that there are no values which
can be consider as a predictors of number of deaths because the values are higher as per the
defined standard criteria.
9.40405
E-05 19 05 9
GDP (PPP)
2020
-
0.0424 0.117519
-
0.360
76
0.721
57
-
0.28550
3836
0.2007
11 -0.2855
0.20071
1
GDP (PPP)
2020 Class
3159.6
06 4567.346
0.691
782
0.495
999
-
6288.67
0002
12607.
88
-
6288.67
12607.8
8
1 2 3 4 5 6 7 8 9 10 11 12 13 14 15 16 17 18 19 20 21 22 23 24 25 26 27 28 29
0
20,000,000
40,000,000
60,000,000
80,000,000
100,000,000
120,000,000
f(x) = − 233892.303448276 x + 22999710.3448276
Regression
COVID Cases First dose
Sum of tests_done Linear (Sum of tests_done)
GDP (PPP) 2020 GDP (PPP) 2020 Class
Deaths
Interpretation: As per the summary output table, it can be interpreted that there is 97%
association between the variables (including independent and dependent). So, it can be stated
that there is higher association between variables whereas there are 94% changes over dependent
variable (number of deaths) when independent variables changes (number of COVID cases,
GDP, the sum of tests done and first dose administered). Further, as per the Anova table, it can
be interpreted that there is there is a positive relationship between variables because the 0.00 <
0.05 which entails that alternative hypothesis is accepted over other. In addition to this, by
analyzing the individual value of all the predictors, it can be stated that there are no values which
can be consider as a predictors of number of deaths because the values are higher as per the
defined standard criteria.
⊘ This is a preview!⊘
Do you want full access?
Subscribe today to unlock all pages.
Trusted by 1+ million students worldwide
Descriptive statistics
Po
pul
atio
n
COV
ID
Case
s
Fir
st
dos
e
Sec
ond
dos
e
Hosp
italiz
ation
ICU
Admi
ssion
Sum
of
tests_
done
positiv
ity_rat
e (%)
De
ath
s
GDP
(PPP)
2020
GDP
(PPP)
2020
Class
Mean
156
224
70
1015
940
695
271
9
272
766
8
1109
104
2078
28.2
19491
326
6.6168
8
22
90
4.6
6
45873
.24
1.48275
9
Standa
rd
Error
404
209
1
2528
50.1
203
157
9
776
043.
2
3889
05.5
6616
3.27
52038
83
0.6977
66
59
95.
72
2
3497.
967
0.09443
5
Media
n
695
148
2
3760
67
324
773
0
889
046
3936
17
8443
8
71094
71
6.5660
69
96
82 40066 1
Mode
#N/
A
#N/
A
#N/
A
#N/
A #N/A #N/A #N/A #N/A
#N
/A #N/A 1
Standa
rd
Deviat
ion
217
673
29
1361
640
109
403
88
417
912
1
1944
527
2958
91.1
28023
770
3.7575
86
32
28
7.9
5
18837
.13
0.50854
8
Sampl
e
Varian
ce
4.7
4E+
14
1.85
E+1
2
1.2
E+
14
1.75
E+1
3
3.78
E+12
8.76
E+10
7.85E
+14
14.119
45
1.0
4E
+0
9
3.55E
+08
0.25862
1
Kurtos
is
3.2
339
9
2.76
2855
7.3
949
98
5.57
709
7
5.763
169
2.536
741
2.990
864
-
0.5759
3
2.4
02
87
5
5.298
586 -2.14815
Skewn
ess
2.0
174
4
1.83
6941
2.6
358
16
2.36
339
9
2.521
944
1.839
09
1.931
769
0.3411
85
1.8
25
52
6
2.036
636
0.07282
9
Range
828
025
77
5289
893
486
405
89
175
605
44
7232
825
1017
583
1.01E
+08
13.469
82
11
72
14 89134 1
Minim
um
364
134 6329
132
757
531
64 4468 395
55110
1
1.2186
11 29 23741 1
Maxim
um
831
667
11
5296
222
487
733
46
176
137
08
7237
293
1017
978
1.02E
+08
14.688
44
11
72
43
11287
5 2
Sum 4.5
3E+
2946
2271
2.0
2E
791
023
2772
7606
4156
563
5.65E
+08
191.88
95
66
42
13303
24
43
Paraphrase This Document
Need a fresh take? Get an instant paraphrase of this document with our AI Paraphraser
08
+0
8 86 35
Count 29 29 29 29 25 20 29 29 29 29 29
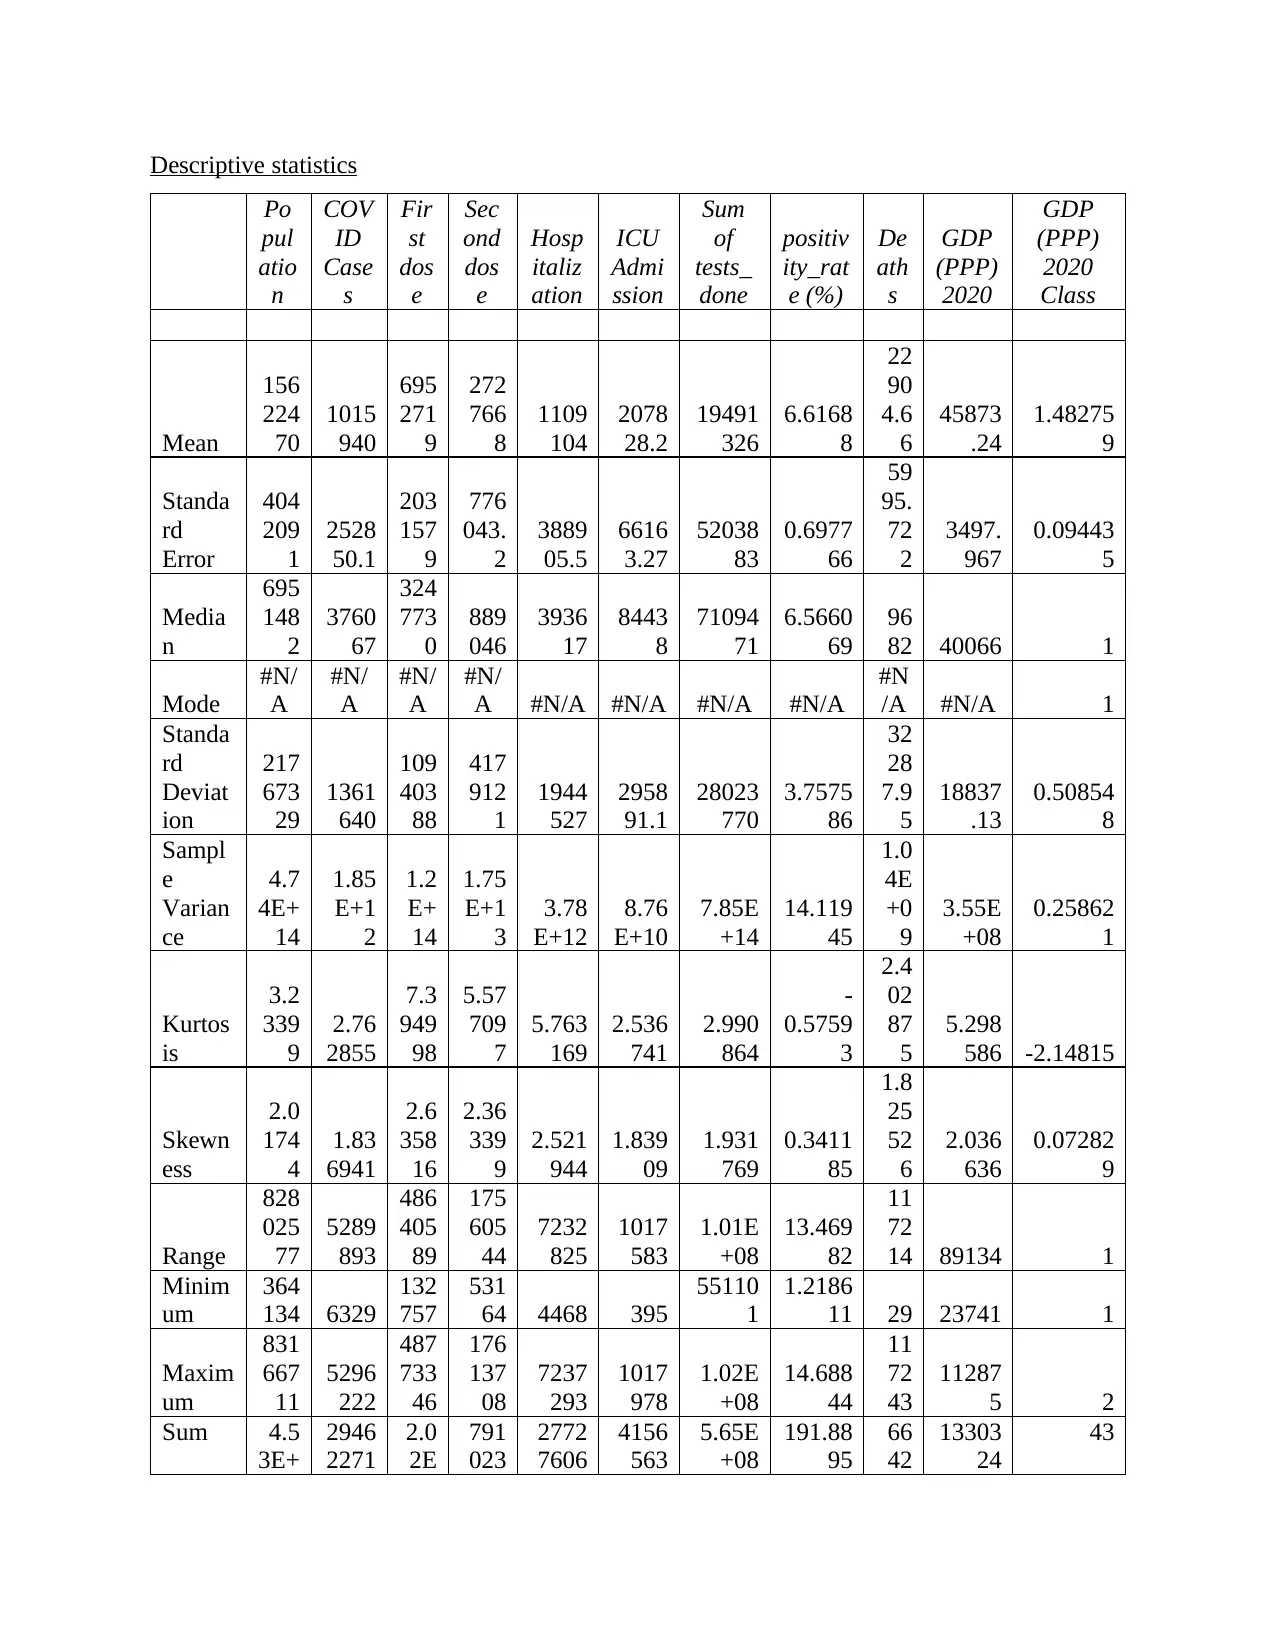
Interpretation: As per the above descriptive statistics, it can be interpreted that average
of population for 1st January 2020 is 15622470 whereas 50% of the Covid cases 376067. Also,
the mean of test done within a particular date is 19491326, while deaths is 22904.66. This in turn
shows that there is the number of cases administrated are higher than the number of deaths.
However, the median and repetition of GDP (PPP) class reflected that there is GDP is greater
than 40000. In addition to this, 50% of the sample selected reflected that there are 84438 patients
admitted in ICU while 1109104 is the average number of hospitalization. Further, 6952719 and
2727668 is the mean of taking first and second dose respectively. Overall, it can be stated that
there is no actual trend identified over the entire data which helps to determine the actual
condition for the year of 2020.
CONCLUSION
By summing up above report it has been concluded that inferential test has been used in
order to determine the association between variables. Also, the data reflected that there is a
significant relationship between number of Covid cases and number of test done, along with this
there is lower and negative relationship between number of deaths and GDP (PPP) 2020.
However, by applying T test, it has been identified that there a GDP 2020 class difference in the
number of COVID cases registered as well as first COVID-19 doses administered. Hence, this
inferential statistical analysis assists to generate the best outcomes and meet the research
objectives as well.
Reflective log
The overall journey of quantitative data analysis is good and provide me an opportunity
to understand the terms in effective manner. I also did not find the current project challenging
because the material helps me to understand the key aspects like inferential tools. However, I
also find some difficulties while completing the project and this in turn affect the results as well.
Such that data analysis option was not available on my Laptop and I did not know how to turn on
this. So, with the help of teacher I am able to display the function over excel by using Add-ins
+0
8 86 35
Count 29 29 29 29 25 20 29 29 29 29 29
Interpretation: As per the above descriptive statistics, it can be interpreted that average
of population for 1st January 2020 is 15622470 whereas 50% of the Covid cases 376067. Also,
the mean of test done within a particular date is 19491326, while deaths is 22904.66. This in turn
shows that there is the number of cases administrated are higher than the number of deaths.
However, the median and repetition of GDP (PPP) class reflected that there is GDP is greater
than 40000. In addition to this, 50% of the sample selected reflected that there are 84438 patients
admitted in ICU while 1109104 is the average number of hospitalization. Further, 6952719 and
2727668 is the mean of taking first and second dose respectively. Overall, it can be stated that
there is no actual trend identified over the entire data which helps to determine the actual
condition for the year of 2020.
CONCLUSION
By summing up above report it has been concluded that inferential test has been used in
order to determine the association between variables. Also, the data reflected that there is a
significant relationship between number of Covid cases and number of test done, along with this
there is lower and negative relationship between number of deaths and GDP (PPP) 2020.
However, by applying T test, it has been identified that there a GDP 2020 class difference in the
number of COVID cases registered as well as first COVID-19 doses administered. Hence, this
inferential statistical analysis assists to generate the best outcomes and meet the research
objectives as well.
Reflective log
The overall journey of quantitative data analysis is good and provide me an opportunity
to understand the terms in effective manner. I also did not find the current project challenging
because the material helps me to understand the key aspects like inferential tools. However, I
also find some difficulties while completing the project and this in turn affect the results as well.
Such that data analysis option was not available on my Laptop and I did not know how to turn on
this. So, with the help of teacher I am able to display the function over excel by using Add-ins

option which in turn reflected that I am poor in my ICT skills which need to be improved in
order to attain my future goals. Overall, my experience is good and also leant many things from
the quantitative data analysis.
order to attain my future goals. Overall, my experience is good and also leant many things from
the quantitative data analysis.
⊘ This is a preview!⊘
Do you want full access?
Subscribe today to unlock all pages.
Trusted by 1+ million students worldwide
1 out of 13
Related Documents


Your All-in-One AI-Powered Toolkit for Academic Success.
+13062052269
info@desklib.com
Available 24*7 on WhatsApp / Email
![[object Object]](/_next/static/media/star-bottom.7253800d.svg)
Unlock your academic potential
Copyright © 2020–2026 A2Z Services. All Rights Reserved. Developed and managed by ZUCOL.