BA30589E Data Analysis Project: Comparing COVID-19 Vaccination Data

Verified

Added on  2022/12/15

|10
|471
|30
Project
AI Summary
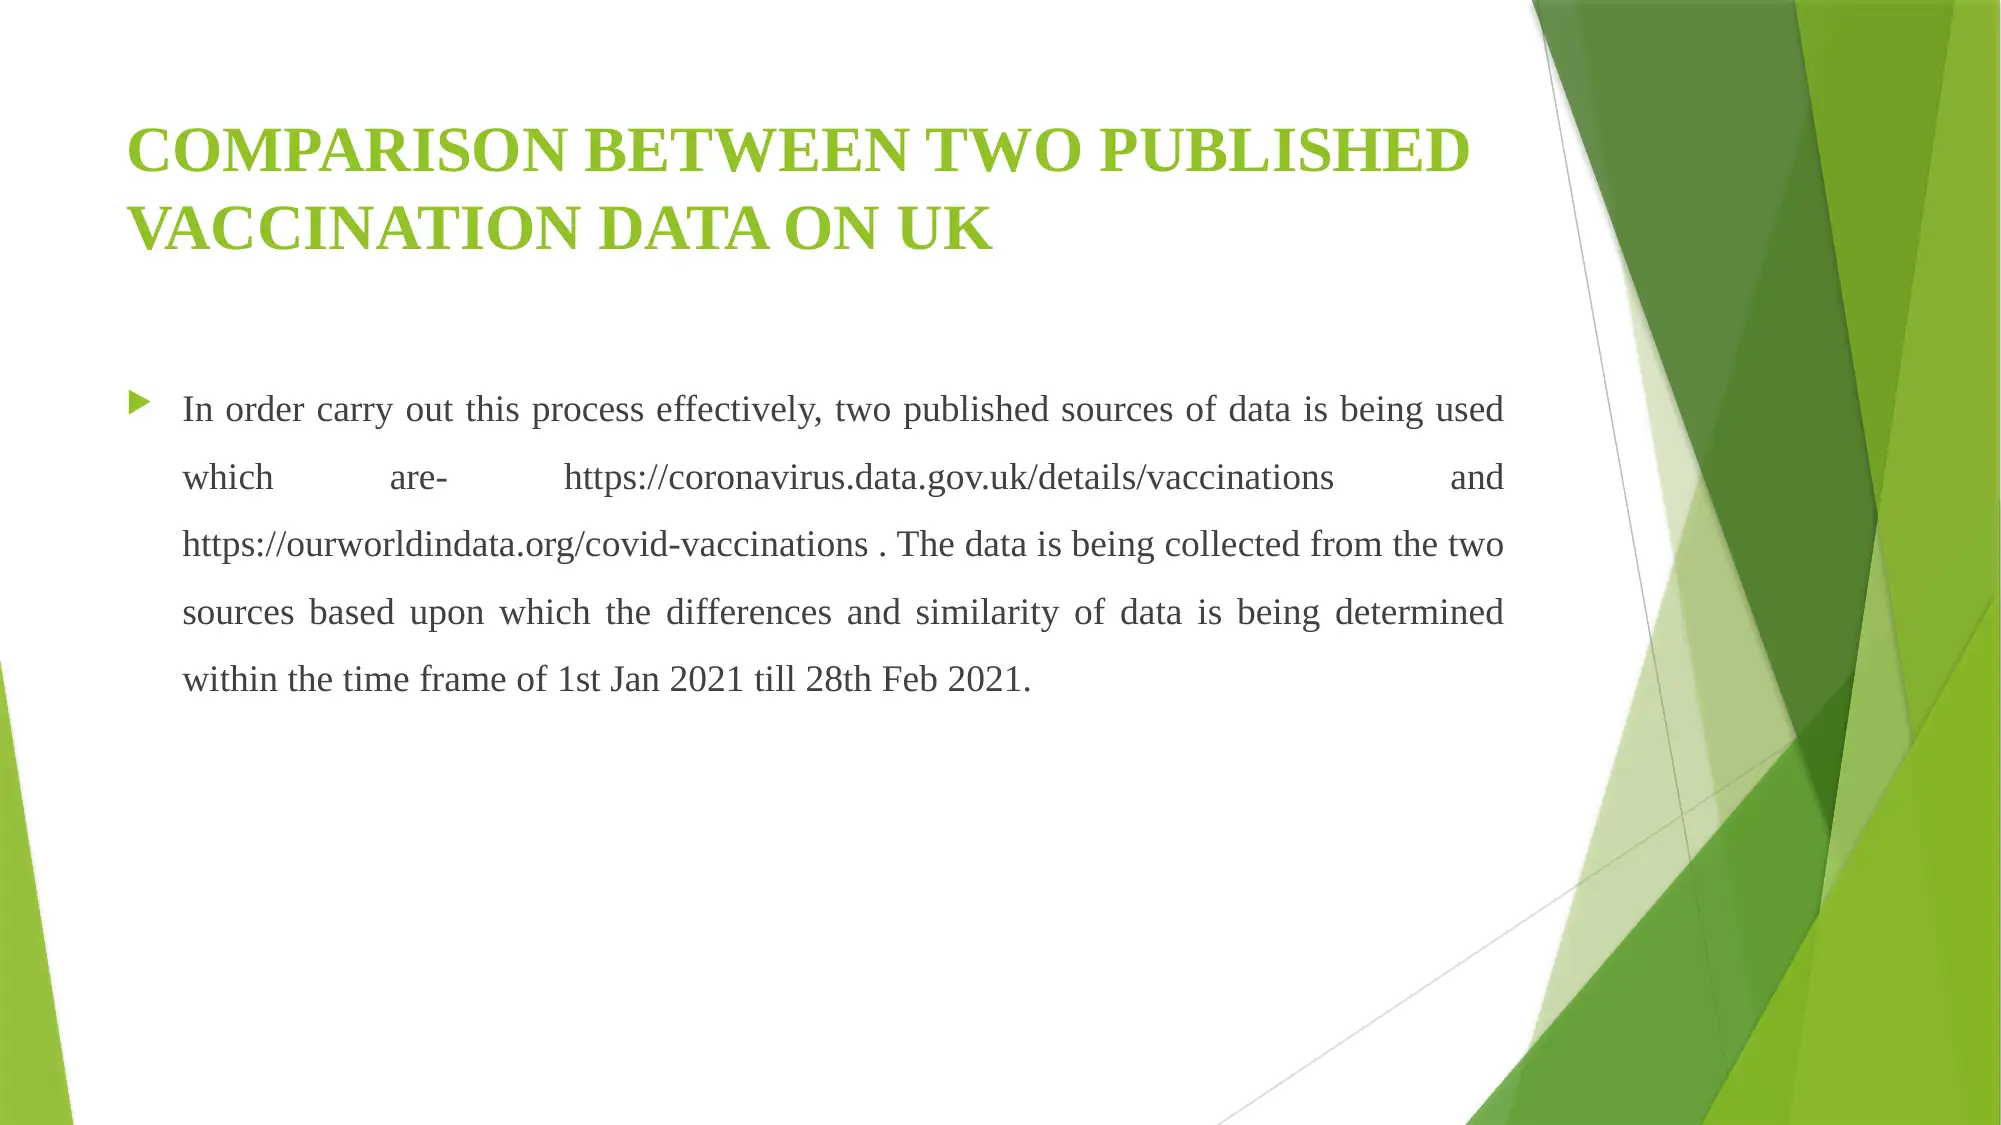
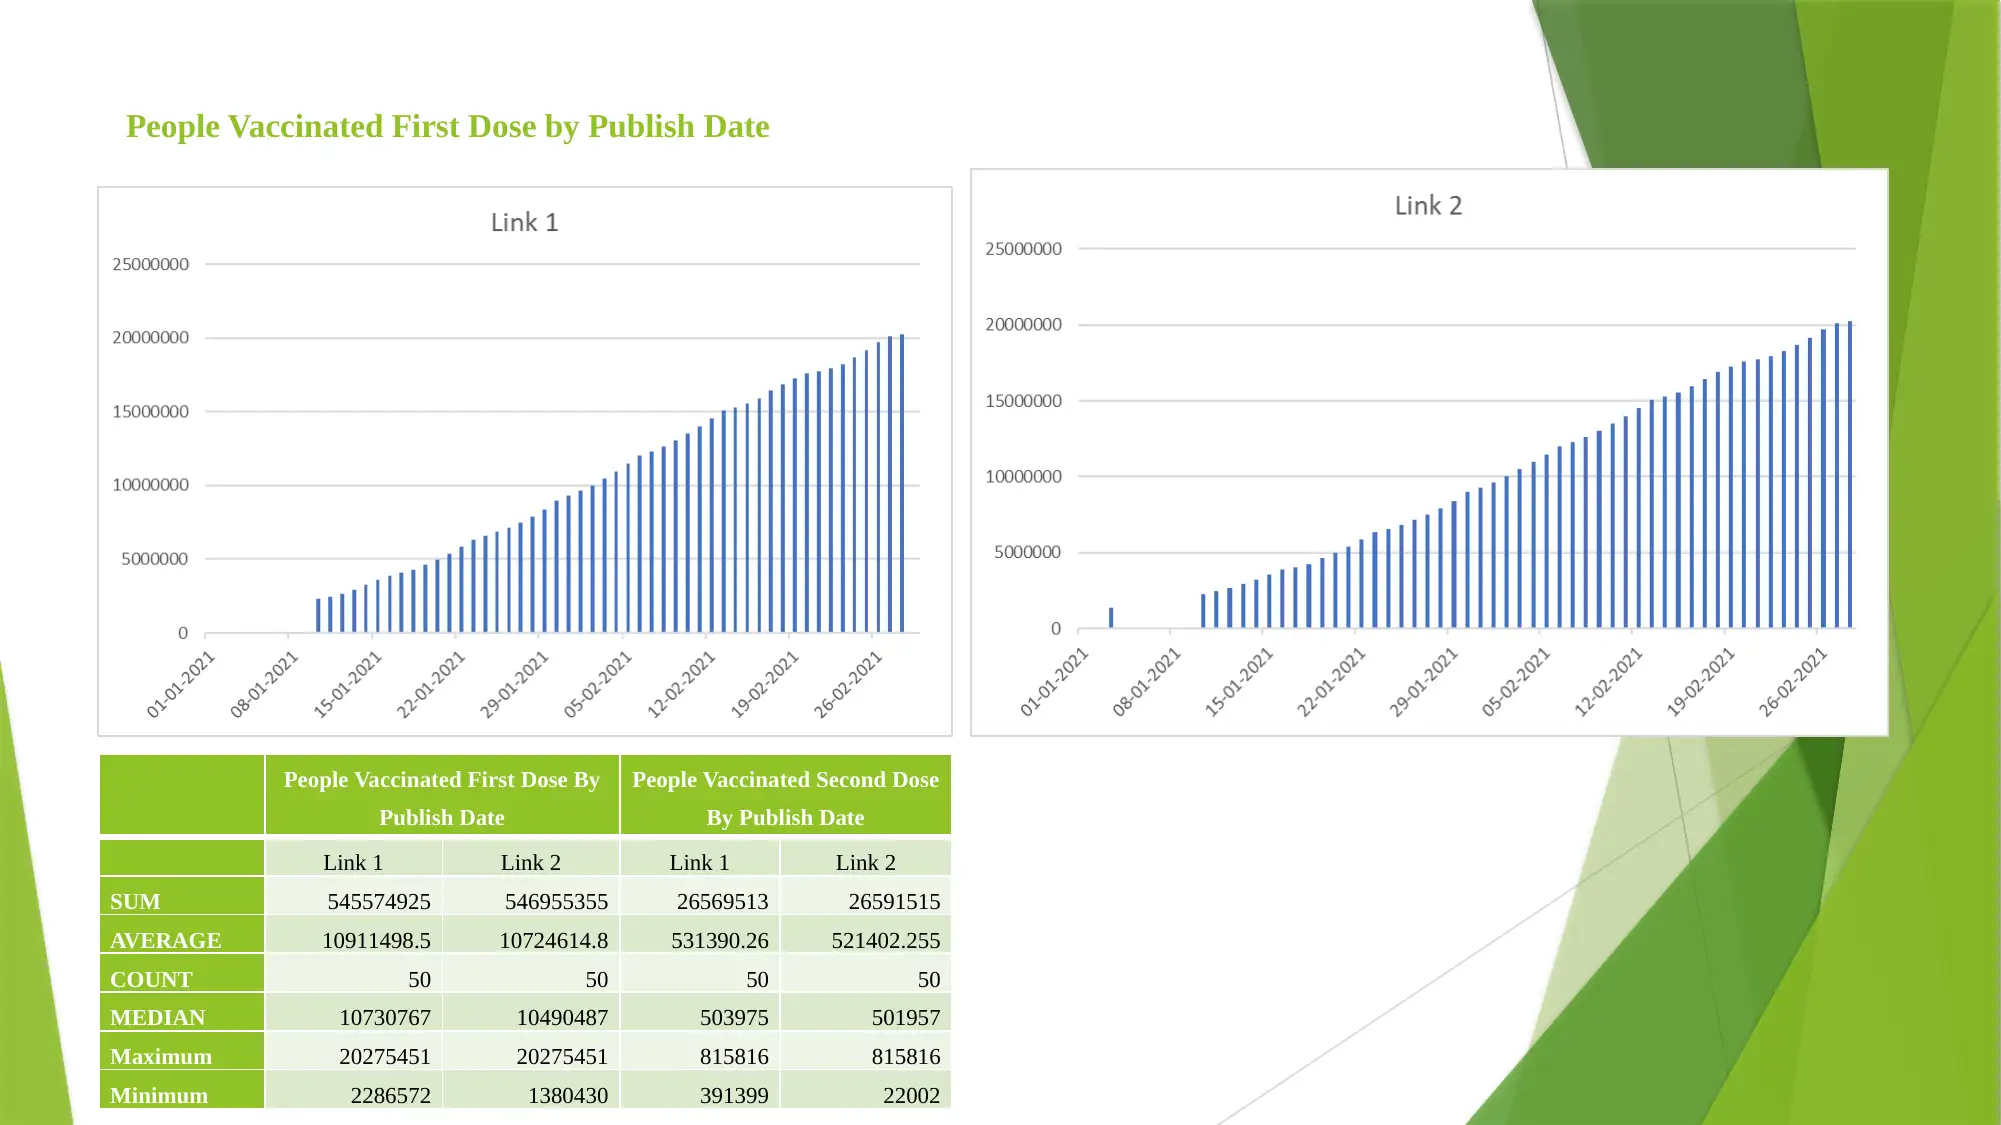
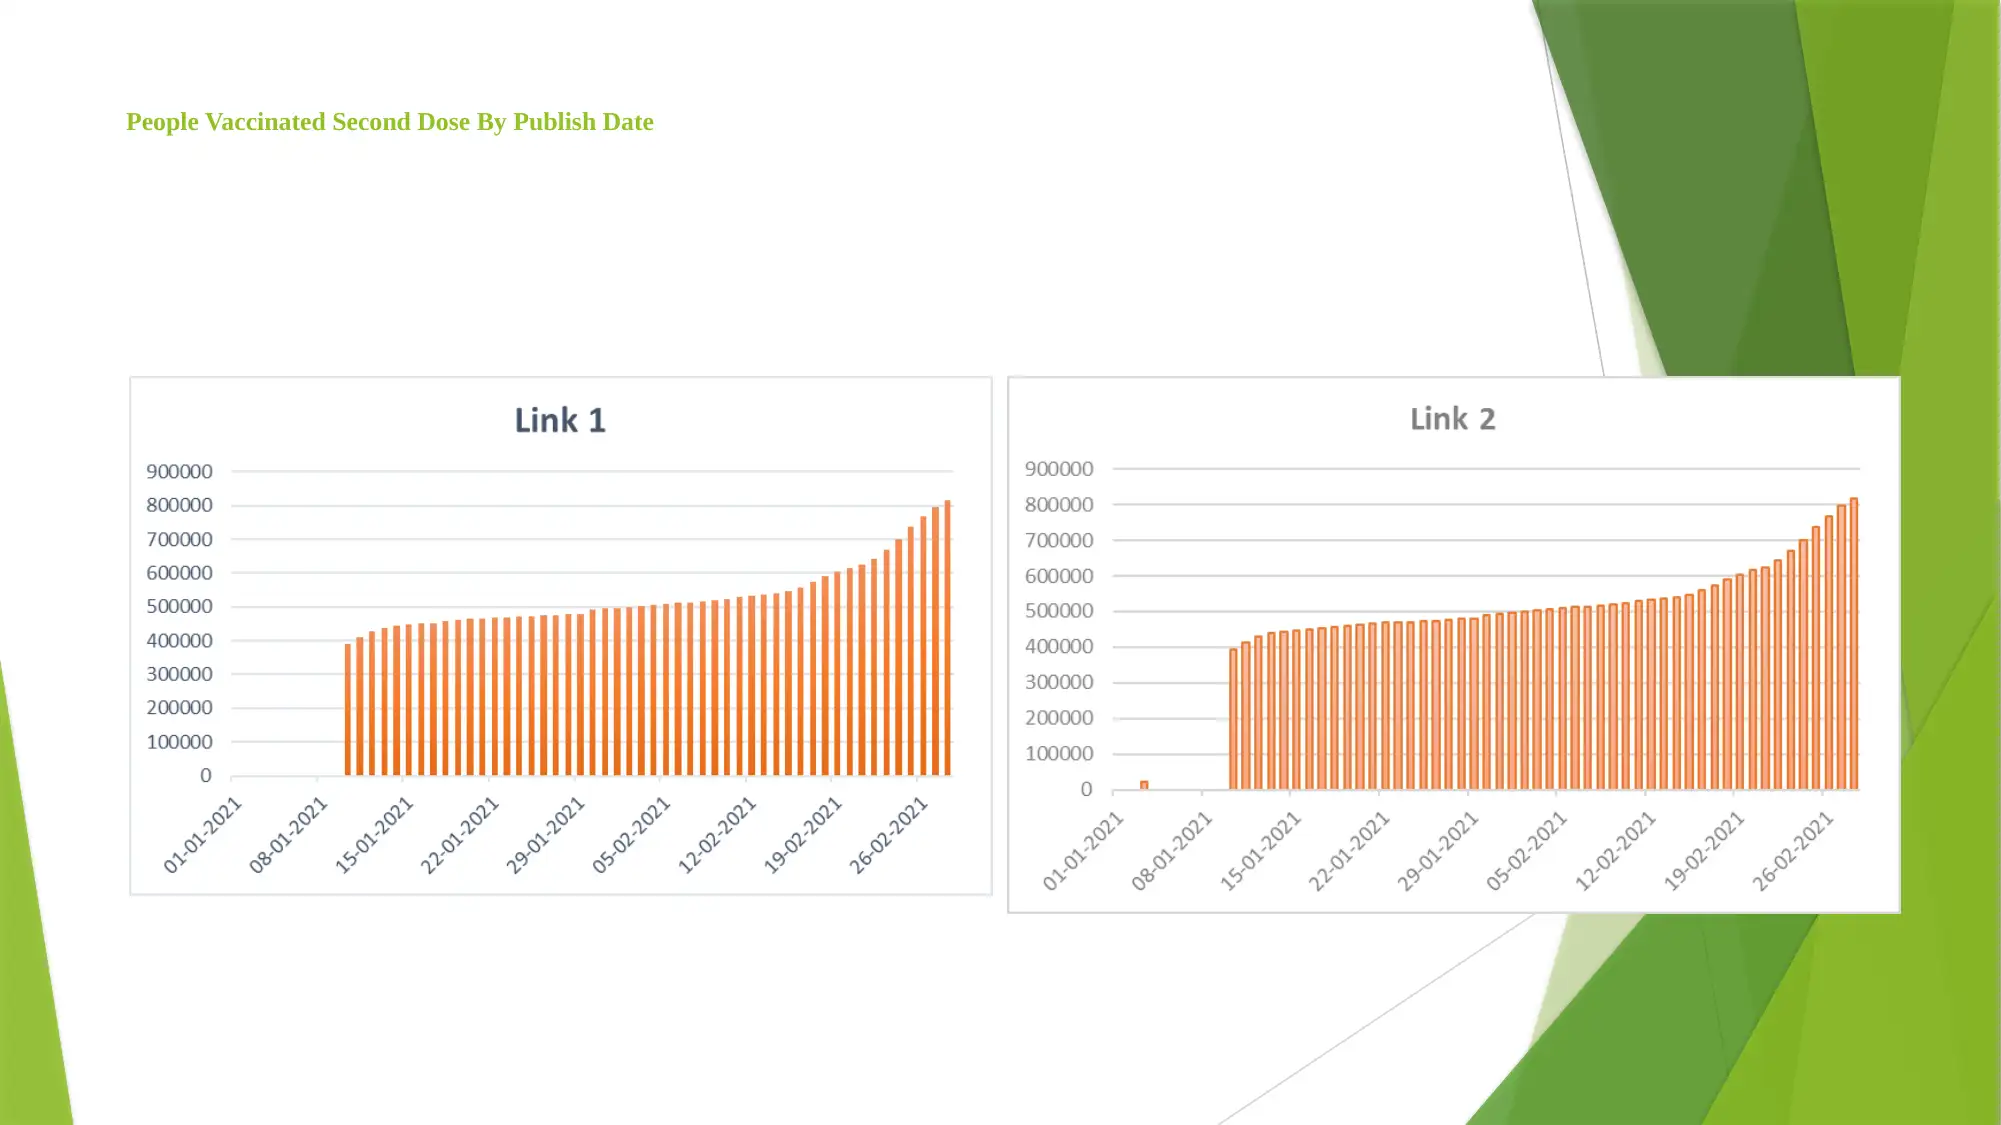
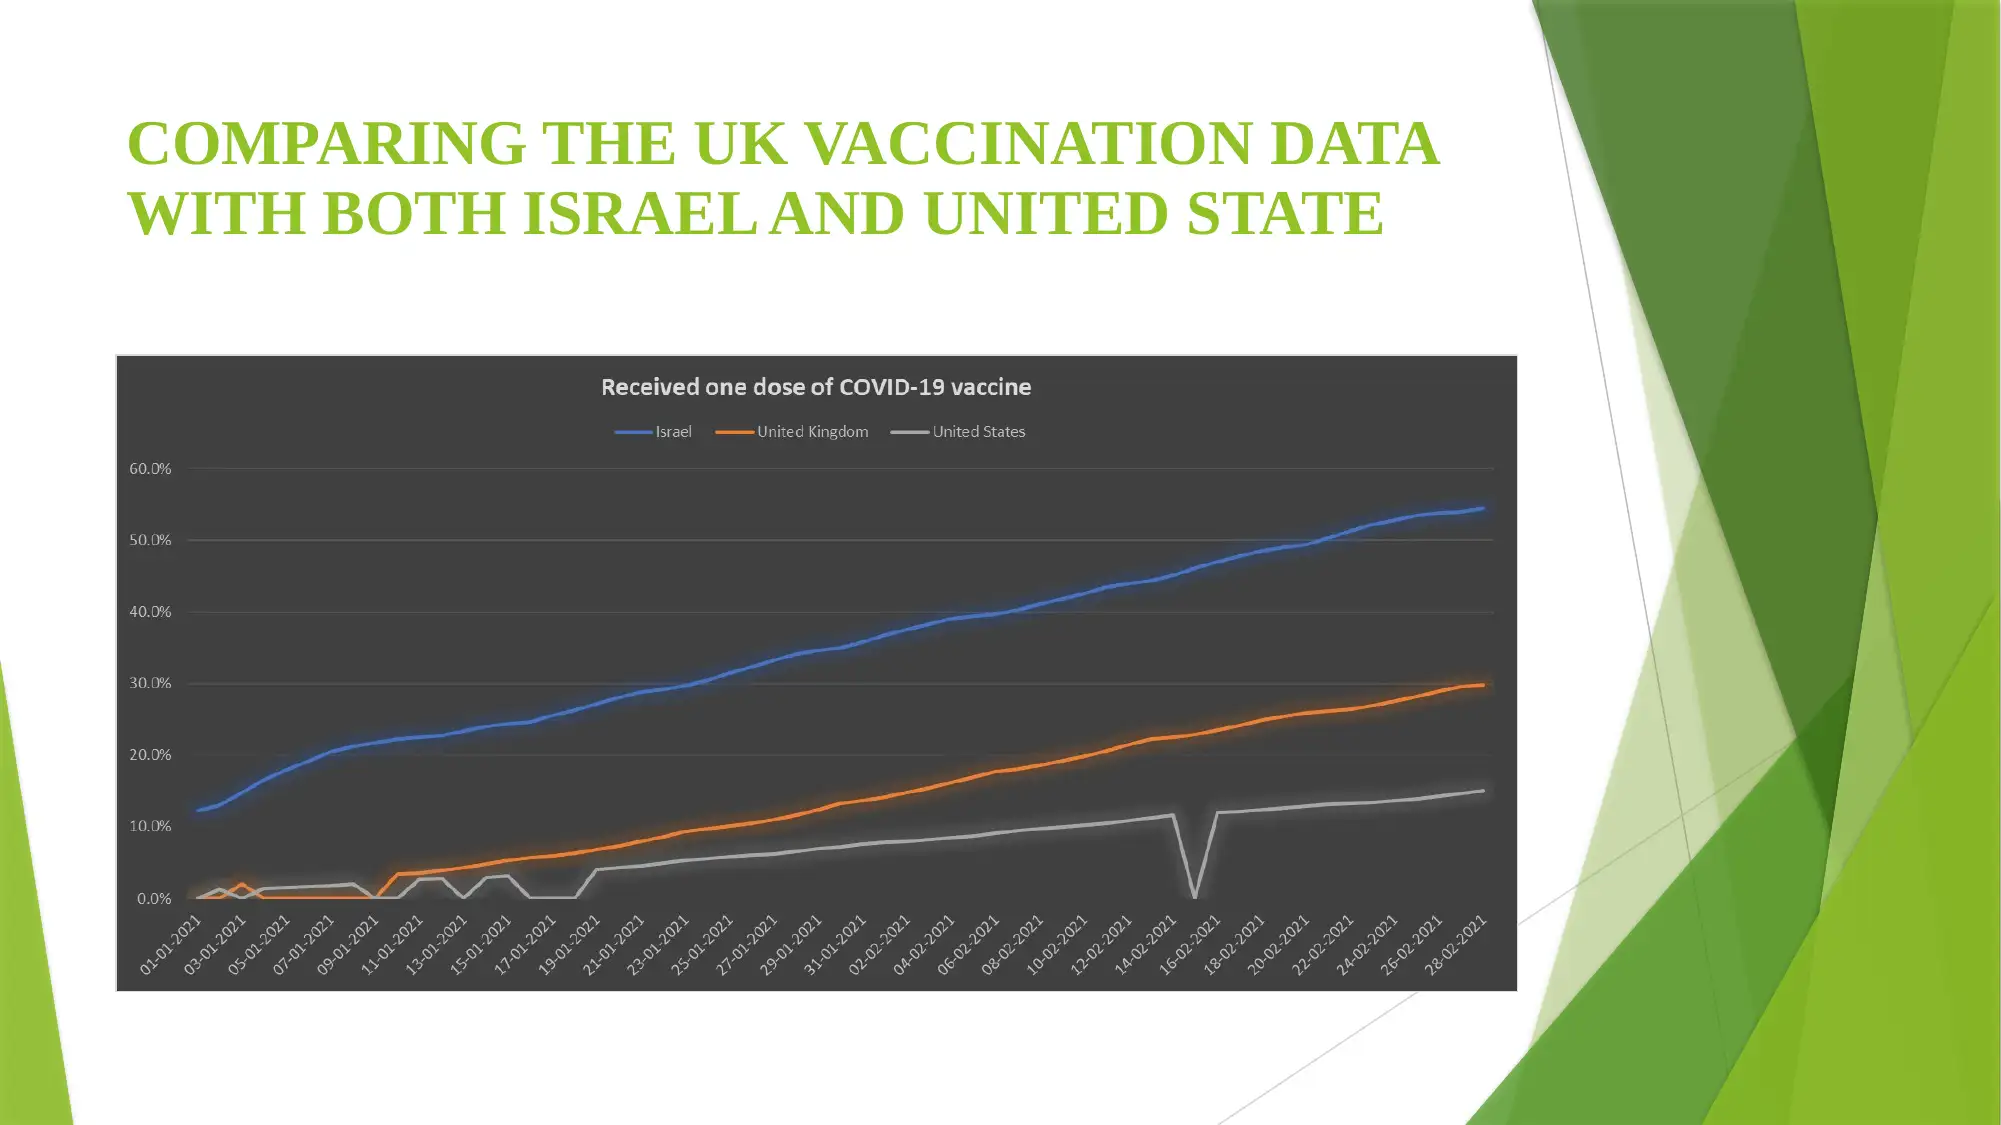
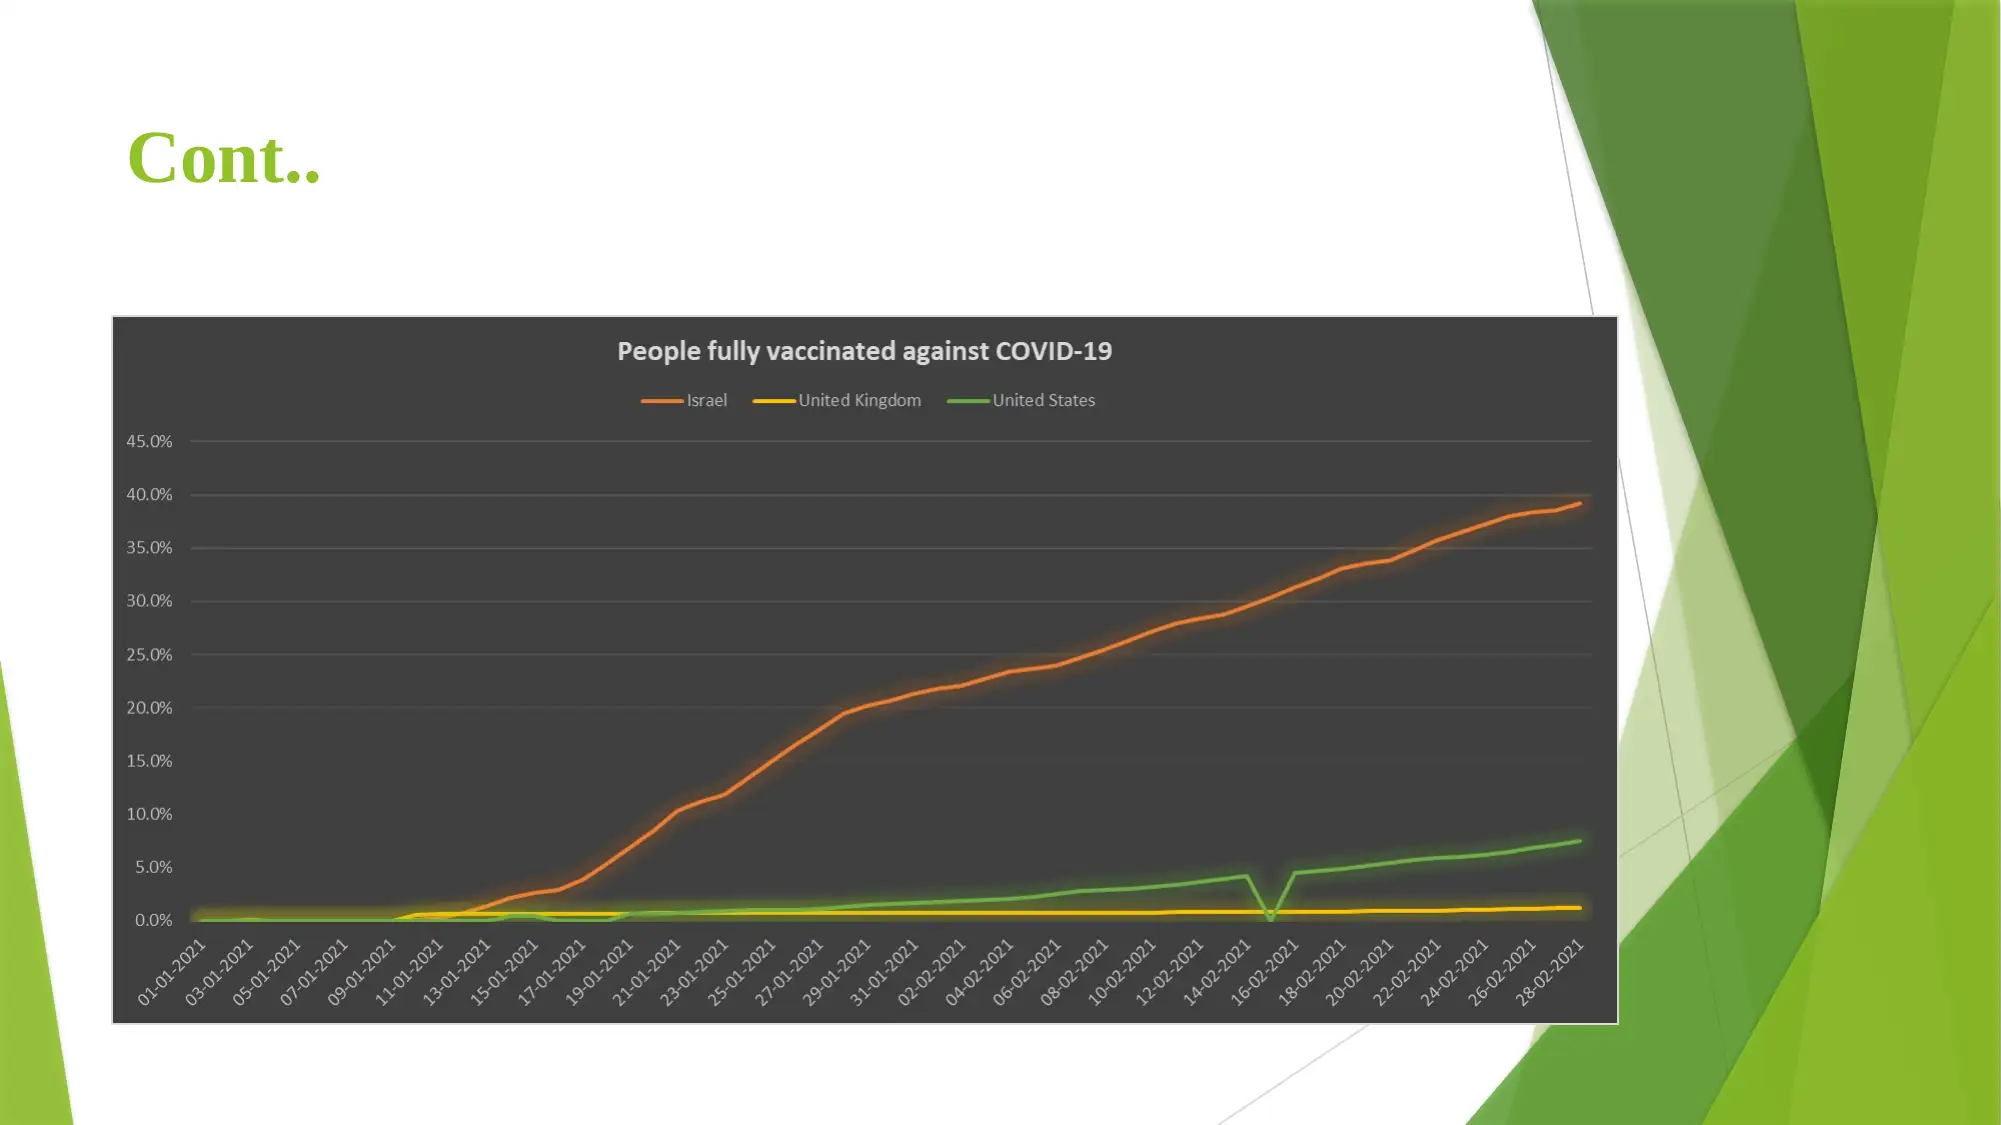
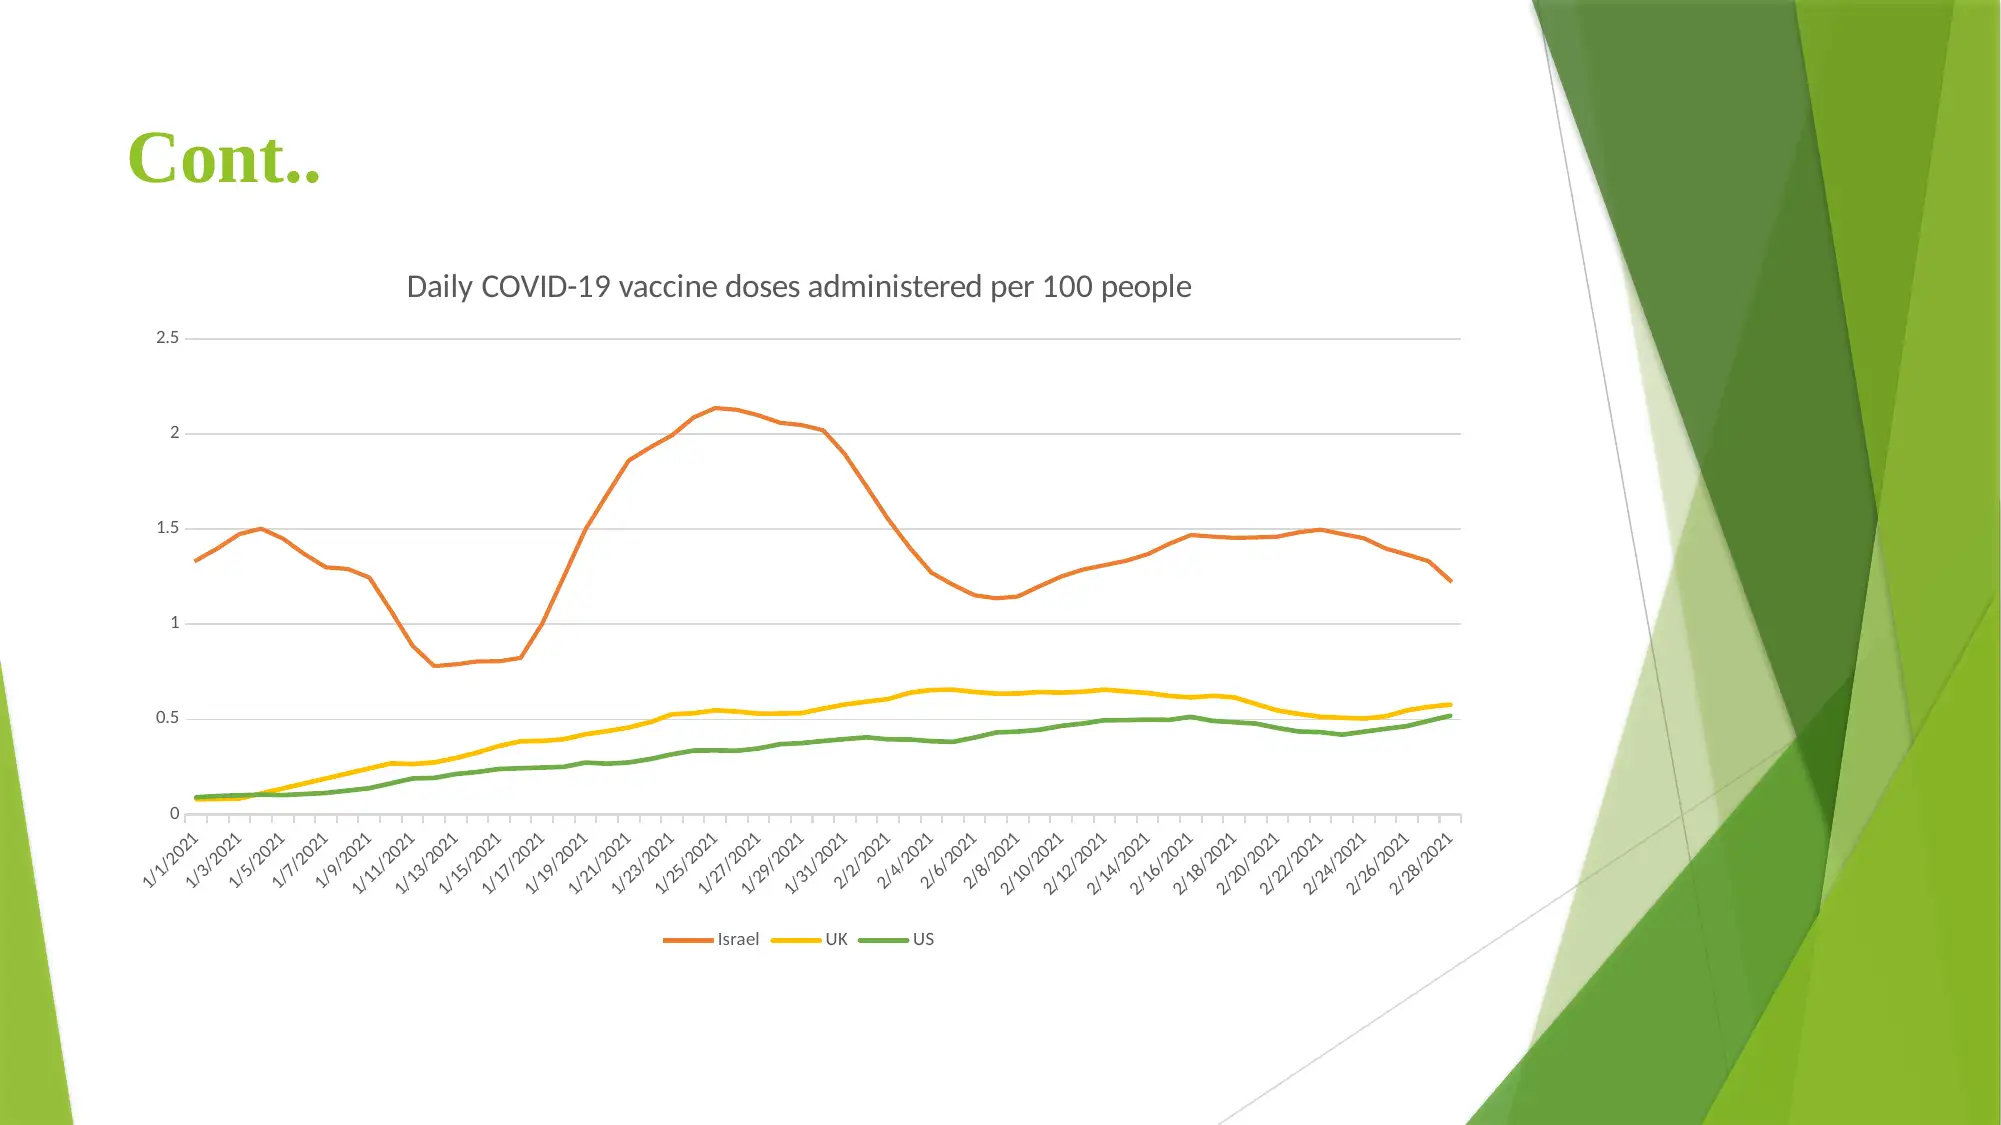
This project presents a data analysis of COVID-19 vaccination data, focusing on the UK and comparing it with Israel and the United States. The analysis utilizes data from two sources, https://coronavirus.data.gov.uk/details/vaccinations and https://ourworldindata.org/covid-vaccinations, from January 1st to February 28th, 2021. The assignment involves data manipulation in MS Excel to identify similarities and differences between the datasets, including calculations of averages, medians, and comparisons of daily doses administered. The findings are presented using MS PowerPoint, with visual representations to communicate the information effectively. The project concludes by emphasizing the importance of data analysis as a tool for extracting meaningful insights from large datasets, highlighting the need for analytical skills in the process.
Document Page
DATA ANALYSIS
tabler-icon-diamond-filled.svg

Paraphrase This Document

Need a fresh take? Get an instant paraphrase of this document with our AI Paraphraser
Document Page
INTRODUCTION
Data analysis basically refers to the process of inspecting and modelling of data with
the goal of determining useful and meaningful insight which will help in undertaking
decisions.
It involves the usage of multiple techniques and approaches for extracting relevant
information from large set of data.
In this presentation, statistical technical analysis of the information pertaining to the
Covid-19 vaccination is carried along with the comparison to the other countries like
Israel and US.
Document Page
COMPARISON BETWEEN TWO PUBLISHED
VACCINATION DATA ON UK
In order carry out this process effectively, two published sources of data is being used
which are- https://coronavirus.data.gov.uk/details/vaccinations and
https://ourworldindata.org/covid-vaccinations . The data is being collected from the two
sources based upon which the differences and similarity of data is being determined
within the time frame of 1st Jan 2021 till 28th Feb 2021.
Document Page
People Vaccinated First Dose by Publish Date
People Vaccinated First Dose By
Publish Date
People Vaccinated Second Dose
By Publish Date
Link 1 Link 2 Link 1 Link 2
SUM 545574925 546955355 26569513 26591515
AVERAGE 10911498.5 10724614.8 531390.26 521402.255
COUNT 50 50 50 50
MEDIAN 10730767 10490487 503975 501957
Maximum 20275451 20275451 815816 815816
Minimum 2286572 1380430 391399 22002
tabler-icon-diamond-filled.svg

Paraphrase This Document

Need a fresh take? Get an instant paraphrase of this document with our AI Paraphraser
Document Page
People Vaccinated Second Dose By Publish Date
Document Page
COMPARING THE UK VACCINATION DATA
WITH BOTH ISRAEL AND UNITED STATE
Document Page
Cont..
tabler-icon-diamond-filled.svg

Paraphrase This Document

Need a fresh take? Get an instant paraphrase of this document with our AI Paraphraser
Document Page
Cont..
1/1/2021
1/3/2021
1/5/2021
1/7/2021
1/9/2021
1/11/2021
1/13/2021
1/15/2021
1/17/2021
1/19/2021
1/21/2021
1/23/2021
1/25/2021
1/27/2021
1/29/2021
1/31/2021
2/2/2021
2/4/2021
2/6/2021
2/8/2021
2/10/2021
2/12/2021
2/14/2021
2/16/2021
2/18/2021
2/20/2021
2/22/2021
2/24/2021
2/26/2021
2/28/2021
0
0.5
1
1.5
2
2.5
Daily COVID-19 vaccine doses administered per 100 people
Israel UK US
Document Page
CONCLUSION
It can be inferred from the above that data analysis is a very important tool for
effectively analysing the large data set as it involves application of the statistical tools
and approaches for gathering important and relevant information for the raw data
available.
For effectively and properly carrying out data analysis requires relevant analytical skills
for timely completing the same.
In the given vaccination data set from the two links, it can be drawn that there is a
minor dissimilarity between the two data set otherwise both are similar.
Document Page
THANK YOU
chevron_up_icon
1 out of 10
circle_padding
hide_on_mobile
zoom_out_icon
[object Object]