Data Analysis Assignment: Statistical Analysis of COVID-19 Data

Verified

Added on  2022/12/27

|8
|964
|53
Homework Assignment
AI Summary
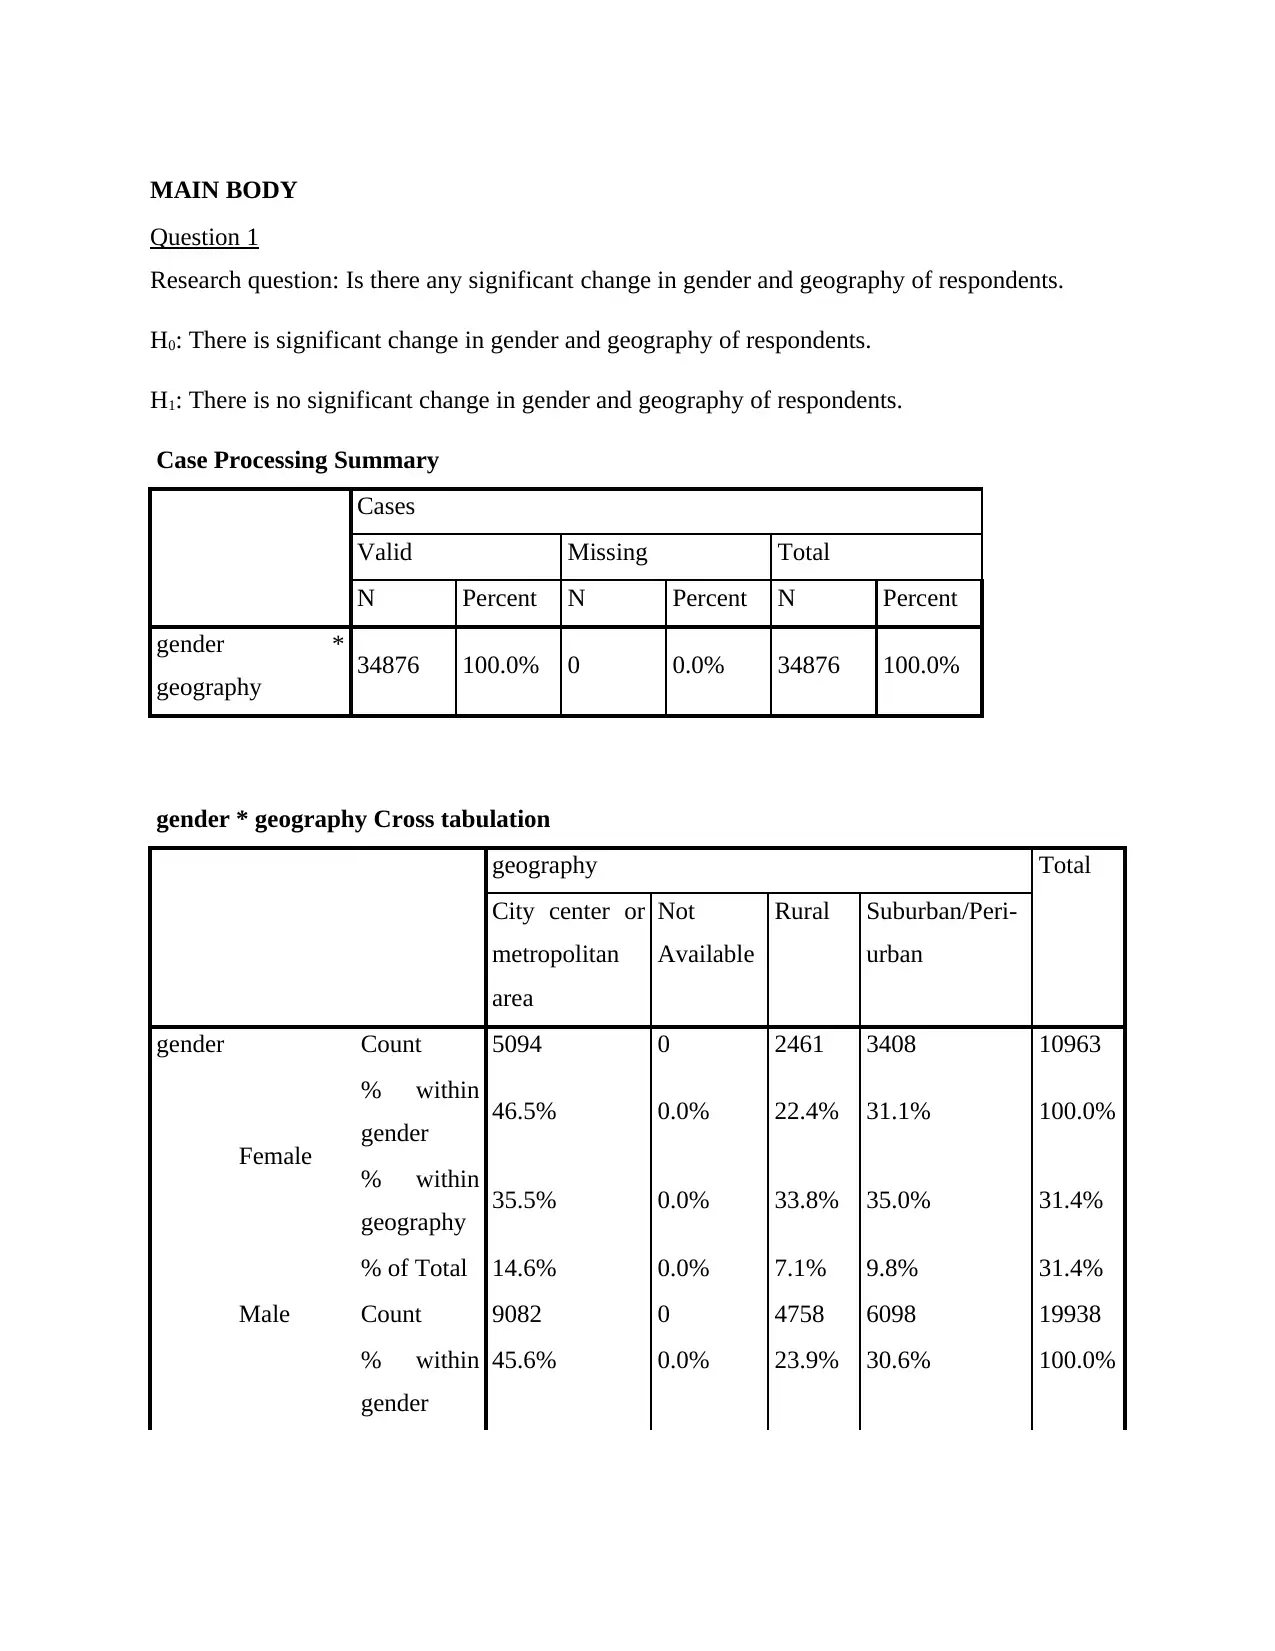
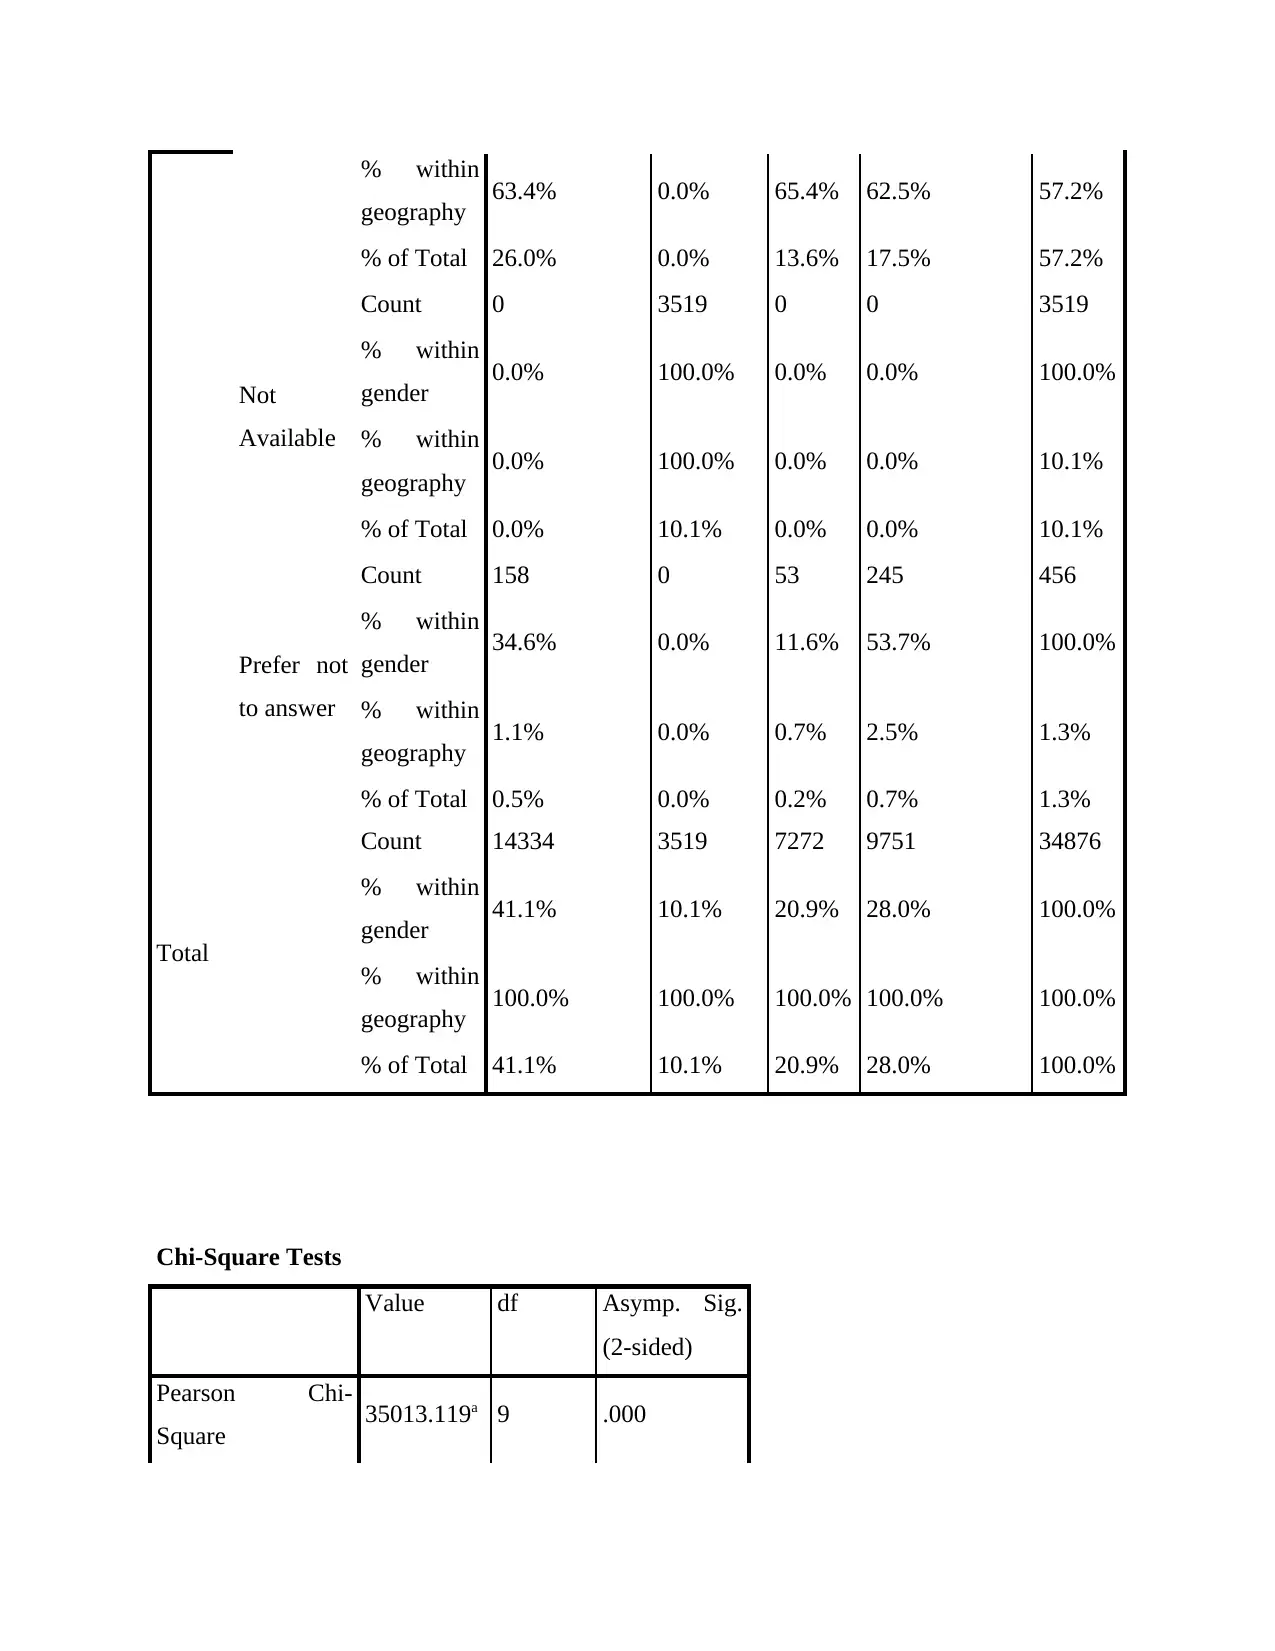
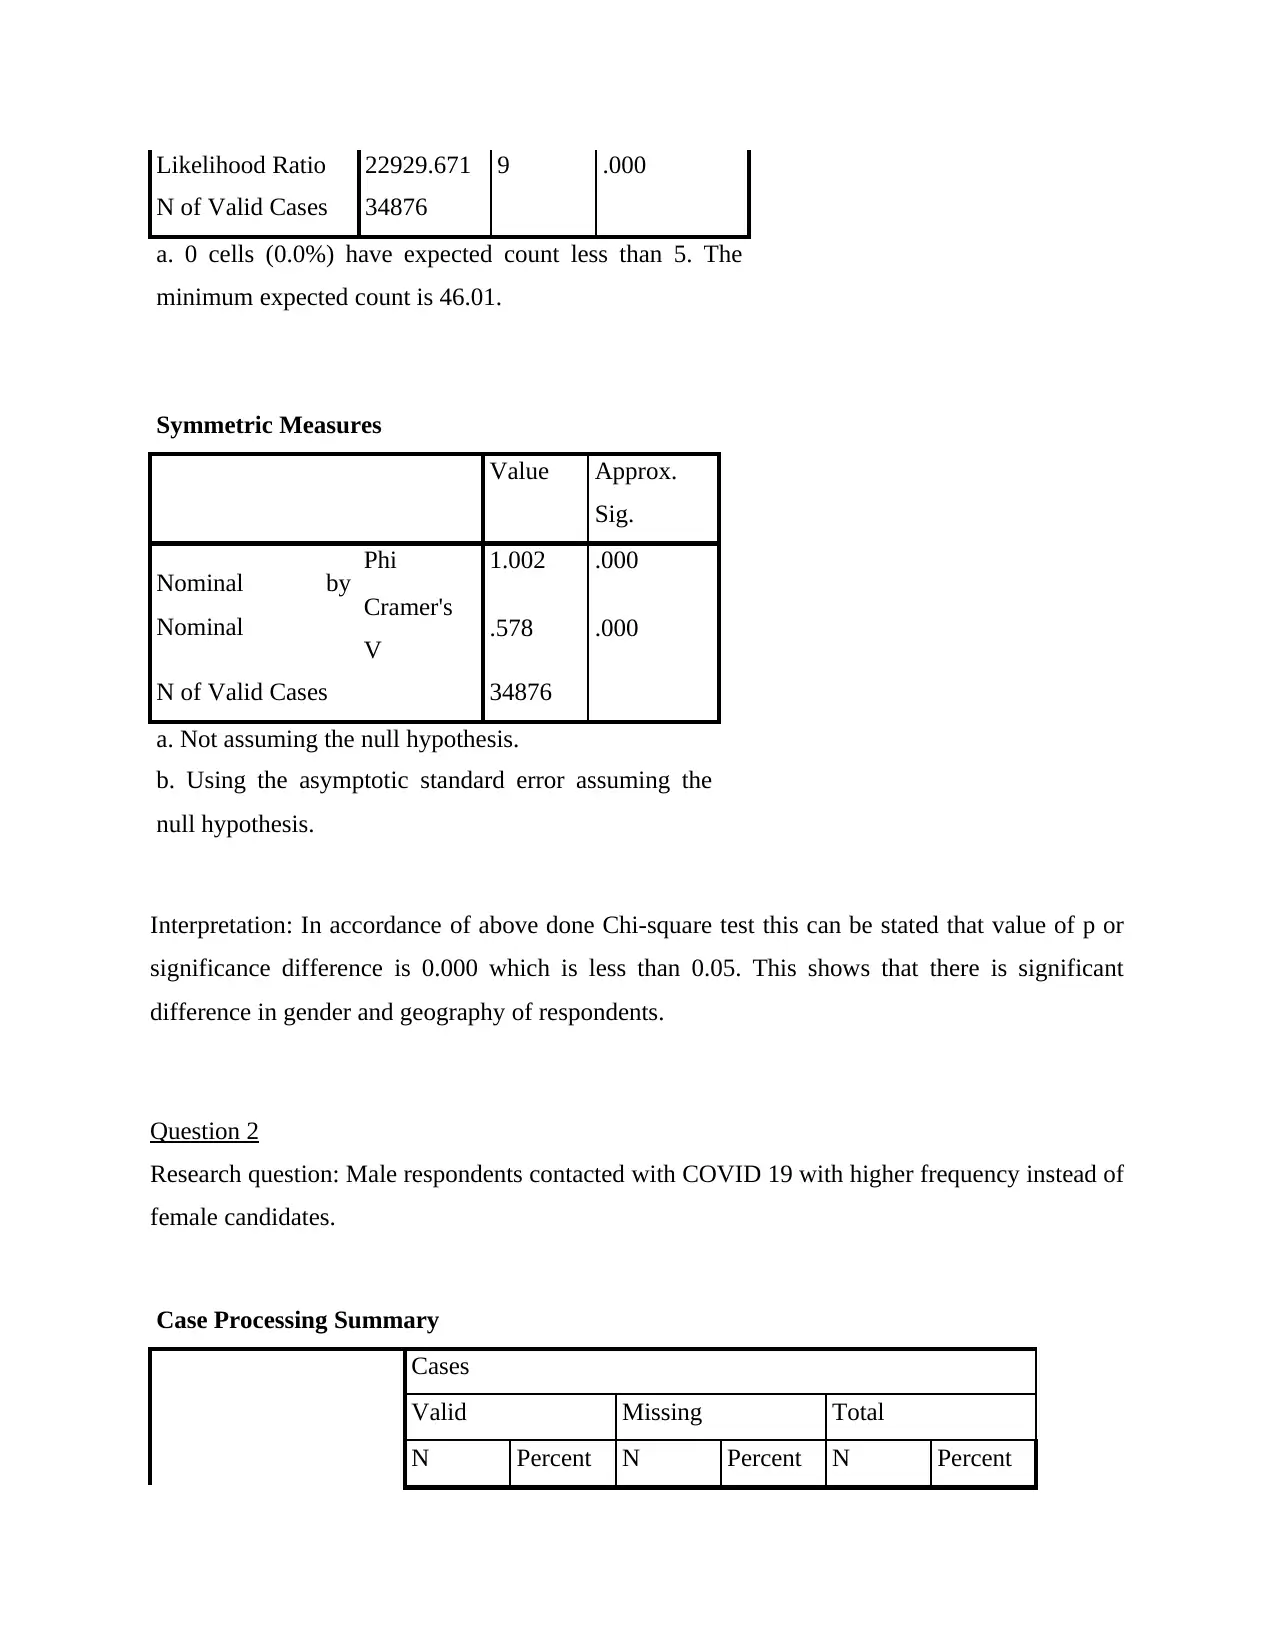
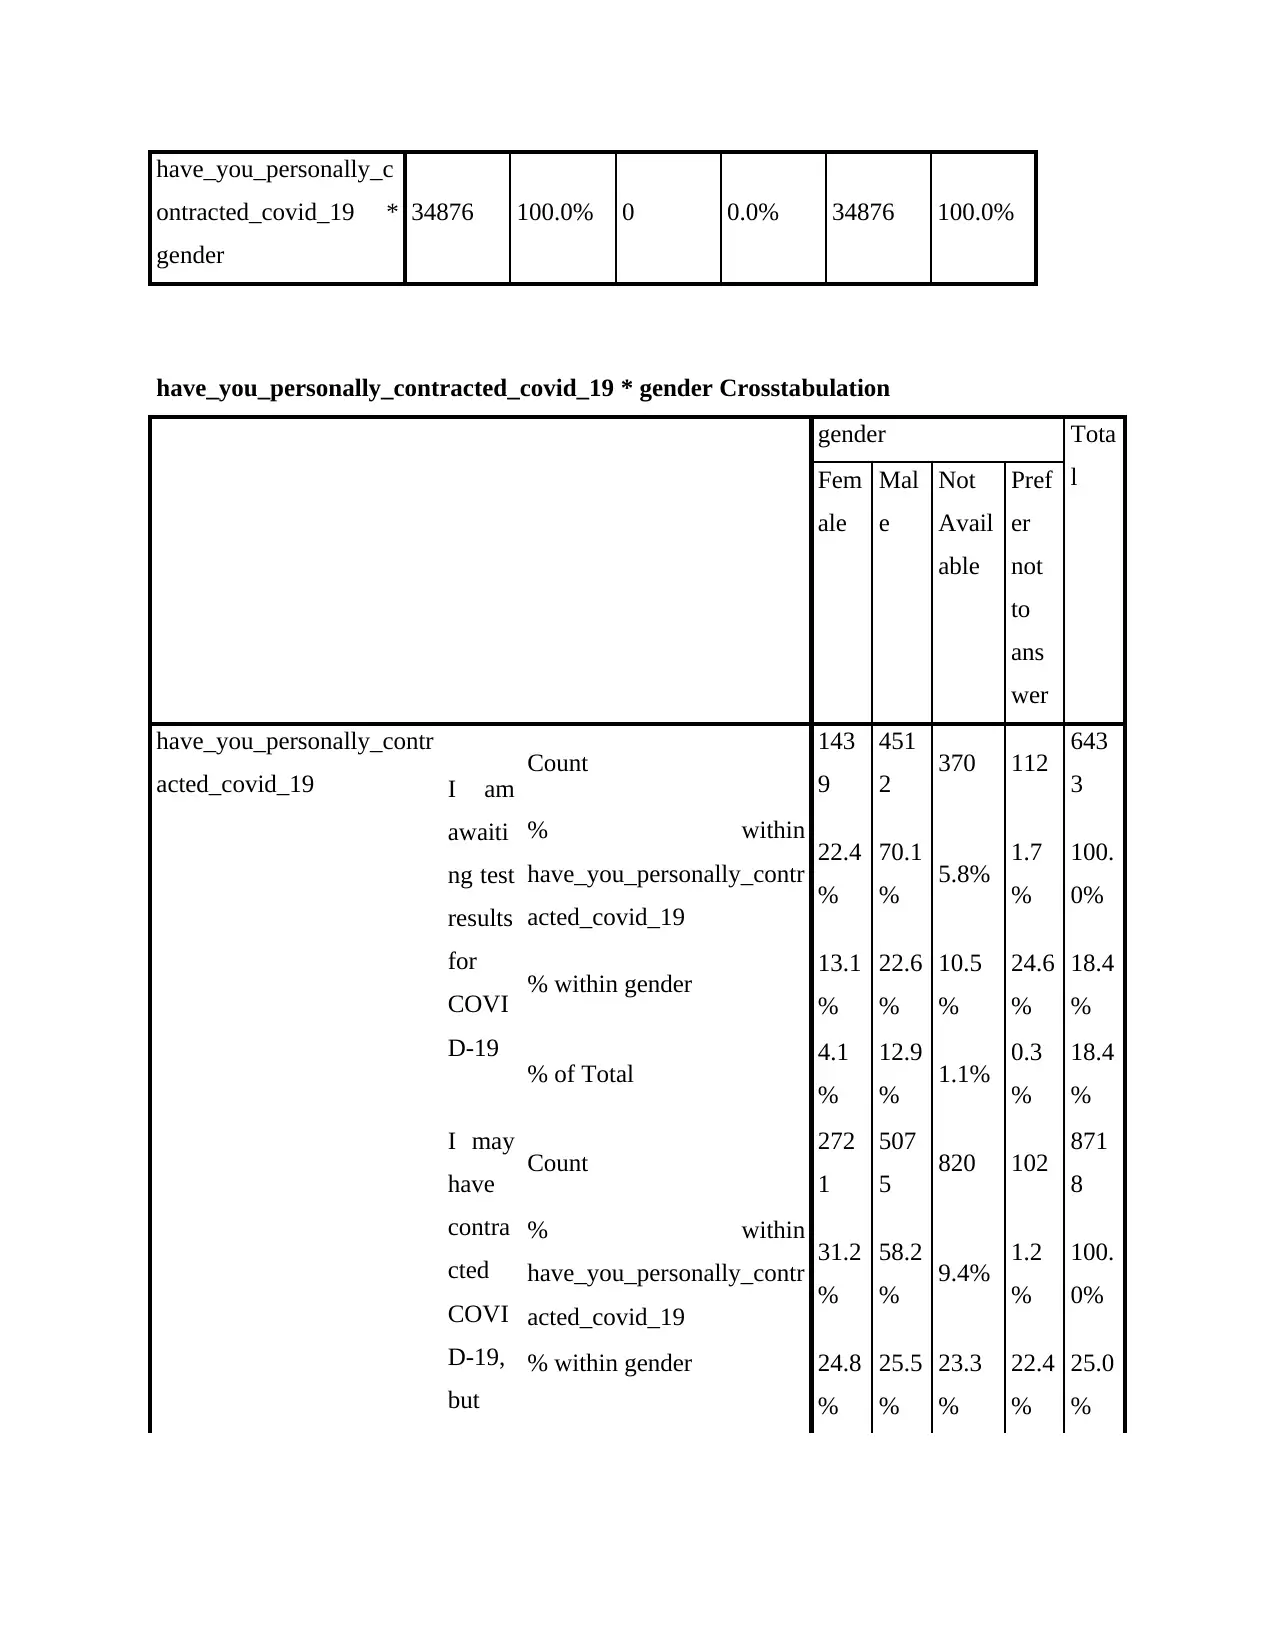
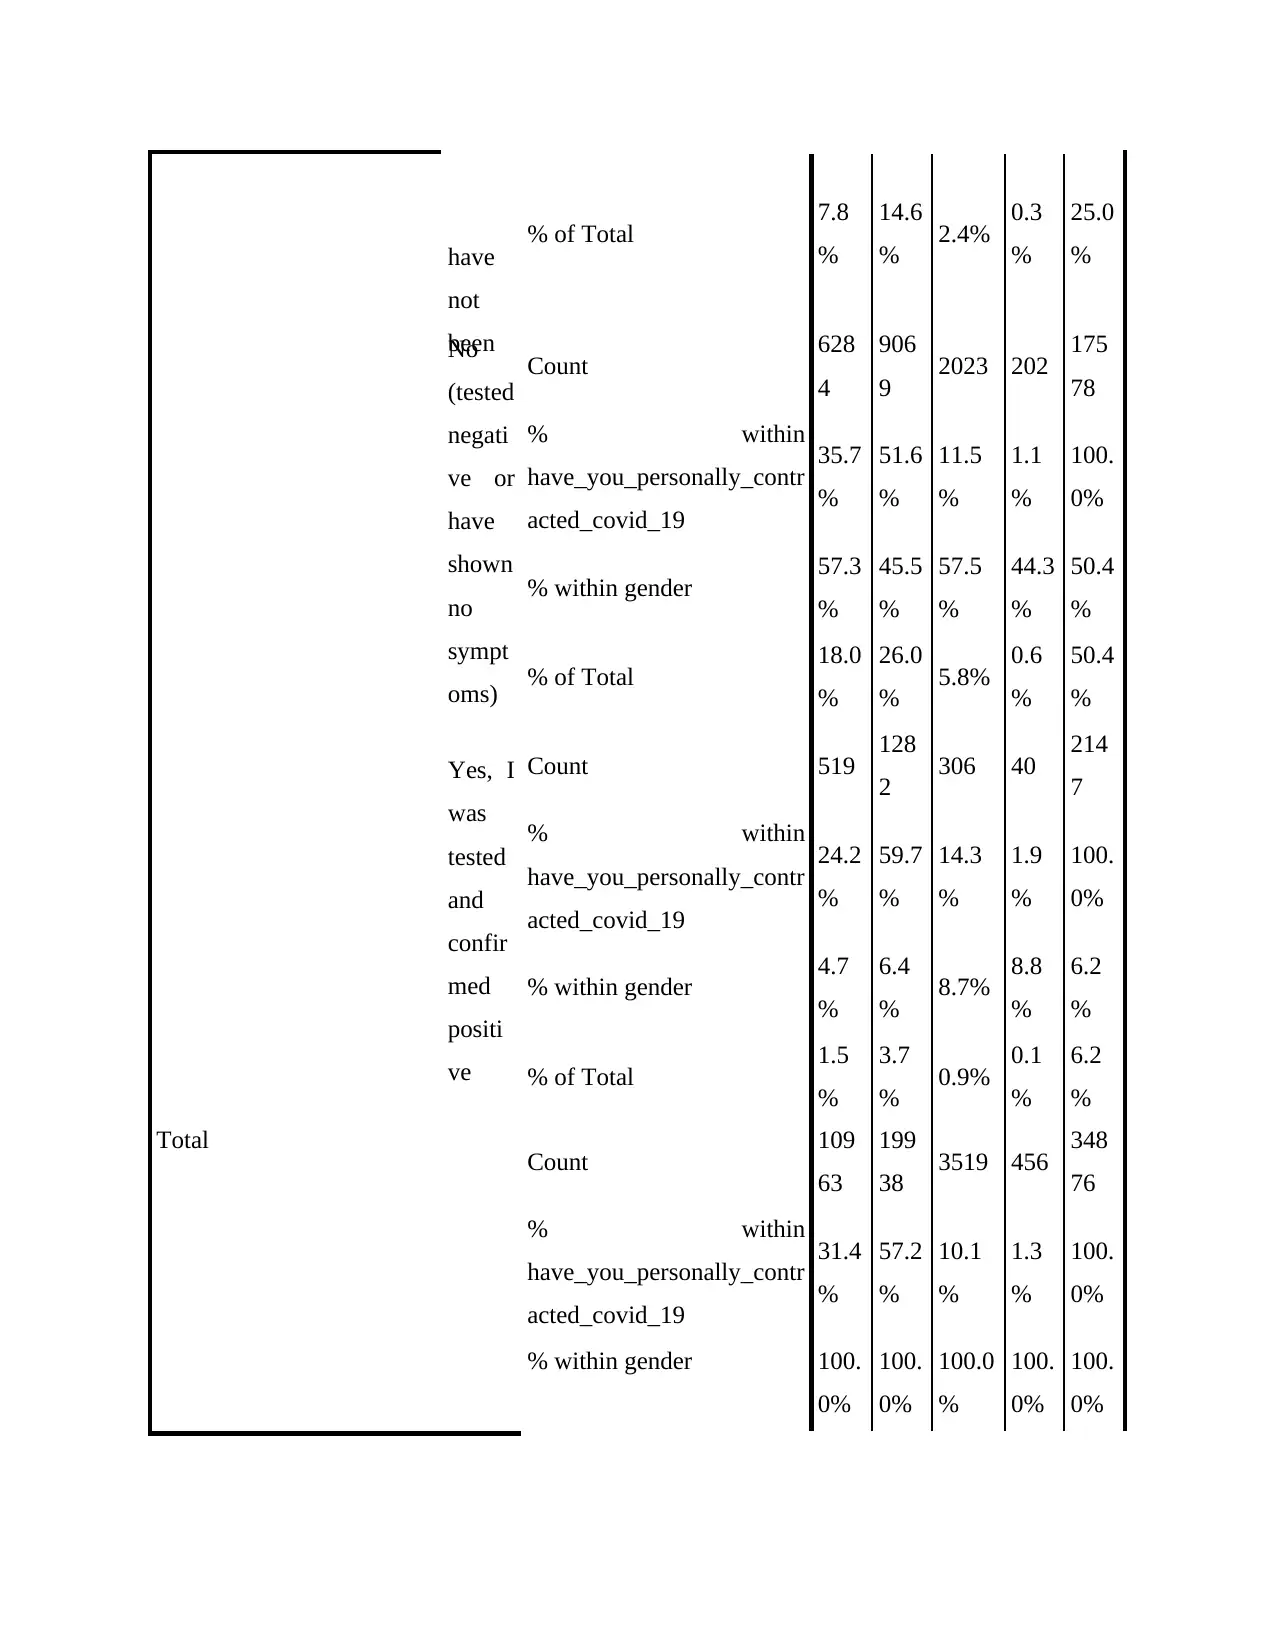
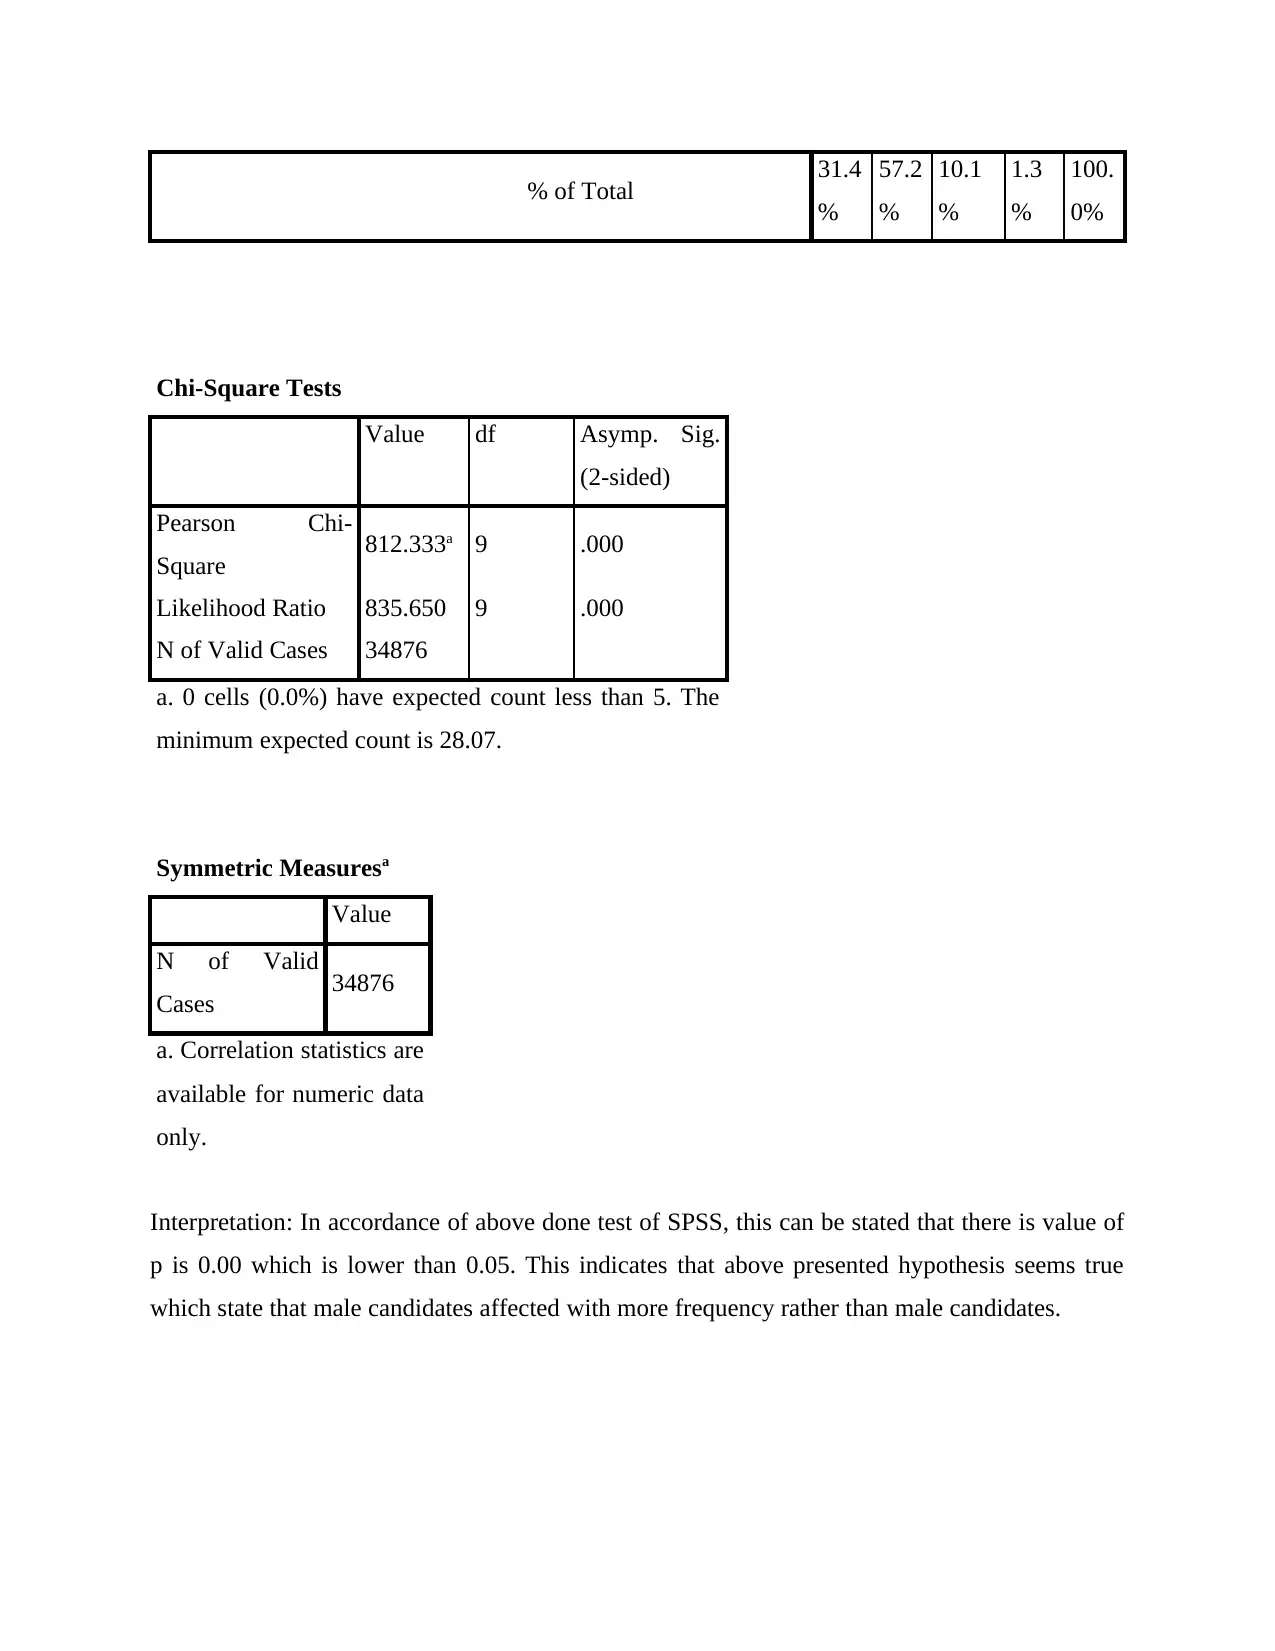
This data analysis assignment examines the relationship between gender, geography, and the impact of COVID-19. The analysis uses a Chi-square test to determine if there is a significant change in gender and geography of respondents. The results indicate a significant difference. Further analysis explores if male respondents contracted COVID-19 with a higher frequency than female respondents. The assignment uses SPSS to analyze cross-tabulations and determine the significance of the relationship between gender and COVID-19 contraction, revealing that the hypothesis is true. The assignment provides detailed case processing summaries, cross-tabulations, and interpretations of the statistical tests, including p-values, to support the conclusions.
Document Page
Data analysis
tabler-icon-diamond-filled.svg

Paraphrase This Document

Need a fresh take? Get an instant paraphrase of this document with our AI Paraphraser
Document Page
Contents
MAIN BODY.............................................................................................................................................3
Question 1...............................................................................................................................................3
Question 2...............................................................................................................................................5
Document Page
MAIN BODY
Question 1
Research question: Is there any significant change in gender and geography of respondents.
H0: There is significant change in gender and geography of respondents.
H1: There is no significant change in gender and geography of respondents.
Case Processing Summary
Cases
Valid Missing Total
N Percent N Percent N Percent
gender *
geography 34876 100.0% 0 0.0% 34876 100.0%
gender * geography Cross tabulation
geography Total
City center or
metropolitan
area
Not
Available
Rural Suburban/Peri-
urban
gender
Female
Count 5094 0 2461 3408 10963
% within
gender 46.5% 0.0% 22.4% 31.1% 100.0%
% within
geography 35.5% 0.0% 33.8% 35.0% 31.4%
% of Total 14.6% 0.0% 7.1% 9.8% 31.4%
Male Count 9082 0 4758 6098 19938
% within
gender
45.6% 0.0% 23.9% 30.6% 100.0%
Document Page
% within
geography 63.4% 0.0% 65.4% 62.5% 57.2%
% of Total 26.0% 0.0% 13.6% 17.5% 57.2%
Not
Available
Count 0 3519 0 0 3519
% within
gender 0.0% 100.0% 0.0% 0.0% 100.0%
% within
geography 0.0% 100.0% 0.0% 0.0% 10.1%
% of Total 0.0% 10.1% 0.0% 0.0% 10.1%
Prefer not
to answer
Count 158 0 53 245 456
% within
gender 34.6% 0.0% 11.6% 53.7% 100.0%
% within
geography 1.1% 0.0% 0.7% 2.5% 1.3%
% of Total 0.5% 0.0% 0.2% 0.7% 1.3%
Total
Count 14334 3519 7272 9751 34876
% within
gender 41.1% 10.1% 20.9% 28.0% 100.0%
% within
geography 100.0% 100.0% 100.0% 100.0% 100.0%
% of Total 41.1% 10.1% 20.9% 28.0% 100.0%
Chi-Square Tests
Value df Asymp. Sig.
(2-sided)
Pearson Chi-
Square 35013.119a 9 .000
tabler-icon-diamond-filled.svg

Paraphrase This Document

Need a fresh take? Get an instant paraphrase of this document with our AI Paraphraser
Document Page
Likelihood Ratio 22929.671 9 .000
N of Valid Cases 34876
a. 0 cells (0.0%) have expected count less than 5. The
minimum expected count is 46.01.
Symmetric Measures
Value Approx.
Sig.
Nominal by
Nominal
Phi 1.002 .000
Cramer's
V .578 .000
N of Valid Cases 34876
a. Not assuming the null hypothesis.
b. Using the asymptotic standard error assuming the
null hypothesis.
Interpretation: In accordance of above done Chi-square test this can be stated that value of p or
significance difference is 0.000 which is less than 0.05. This shows that there is significant
difference in gender and geography of respondents.
Question 2
Research question: Male respondents contacted with COVID 19 with higher frequency instead of
female candidates.
Case Processing Summary
Cases
Valid Missing Total
N Percent N Percent N Percent
Document Page
have_you_personally_c
ontracted_covid_19 *
gender
34876 100.0% 0 0.0% 34876 100.0%
have_you_personally_contracted_covid_19 * gender Crosstabulation
gender Tota
lFem
ale
Mal
e
Not
Avail
able
Pref
er
not
to
ans
wer
have_you_personally_contr
acted_covid_19 I am
awaiti
ng test
results
for
COVI
D-19
Count 143
9
451
2 370 112 643
3
% within
have_you_personally_contr
acted_covid_19
22.4
%
70.1
% 5.8% 1.7
%
100.
0%
% within gender 13.1
%
22.6
%
10.5
%
24.6
%
18.4
%
% of Total 4.1
%
12.9
% 1.1% 0.3
%
18.4
%
I may
have
contra
cted
COVI
D-19,
but
Count 272
1
507
5 820 102 871
8
% within
have_you_personally_contr
acted_covid_19
31.2
%
58.2
% 9.4% 1.2
%
100.
0%
% within gender 24.8
%
25.5
%
23.3
%
22.4
%
25.0
%
Document Page
have
not
been
% of Total 7.8
%
14.6
% 2.4% 0.3
%
25.0
%
No
(tested
negati
ve or
have
shown
no
sympt
oms)
Count 628
4
906
9 2023 202 175
78
% within
have_you_personally_contr
acted_covid_19
35.7
%
51.6
%
11.5
%
1.1
%
100.
0%
% within gender 57.3
%
45.5
%
57.5
%
44.3
%
50.4
%
% of Total 18.0
%
26.0
% 5.8% 0.6
%
50.4
%
Yes, I
was
tested
and
confir
med
positi
ve
Count 519 128
2 306 40 214
7
% within
have_you_personally_contr
acted_covid_19
24.2
%
59.7
%
14.3
%
1.9
%
100.
0%
% within gender 4.7
%
6.4
% 8.7% 8.8
%
6.2
%
% of Total 1.5
%
3.7
% 0.9% 0.1
%
6.2
%
Total Count 109
63
199
38 3519 456 348
76
% within
have_you_personally_contr
acted_covid_19
31.4
%
57.2
%
10.1
%
1.3
%
100.
0%
% within gender 100.
0%
100.
0%
100.0
%
100.
0%
100.
0%
tabler-icon-diamond-filled.svg

Paraphrase This Document

Need a fresh take? Get an instant paraphrase of this document with our AI Paraphraser
Document Page
% of Total 31.4
%
57.2
%
10.1
%
1.3
%
100.
0%
Chi-Square Tests
Value df Asymp. Sig.
(2-sided)
Pearson Chi-
Square 812.333a 9 .000
Likelihood Ratio 835.650 9 .000
N of Valid Cases 34876
a. 0 cells (0.0%) have expected count less than 5. The
minimum expected count is 28.07.
Symmetric Measuresa
Value
N of Valid
Cases 34876
a. Correlation statistics are
available for numeric data
only.
Interpretation: In accordance of above done test of SPSS, this can be stated that there is value of
p is 0.00 which is lower than 0.05. This indicates that above presented hypothesis seems true
which state that male candidates affected with more frequency rather than male candidates.
chevron_up_icon
1 out of 8
circle_padding
hide_on_mobile
zoom_out_icon
[object Object]