Analyzing COVID-19 Vaccination Data: UK, US, and Israel Comparison

Verified

Added on  2022/12/14

|12
|1132
|318
Report
AI Summary
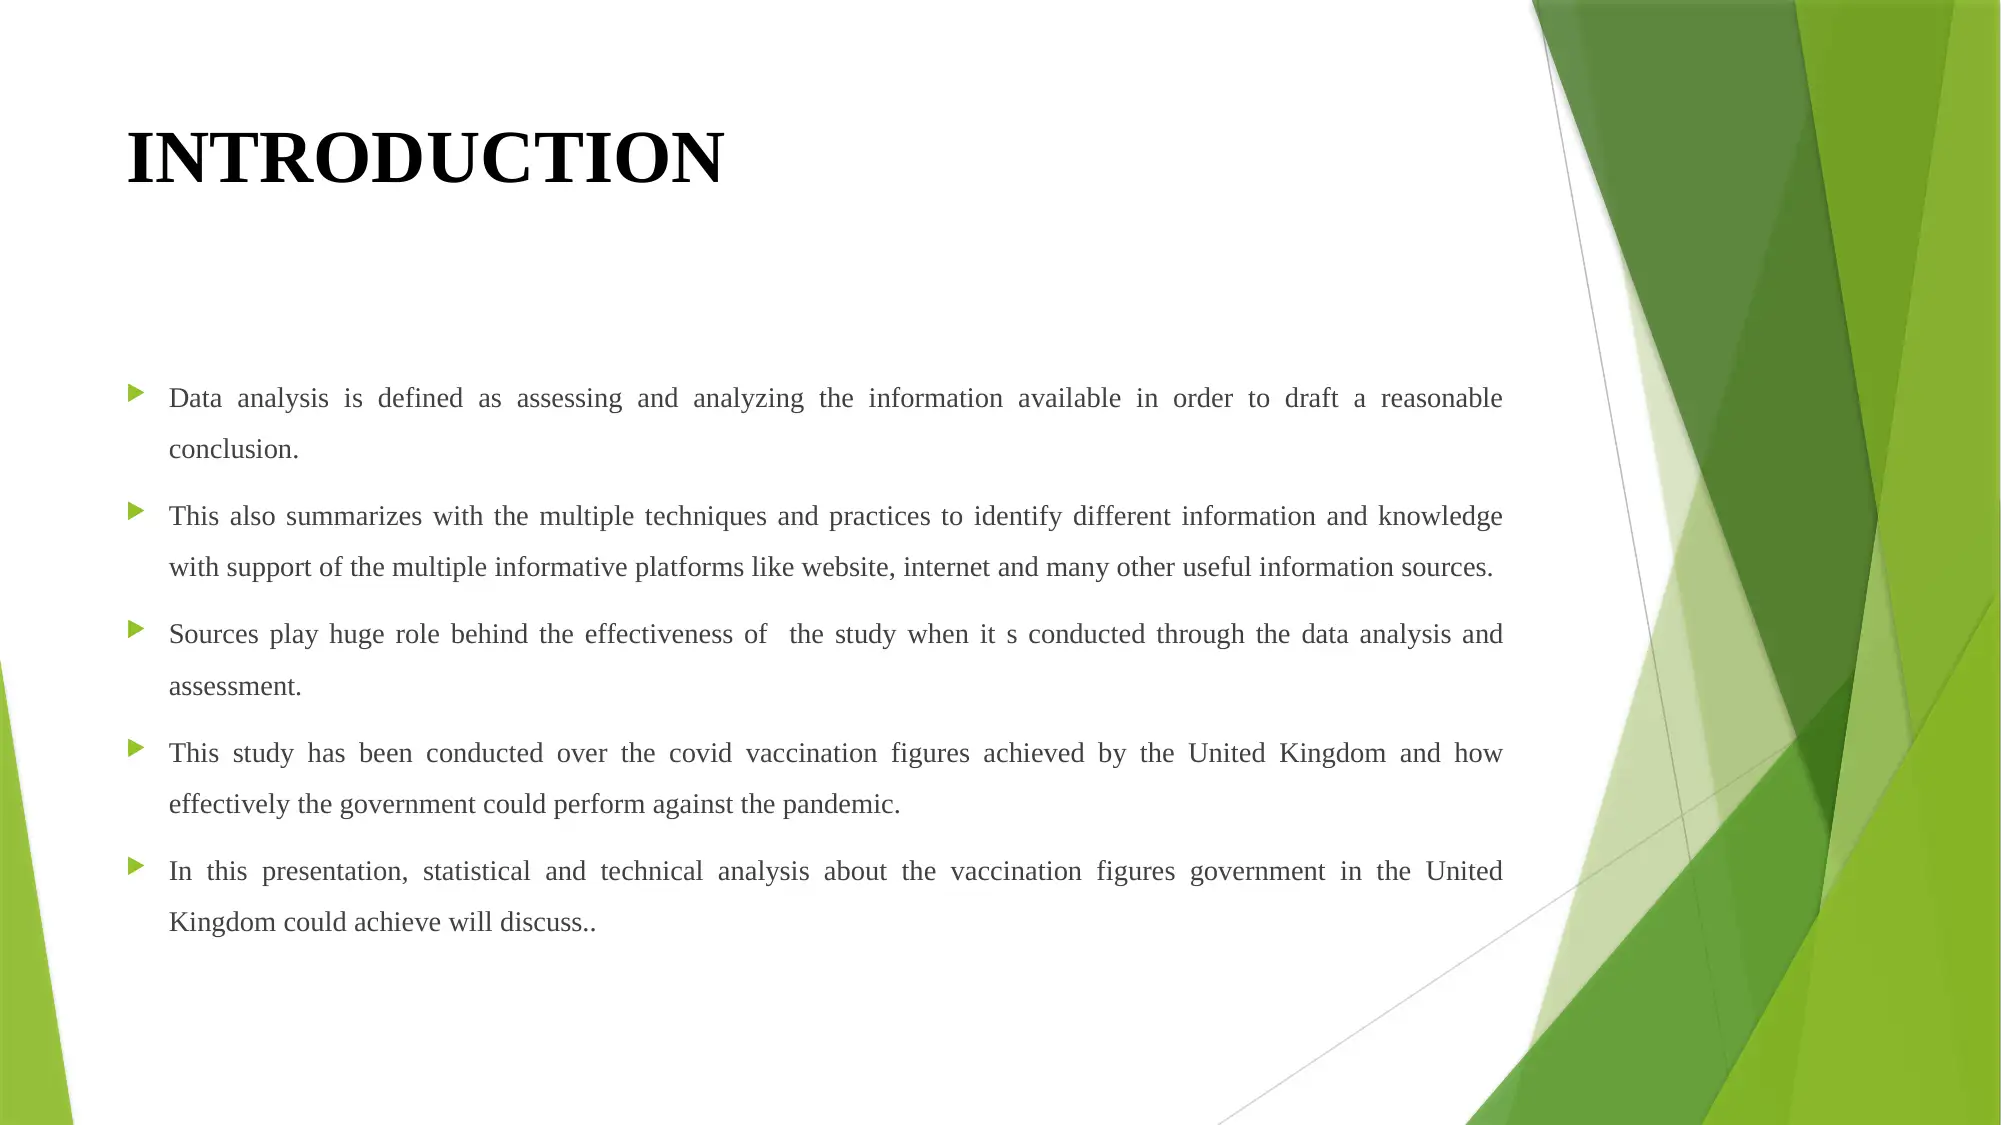
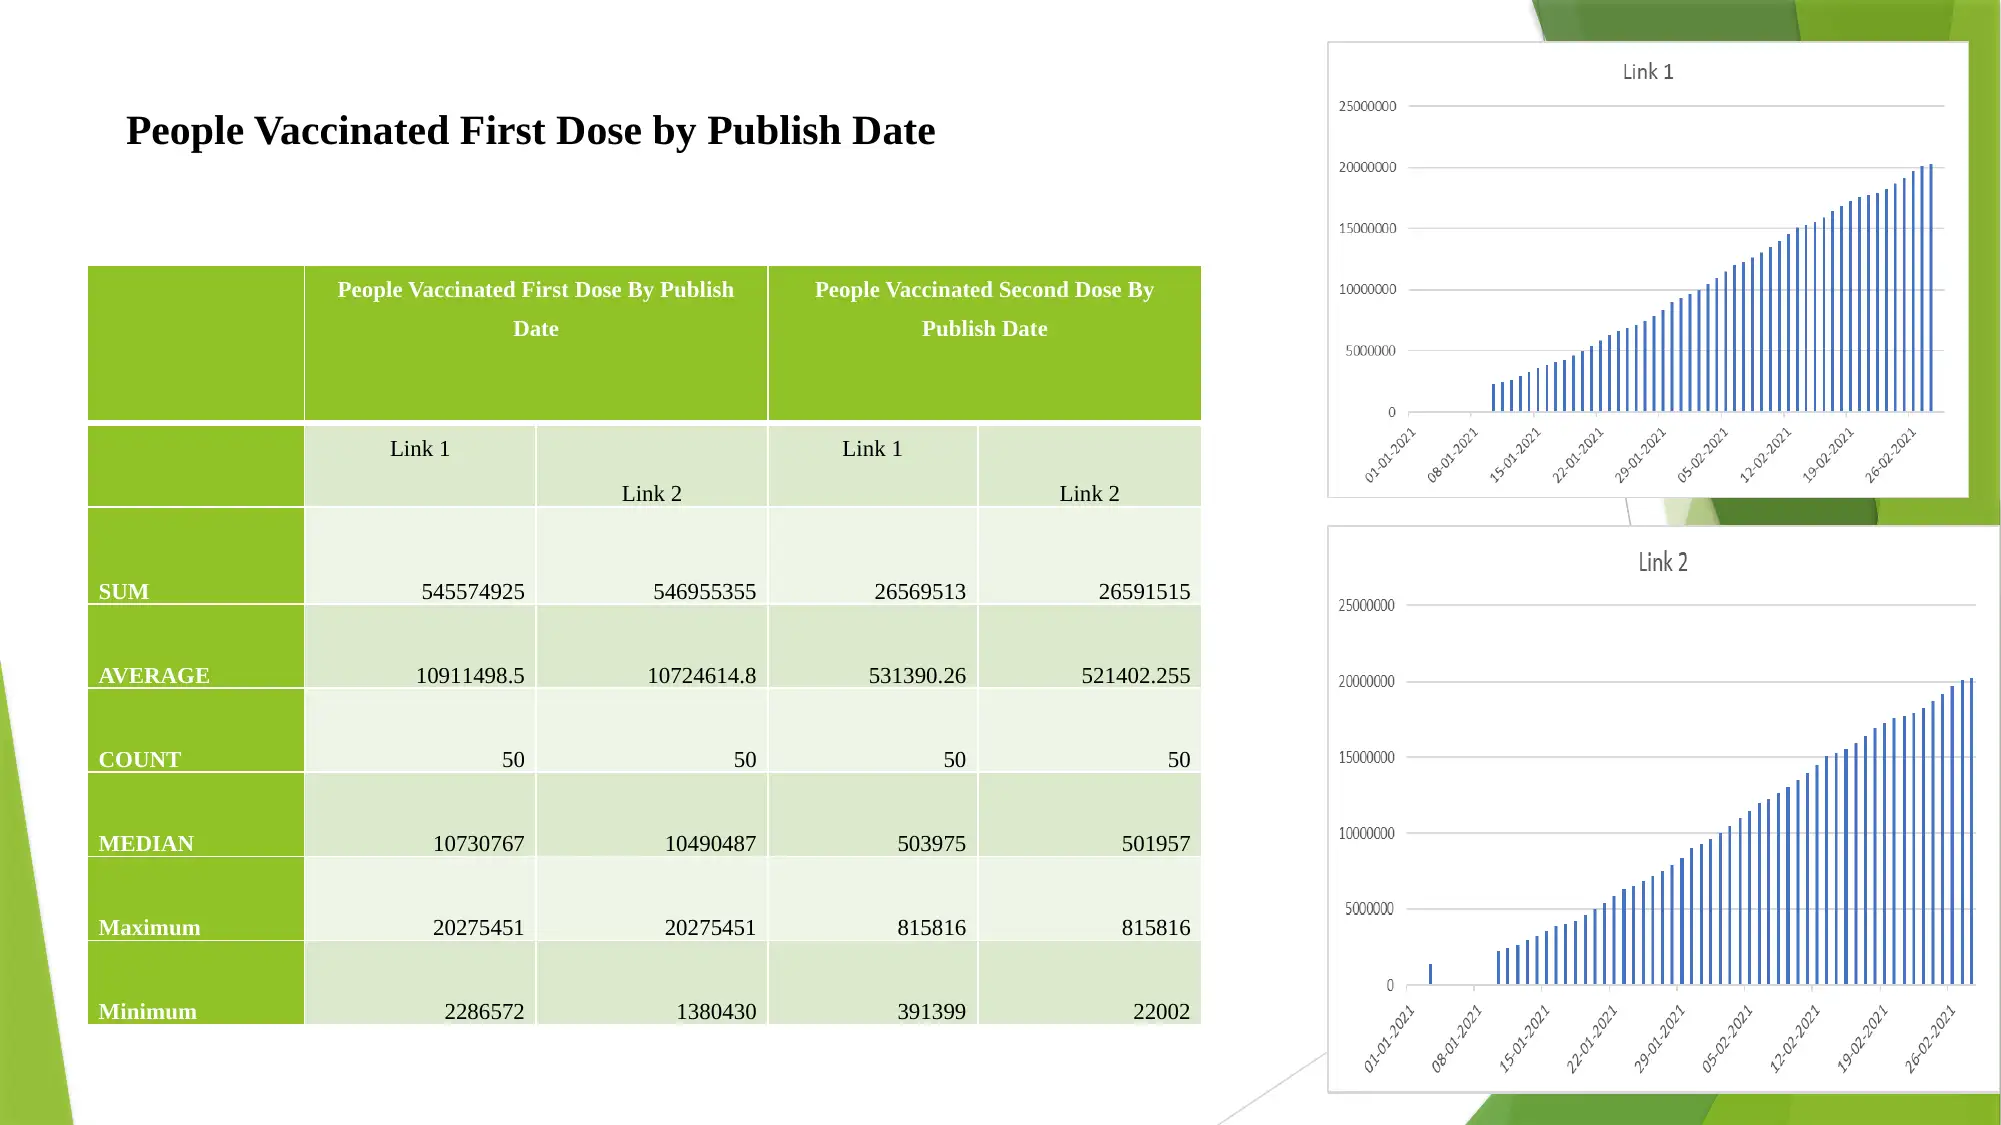
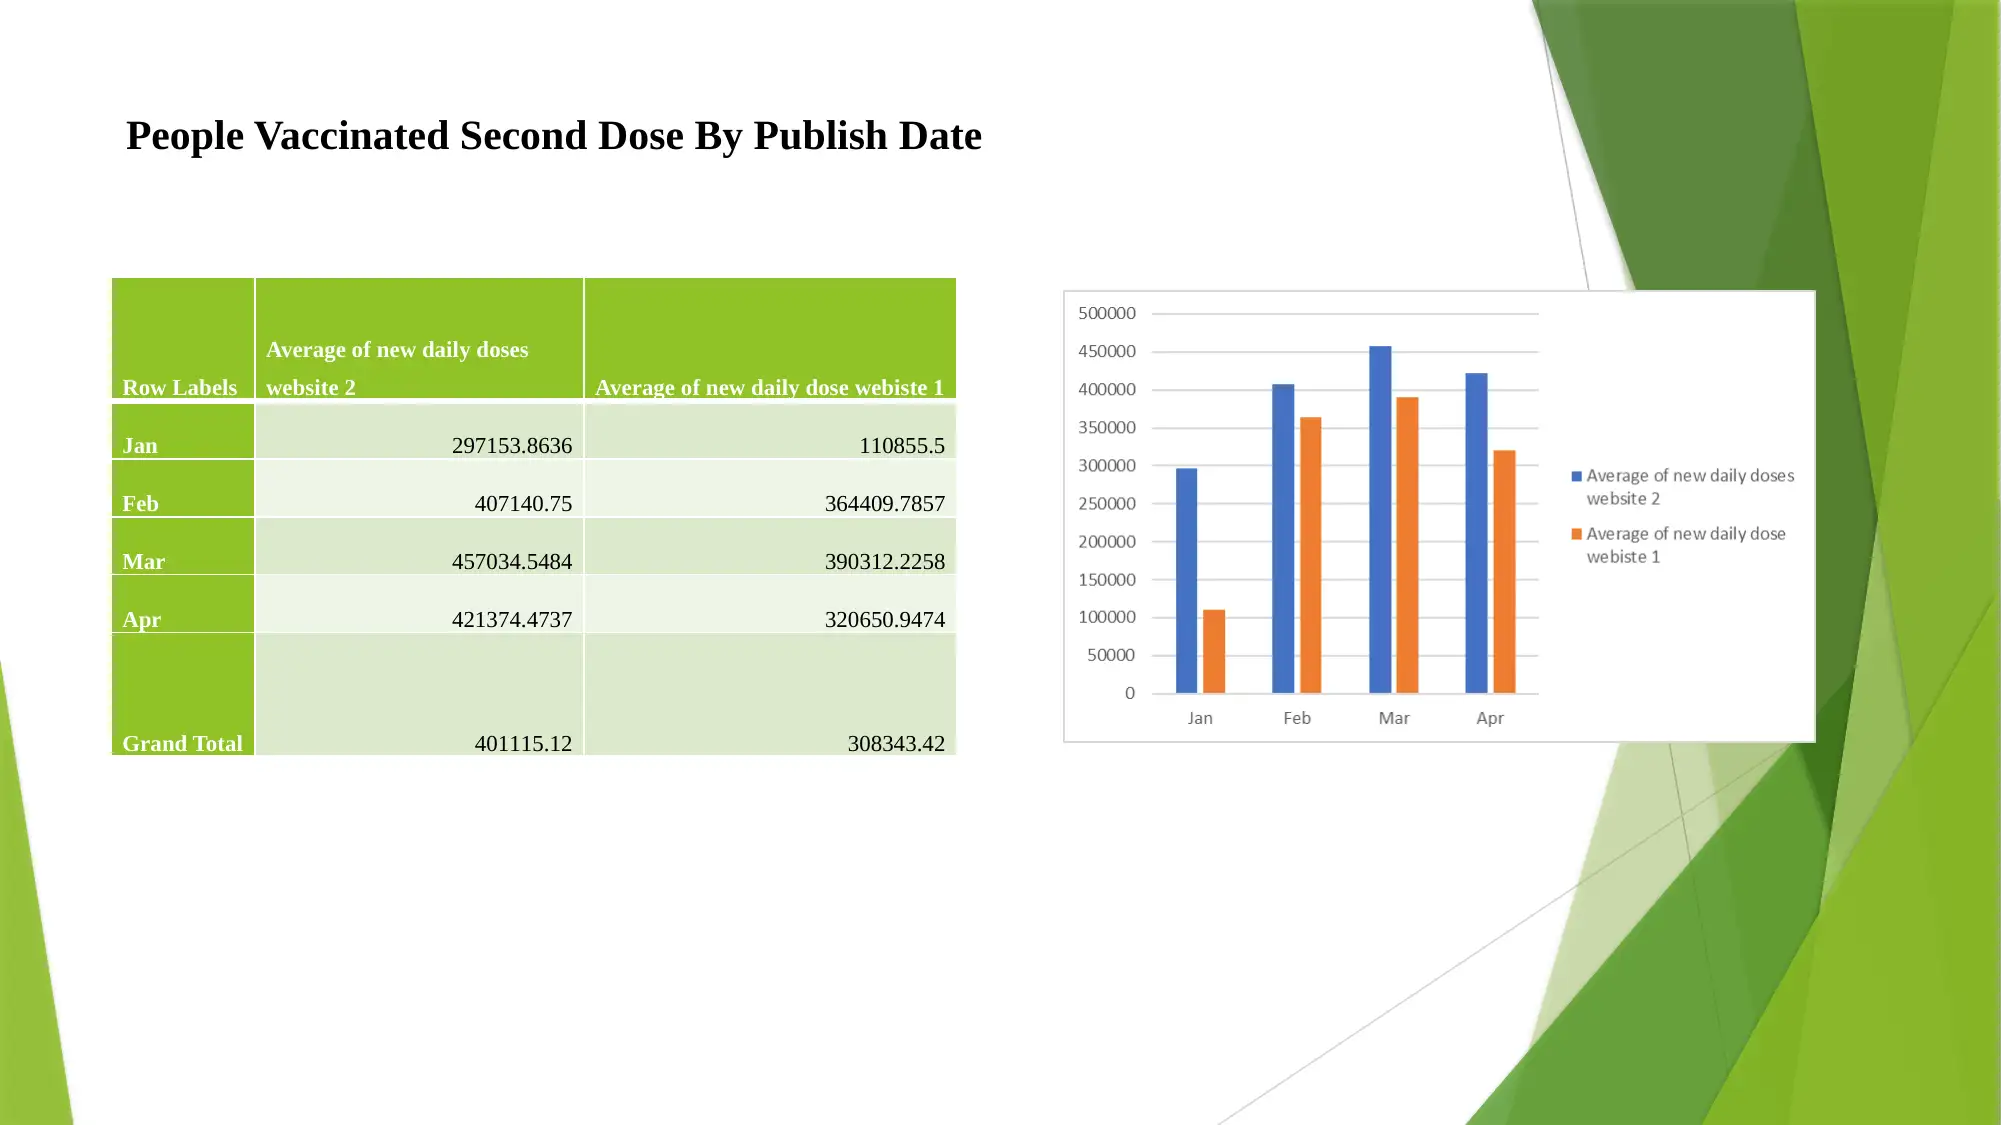
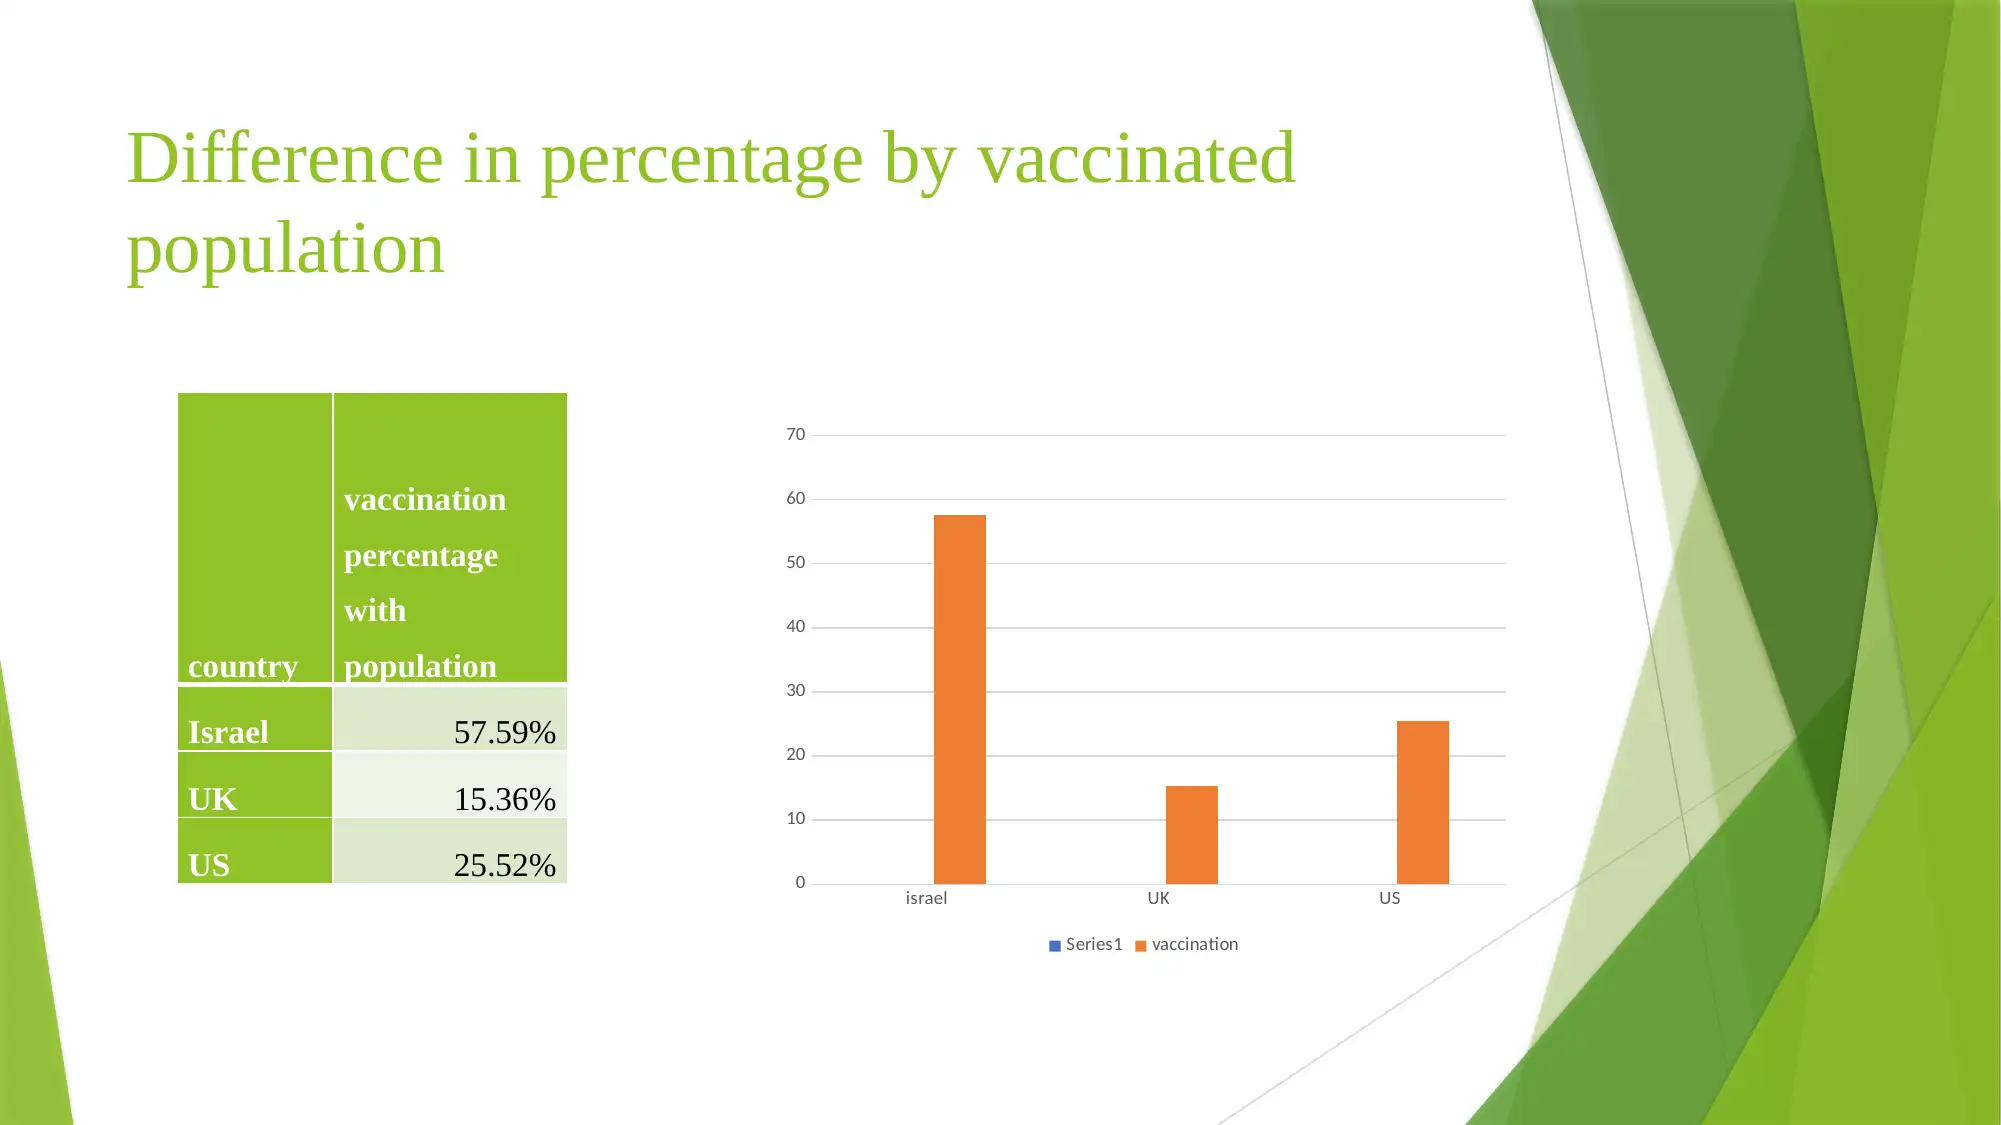
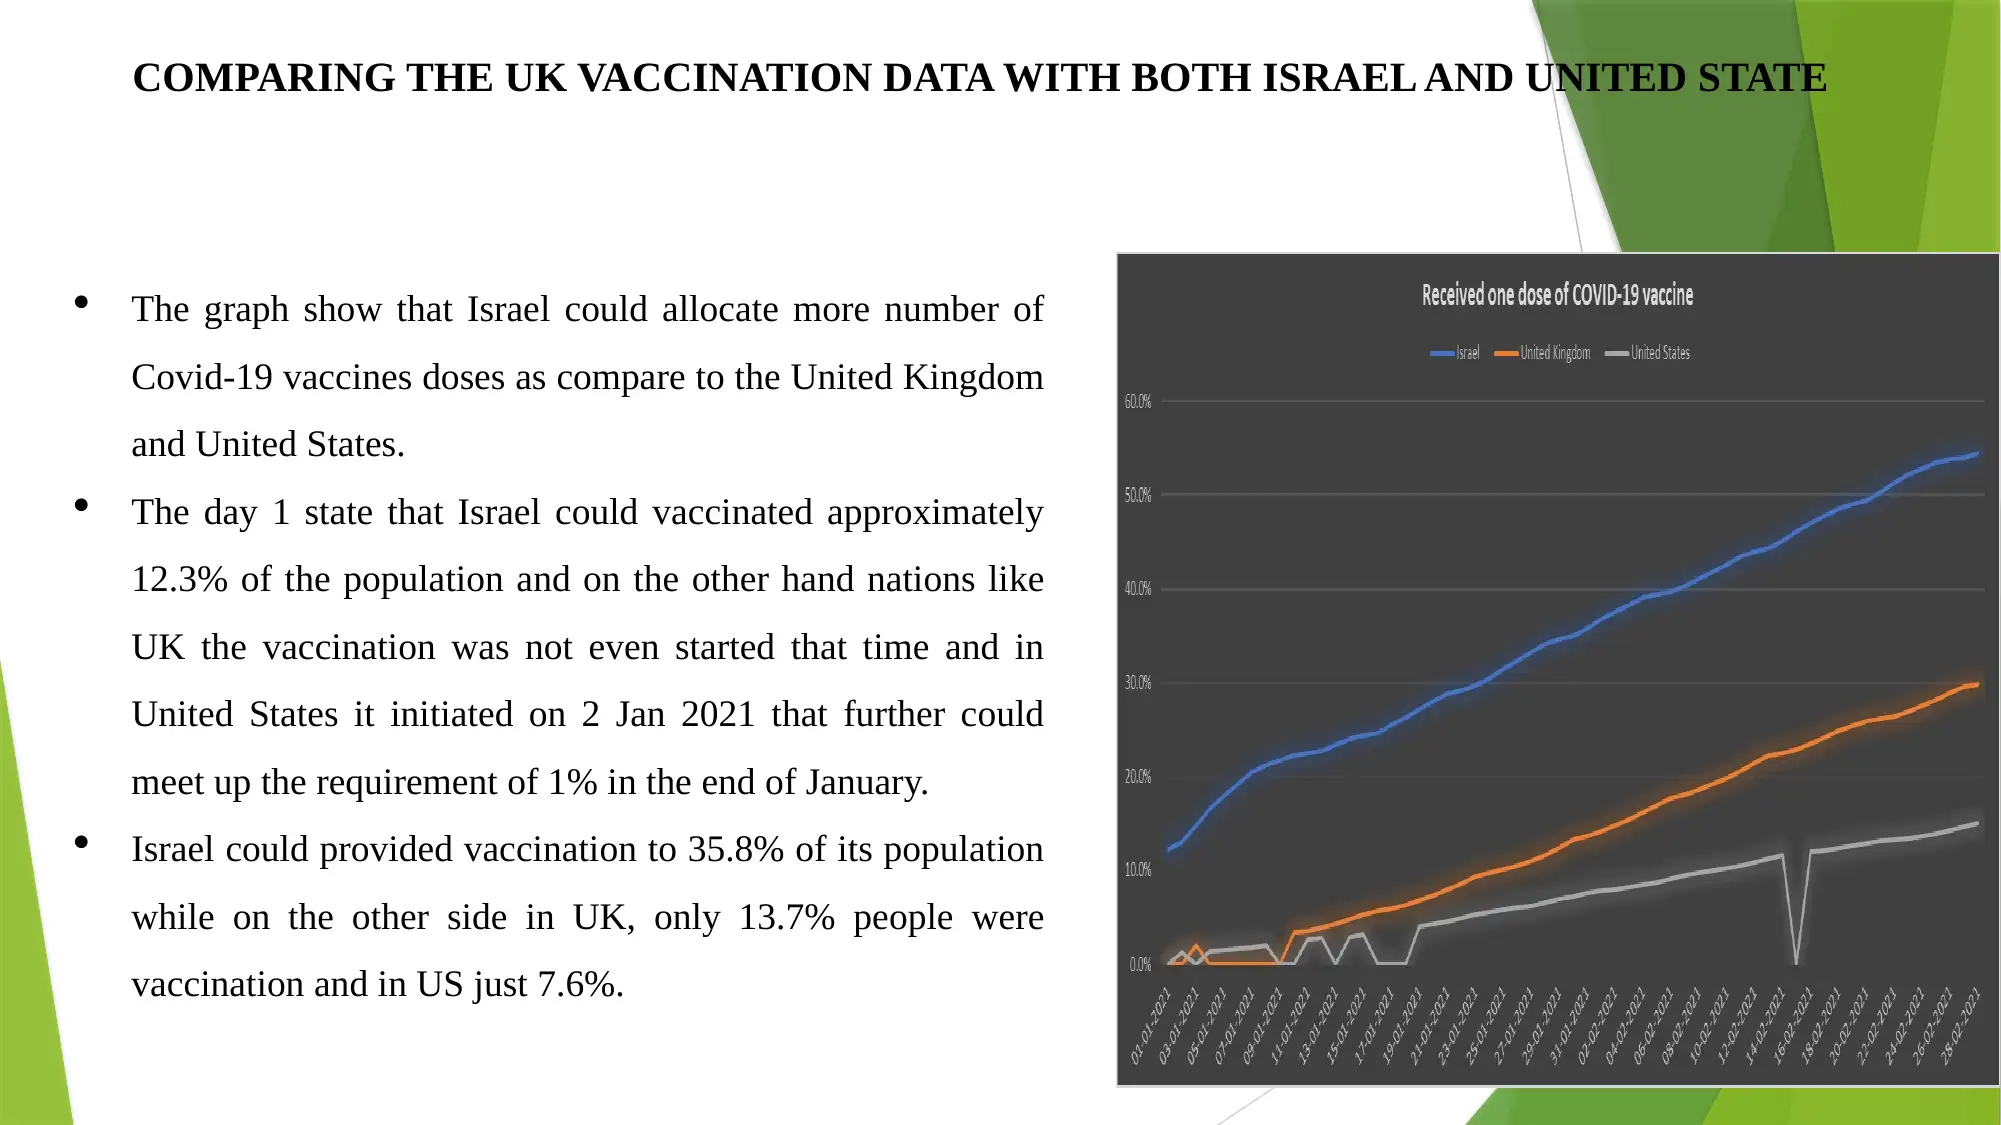
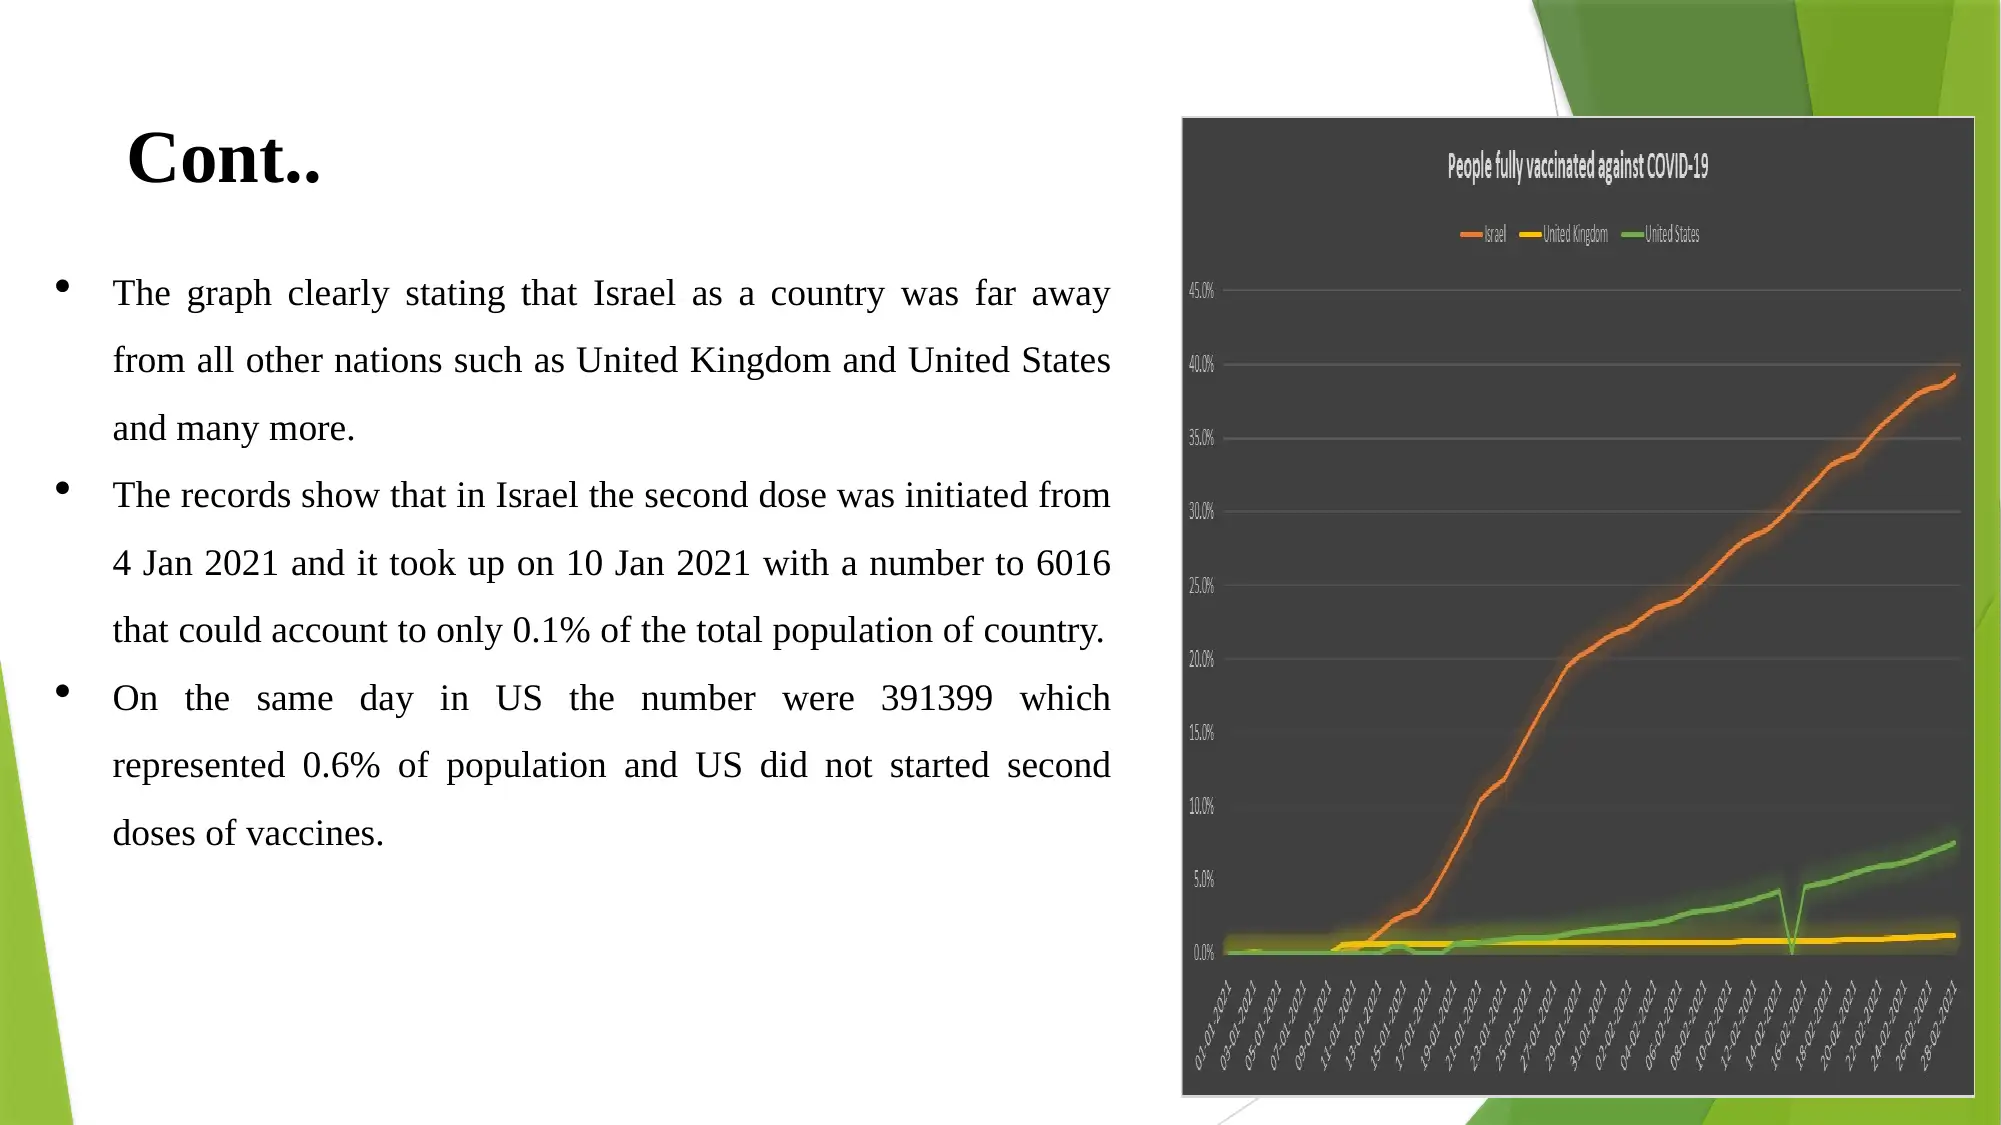
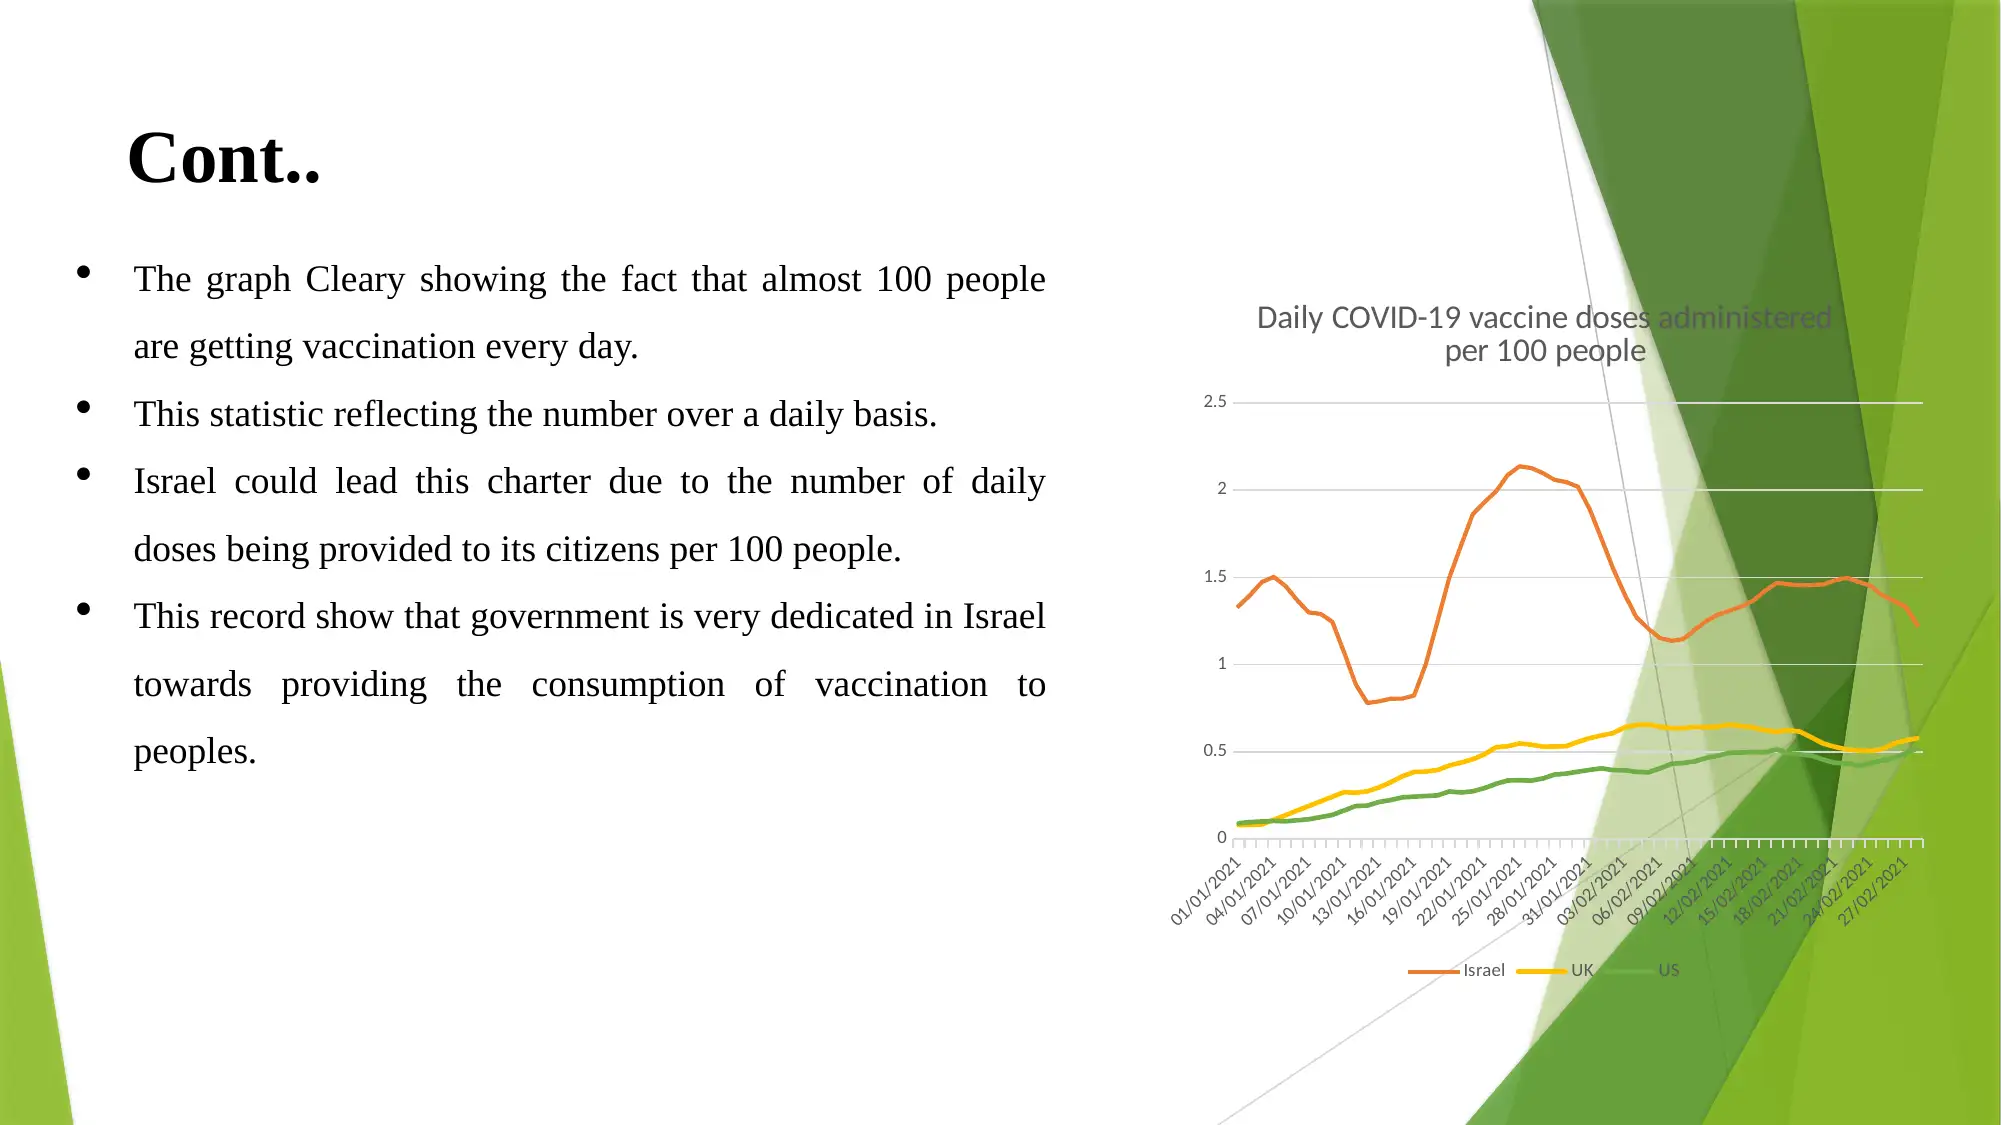
This report presents an analysis of COVID-19 vaccination data, focusing on the United Kingdom and comparing its vaccination progress with those of the United States and Israel. The introduction establishes the importance of data analysis in drawing conclusions and highlights the role of various information sources, including websites and the internet. The report provides statistical and technical analyses of the UK's vaccination figures, including the number of first and second doses administered over time. It utilizes tables and graphs to illustrate the vaccination rates and compare the UK's performance with Israel and the US. The analysis reveals that Israel had vaccinated a larger percentage of its population compared to the UK and US. The conclusion summarizes that Israel's efficient use of resources and medical staff enabled it to effectively combat the pandemic. The report includes references to various sources, including research papers and articles related to COVID-19 vaccination and data analysis.
tabler-icon-diamond-filled.svg

Contribute Materials

Your contribution can guide someone’s learning journey. Share your documents today.
Document Page
Data using
ICT
tabler-icon-diamond-filled.svg

Secure Best Marks with AI Grader

Need help grading? Try our AI Grader for instant feedback on your assignments.
Document Page
Table of content
INTRODUCTION
People Vaccinated First Dose by Publish Date
People Vaccinated Second Dose By Publish Date
COMPARING THE UK VACCINATION DATA WITH BOTH ISRAEL AND
UNITED STATE
CONCLUSION
REFERENCES
Document Page
INTRODUCTION
Data analysis is defined as assessing and analyzing the information available in order to draft a reasonable
conclusion.
This also summarizes with the multiple techniques and practices to identify different information and knowledge
with support of the multiple informative platforms like website, internet and many other useful information sources.
Sources play huge role behind the effectiveness of the study when it s conducted through the data analysis and
assessment.
This study has been conducted over the covid vaccination figures achieved by the United Kingdom and how
effectively the government could perform against the pandemic.
In this presentation, statistical and technical analysis about the vaccination figures government in the United
Kingdom could achieve will discuss..
Document Page
People Vaccinated First Dose by Publish Date
People Vaccinated First Dose By Publish
Date
People Vaccinated Second Dose By
Publish Date
Link 1
Link 2
Link 1
Link 2
SUM 545574925 546955355 26569513 26591515
AVERAGE 10911498.5 10724614.8 531390.26 521402.255
COUNT 50 50 50 50
MEDIAN 10730767 10490487 503975 501957
Maximum 20275451 20275451 815816 815816
Minimum 2286572 1380430 391399 22002
tabler-icon-diamond-filled.svg

Secure Best Marks with AI Grader

Need help grading? Try our AI Grader for instant feedback on your assignments.
Document Page
People Vaccinated Second Dose By Publish Date
Row Labels
Average of new daily doses
website 2 Average of new daily dose webiste 1
Jan 297153.8636 110855.5
Feb 407140.75 364409.7857
Mar 457034.5484 390312.2258
Apr 421374.4737 320650.9474
Grand Total 401115.12 308343.42
Document Page
Difference in percentage by vaccinated
population
country
vaccination
percentage
with
population
Israel 57.59%
UK 15.36%
US 25.52% israel UK US
0
10
20
30
40
50
60
70
Series1 vaccination
Document Page
COMPARING THE UK VACCINATION DATA WITH BOTH ISRAEL AND UNITED STATE
The graph show that Israel could allocate more number of
Covid-19 vaccines doses as compare to the United Kingdom
and United States.
The day 1 state that Israel could vaccinated approximately
12.3% of the population and on the other hand nations like
UK the vaccination was not even started that time and in
United States it initiated on 2 Jan 2021 that further could
meet up the requirement of 1% in the end of January.
Israel could provided vaccination to 35.8% of its population
while on the other side in UK, only 13.7% people were
vaccination and in US just 7.6%.
tabler-icon-diamond-filled.svg

Paraphrase This Document

Need a fresh take? Get an instant paraphrase of this document with our AI Paraphraser
Document Page
Cont..
The graph clearly stating that Israel as a country was far away
from all other nations such as United Kingdom and United States
and many more.
The records show that in Israel the second dose was initiated from
4 Jan 2021 and it took up on 10 Jan 2021 with a number to 6016
that could account to only 0.1% of the total population of country.
On the same day in US the number were 391399 which
represented 0.6% of population and US did not started second
doses of vaccines.
Document Page
Cont..
01/01/2021
04/01/2021
07/01/2021
10/01/2021
13/01/2021
16/01/2021
19/01/2021
22/01/2021
25/01/2021
28/01/2021
31/01/2021
03/02/2021
06/02/2021
09/02/2021
12/02/2021
15/02/2021
18/02/2021
21/02/2021
24/02/2021
27/02/2021
0
0.5
1
1.5
2
2.5
Daily COVID-19 vaccine doses administered
per 100 people
Israel UK US
The graph Cleary showing the fact that almost 100 people
are getting vaccination every day.
This statistic reflecting the number over a daily basis.
Israel could lead this charter due to the number of daily
doses being provided to its citizens per 100 people.
This record show that government is very dedicated in Israel
towards providing the consumption of vaccination to
peoples.
Document Page
CONCLUSION
It can be summarised from data that Israel has vaccinated more people as compared to
both US and UK. They have covered more population than both US and UK. So, it has
enabled them to fight with pandemic in more effective way and control its spread
within people.
Moreover, in January government started vaccinating more and more people as
compared to month Feb March and April. The average of daily doses given to people in
Israel was more than average of US and UK.
It led to protecting people against covid 19. Israel used its resources and medical staff
in efficient and effective way. Furthermore, it is concluded that UK and US are not
giving more average doses to people as compared to their population percentage.
tabler-icon-diamond-filled.svg

Secure Best Marks with AI Grader

Need help grading? Try our AI Grader for instant feedback on your assignments.
Document Page
REFERENCES
Hotez, P. J., 2021. Anti-science kills: From Soviet embrace of pseudoscience to accelerated attacks on US biomedicine. PLoS
biology. 19(1),.p.e3001068.
Chodcik, G. and et.al., 2021. The effectiveness of the first dose of BNT162 b 2 vaccine in reducing SARS-CoV-2 infection 13-24 days after
immunization: real-world evidence. Medrxiv.
Asahara, M., 2020. The effect of BCG vaccination on COVID-19 examined by a statistical approach: no positive results from the Diamond Princess
and cross-national differences previously reported by world-wide comparisons are flawed in several ways. medRxiv.
Goldman, R.D. and et.al., 2020. Caregiver willingness to vaccinate their children against COVID-19: Cross sectional survey. Vaccine. 38(48).
pp.7668-7673.
Ohta, R., Yoshinori, R., Sato, M. and Maeno, T., 2020. Challenges of using ICT regarding acute conditions in rural home care: A thematic
analysis. Journal of Interprofessional Education & Practice, 20, p.100349.
Yang, W. and Lam, P.T., 2021. Evaluating non-market costs of ICT involving data transmission in smart cities. Building Research & Information, pp.1-
14.
Adimoolam, M., John, A., Balamurugan, N.M. and Kumar, T.A., 2021. Green ICT Communication, Networking and Data Processing. In Green
Computing in Smart Cities: Simulation and Techniques (pp. 95-124). Springer, Cham.
Document Page
THANK YOU
chevron_up_icon
1 out of 12
circle_padding
hide_on_mobile
zoom_out_icon
logo.png

Your All-in-One AI-Powered Toolkit for Academic Success.

Available 24*7 on WhatsApp / Email

[object Object]