Analyzing COVID-19 Vaccination Data: UK vs. US and Israel Comparison

Verified

Added on  2023/06/18

|14
|570
|232
Report
AI Summary
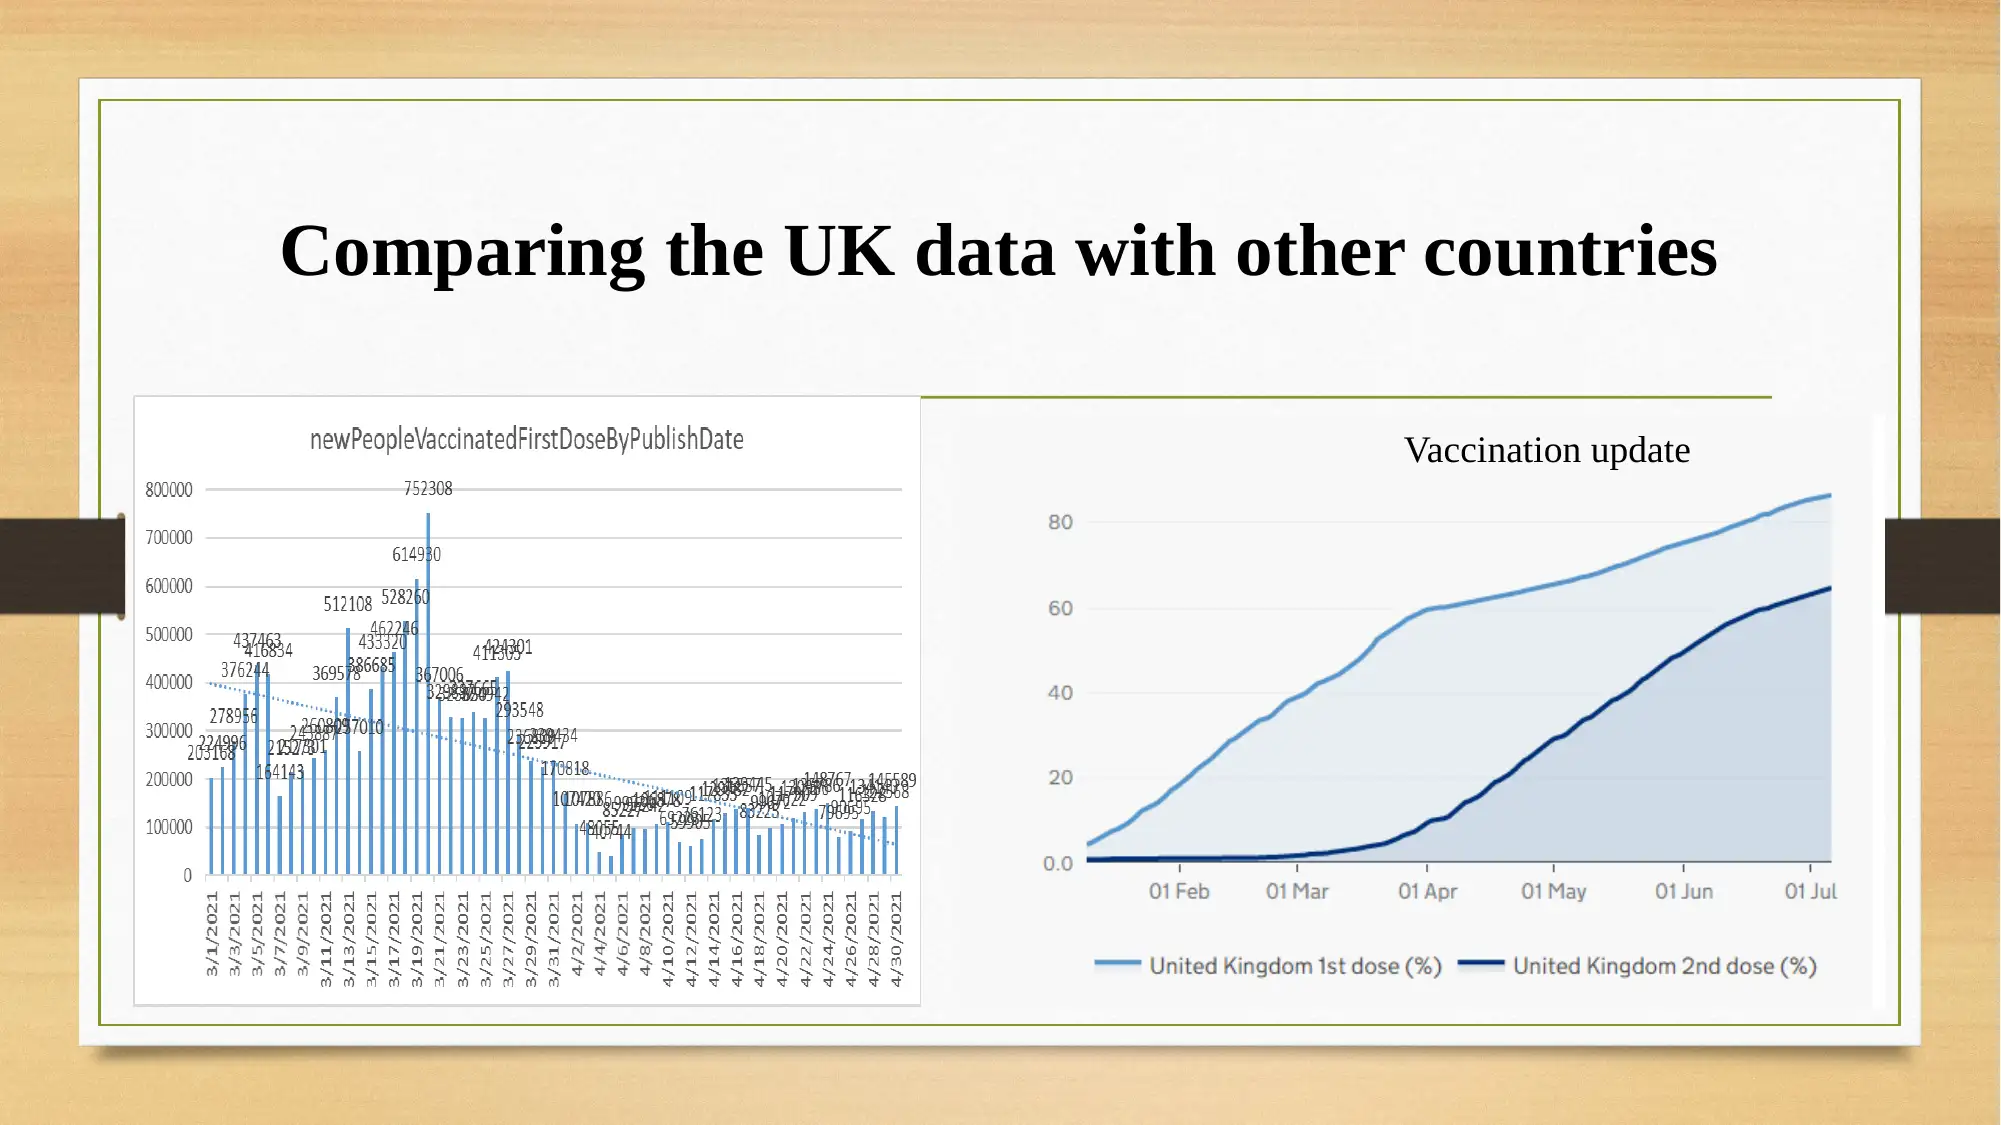
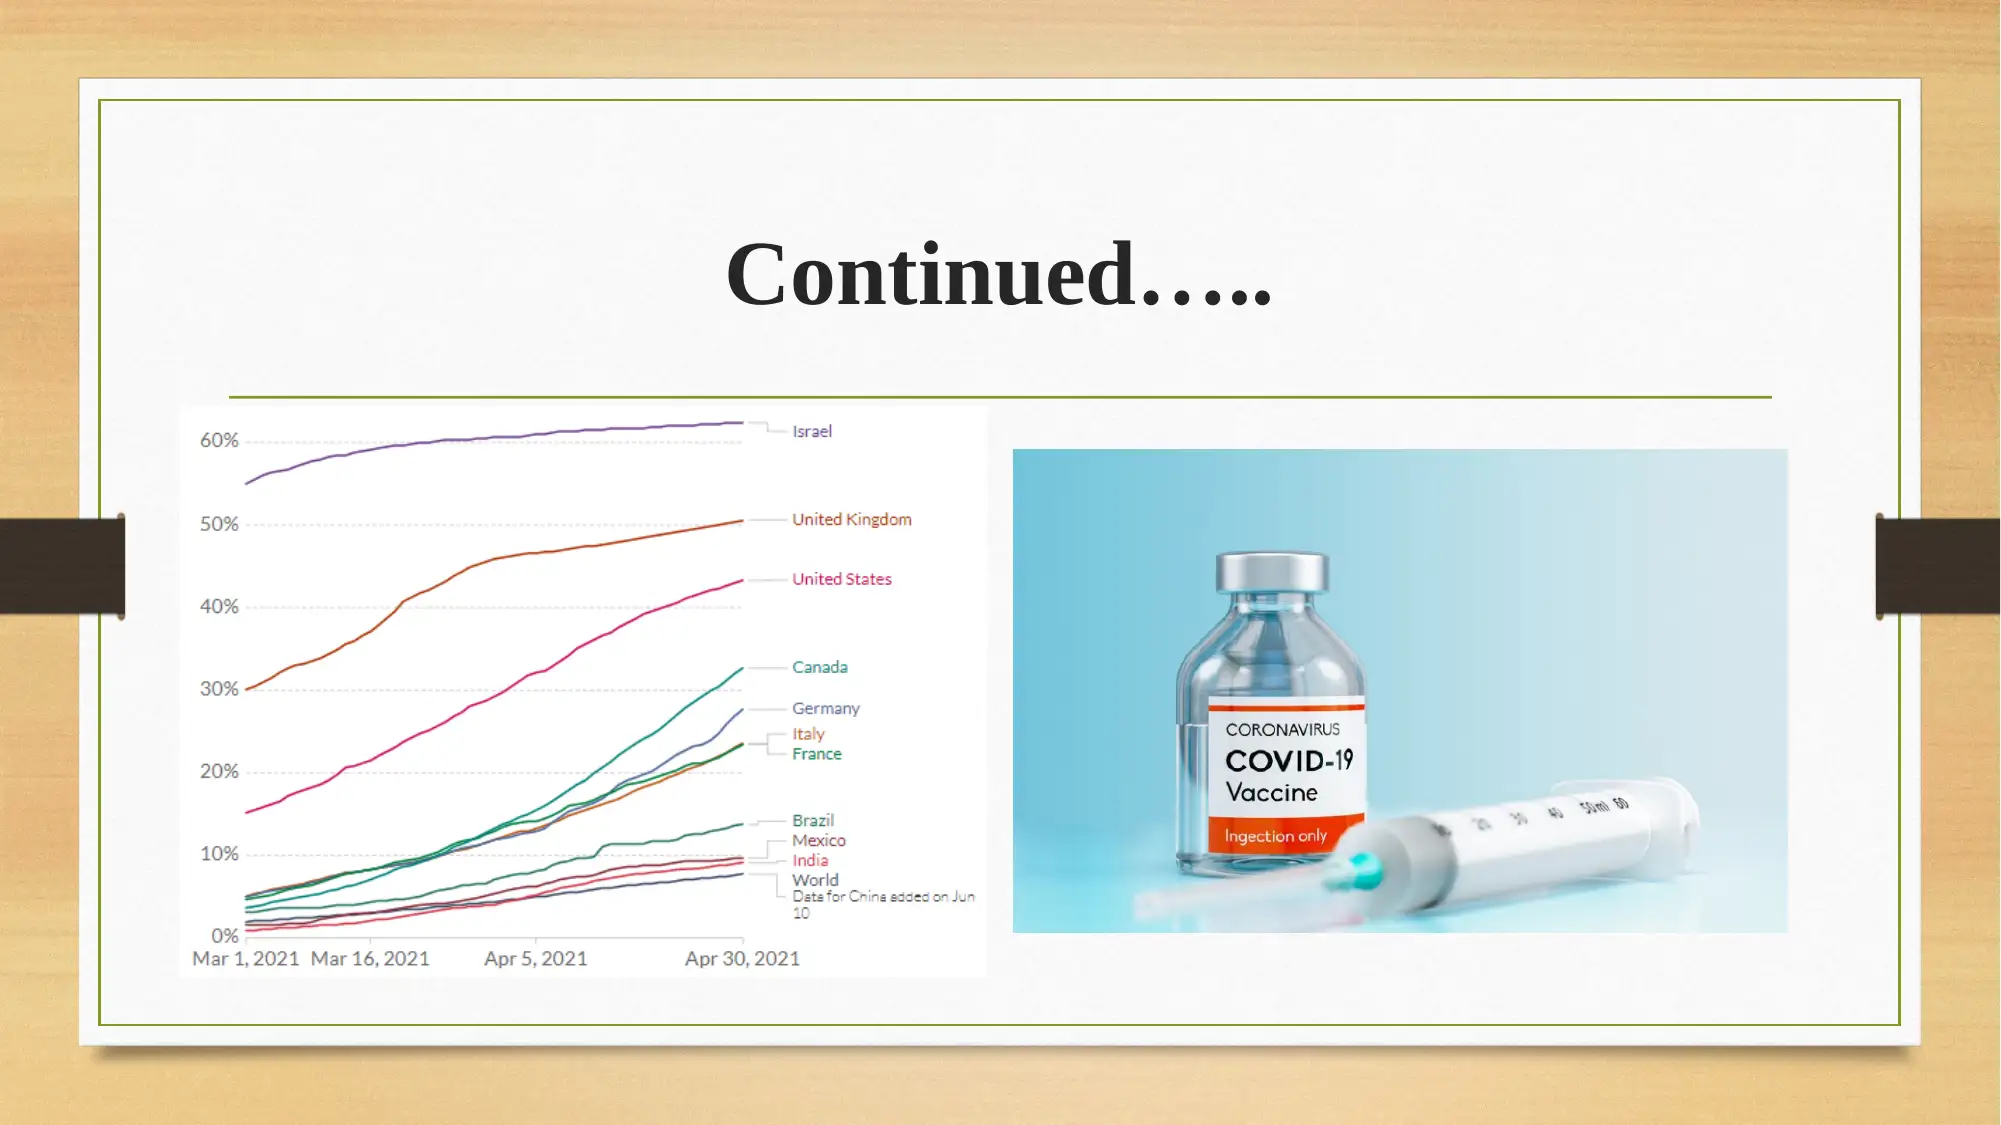
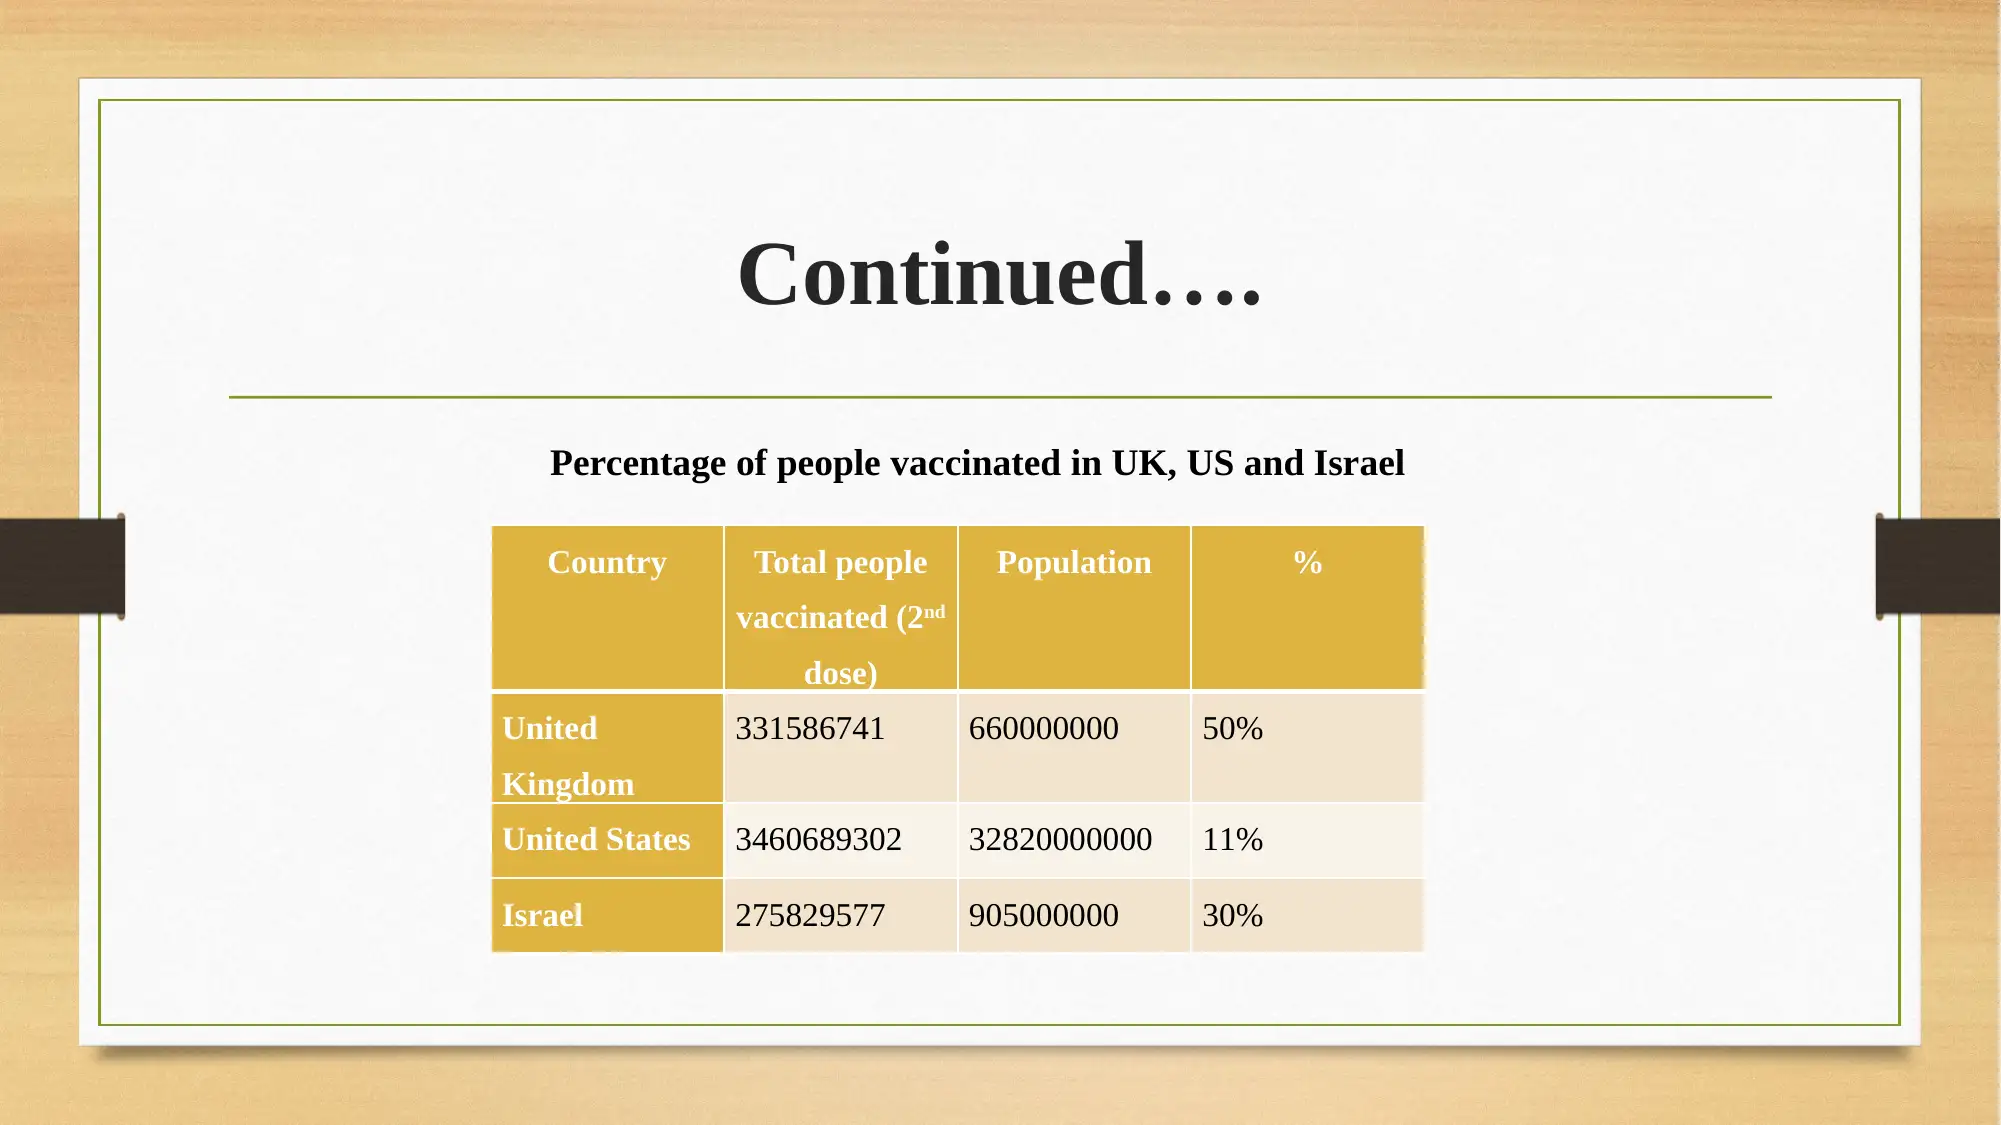
This report provides a comparative analysis of COVID-19 vaccination data from the UK, US, and Israel. It examines vaccination rates, doses administered, and percentage of the population vaccinated in each country. The study highlights differences and similarities in vaccination progress, attributing fluctuations to factors like public perception and awareness. The analysis reveals that the US initially led in total doses administered, followed by the UK and Israel. However, when considering the percentage of the population vaccinated with both doses, the UK leads with 50%, followed by Israel at 30%, and the US. The report concludes that while vaccination rates have generally increased over time in all three countries, disparities exist due to varying population sizes and levels of public engagement. Desklib offers similar solved assignments for students.
Document Page
Data Analysis
tabler-icon-diamond-filled.svg

Paraphrase This Document

Need a fresh take? Get an instant paraphrase of this document with our AI Paraphraser
Document Page
Table of content
Introduction
Comparing the UK data with other countries
Comparison of UK Vaccination data with Israel and US
Conclusion
references
Document Page
Introduction
In the present era, entire world faces issue due to pandemic because there are lacs of deaths
recorded.
The present study also helps to shed a light upon the differences between countries in order to
provide vaccines to people.
However, at the end of 2020, scientist and doctors start working upon vaccines so that death rates
can be controlled.
For that, the study will compare the countries data in order to identify number of deaths as well as
people took vaccines.
With the help of excel and different formulas, the present study assist to differentiate the data of
UK from Israel and US.
Document Page
Comparing the UK data with other countries
Vaccination update
tabler-icon-diamond-filled.svg

Paraphrase This Document

Need a fresh take? Get an instant paraphrase of this document with our AI Paraphraser
Document Page
Continued…..
Document Page
Differences and similarity
Throughout the comparison, it has been examined that there is a difference in the perception of people
due to rumor about vaccines. As a result, there is a fluctuation identified within all the countries
vaccination data.
Apart from this, it has been also identified that there is a continuous fluctuation trend within the
dataset of countries. This is because of lack of awareness and majority of countries did not even
provide complete information regard to vaccines to all the people. That is why, it affected the overall
performance.
Document Page
Comparison of UK Vaccination data with
Israel and US
Comparison of 1st dose in UK, Israel and US
Particulars UK US Israel
Mean 29156377 98598085 5206682
mode #N/A #N/A #N/A
Median 31147444 97593290 5247414
UK US Israel
29156377.31147
54
98598084.50819
67
5206681.950819
67
0 0 0
31147444
97593290
5247414
Comparison of UK 1st dose
vaccination with US and Israel
Mean mode Median
tabler-icon-diamond-filled.svg

Paraphrase This Document

Need a fresh take? Get an instant paraphrase of this document with our AI Paraphraser
Document Page
Continued….
Document Page
Continued….
Number of people vaccinated 2nd dose
Particular
s UK US Israel
Sum 331586741 3490689302 275829577
Count 60 60 60
average 5681050.1 58886829.8 4604586.4
minimum 844098 25466405 3457997
Maximum 14957313 101407318 5050195
Document Page
Continued….
Number of people vaccinated 2nd dose
tabler-icon-diamond-filled.svg

Paraphrase This Document

Need a fresh take? Get an instant paraphrase of this document with our AI Paraphraser
Document Page
Continued….
Country Total people
vaccinated (2nd
dose)
Population %
United
Kingdom
331586741 660000000 50%
United States 3460689302 32820000000 11%
Israel 275829577 905000000 30%
Percentage of people vaccinated in UK, US and Israel
Document Page
Conclusion
By summing up above PPT it has been concluded that US stood at first position where people got
first as well as second dose easily. This is followed by UK and Israel respectively.
However, it has been also summarized through the above tables and graphs that as the time passes,
there is increasing trend identified among the countries first and second dose administration.
Also, 50% of UK people took both vaccines while US stood at last because of high number of
population. Further, it has been followed by Israel where 30% of the people administrated of both
doses.
chevron_up_icon
1 out of 14
circle_padding
hide_on_mobile
zoom_out_icon
[object Object]