Vaccine Data Analysis Report - COVID-19 Data Analysis & Comparison

Verified

Added on  2022/12/09

|12
|370
|55
Report
AI Summary
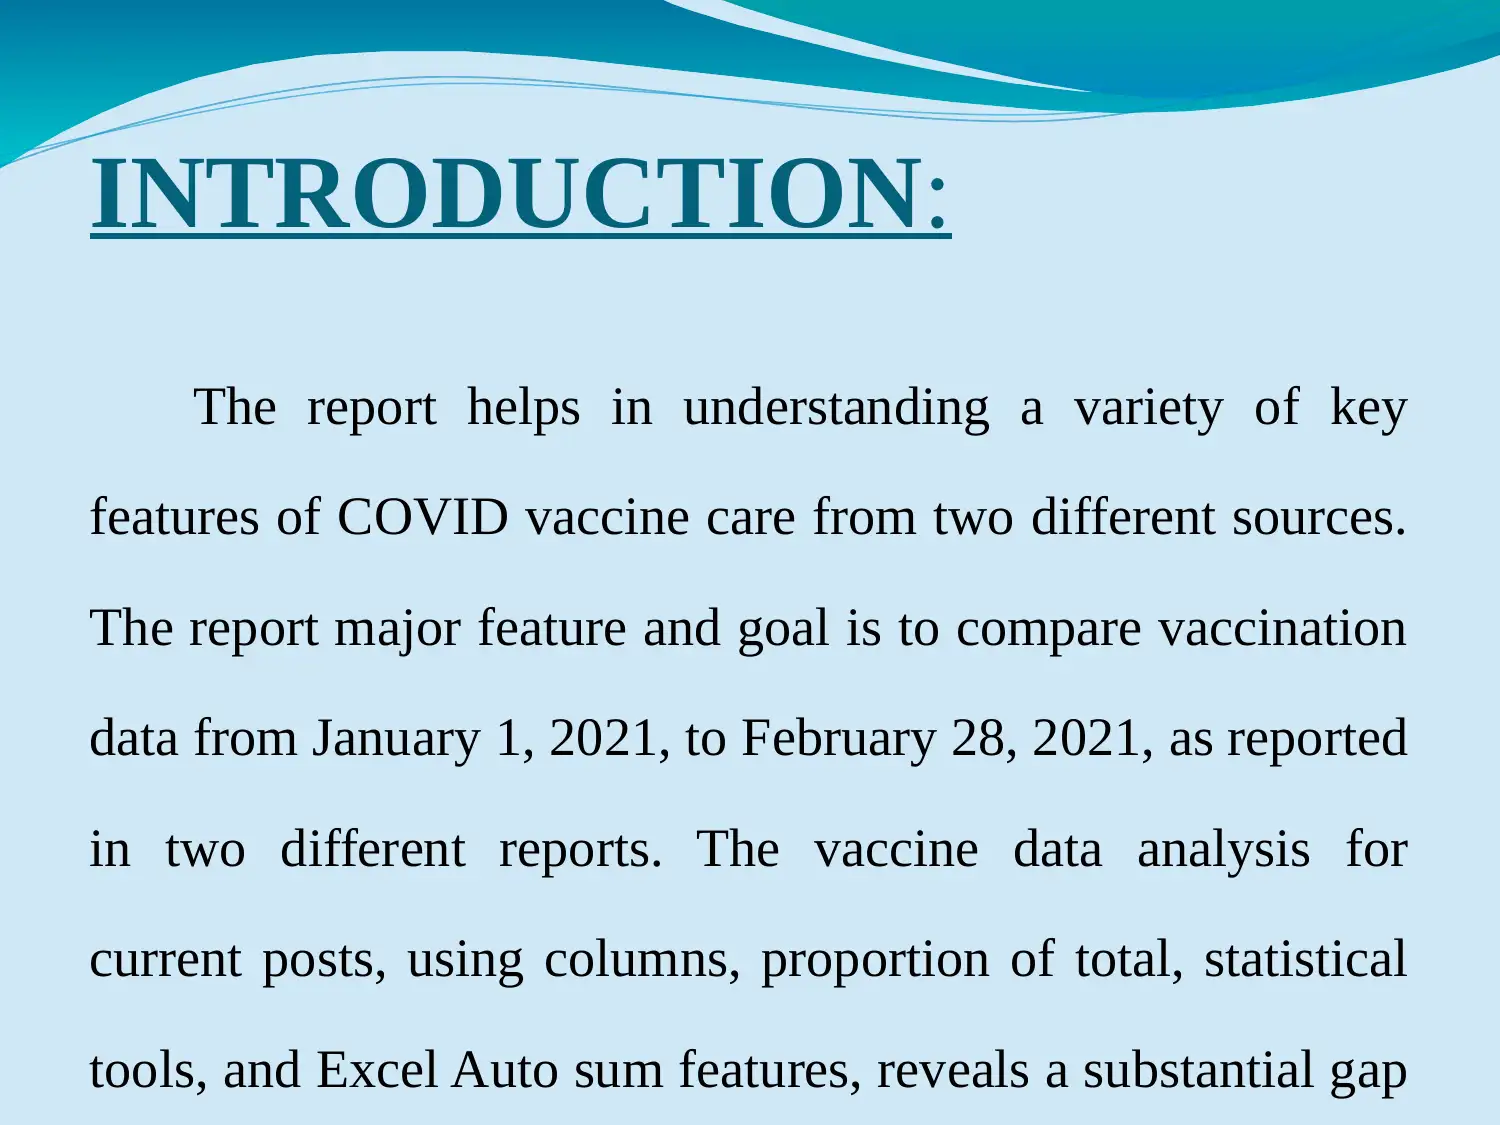
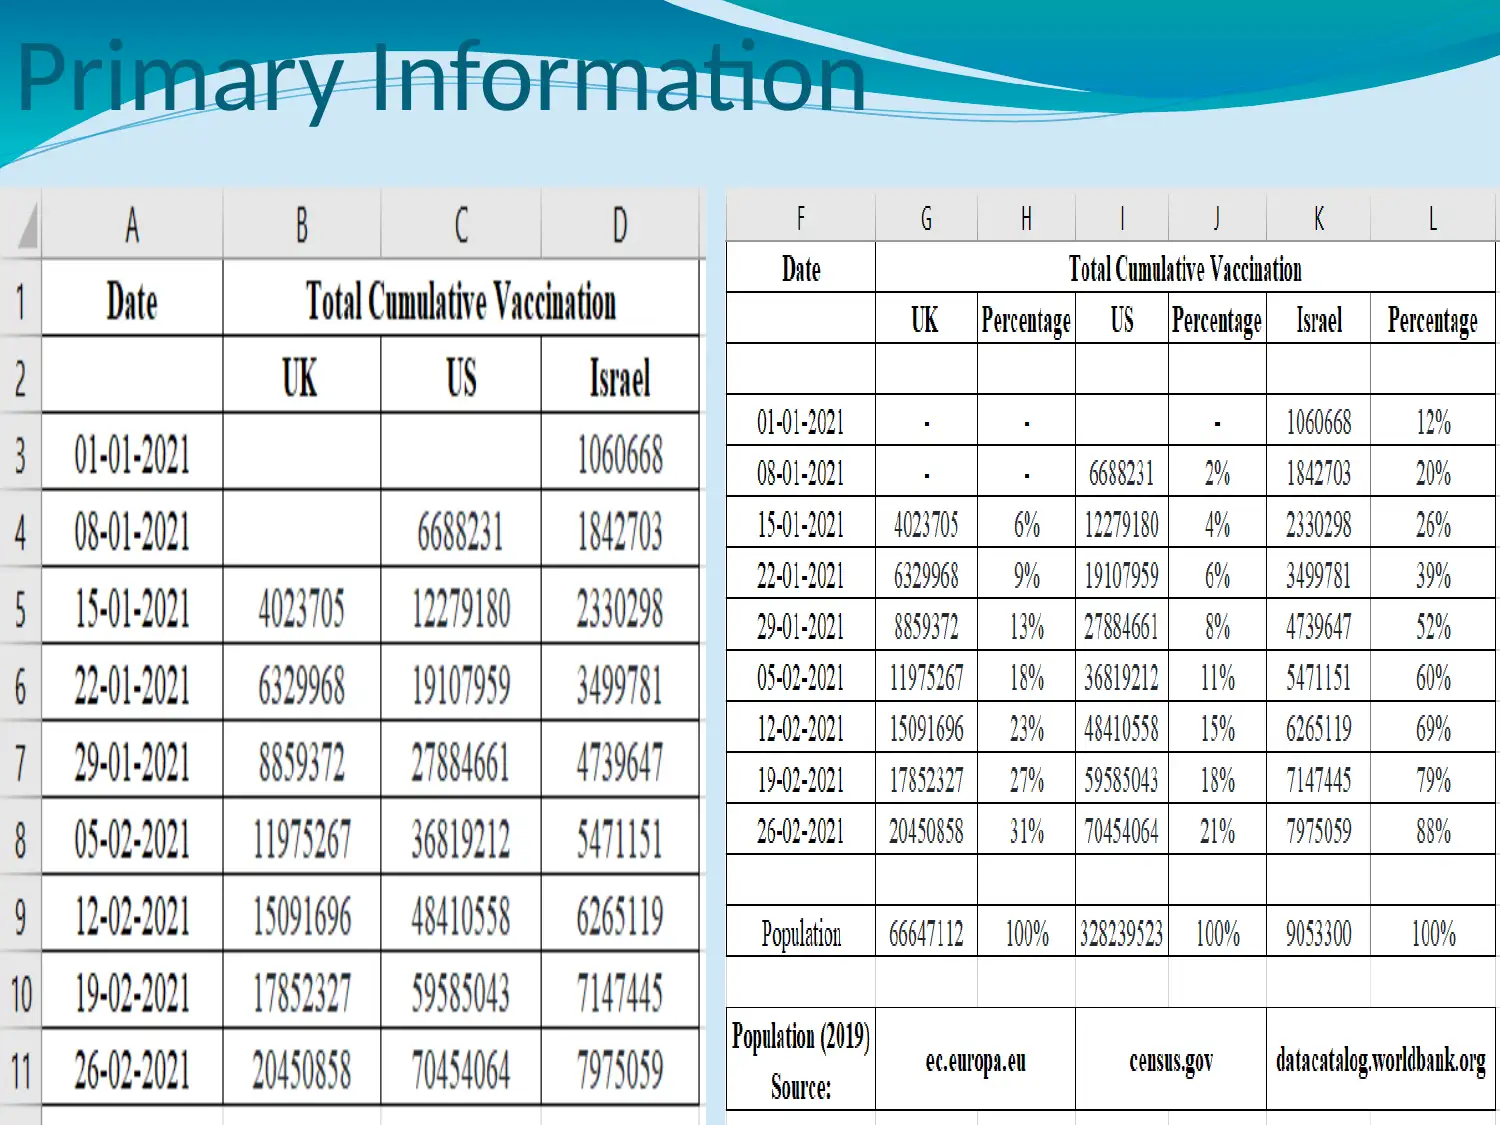
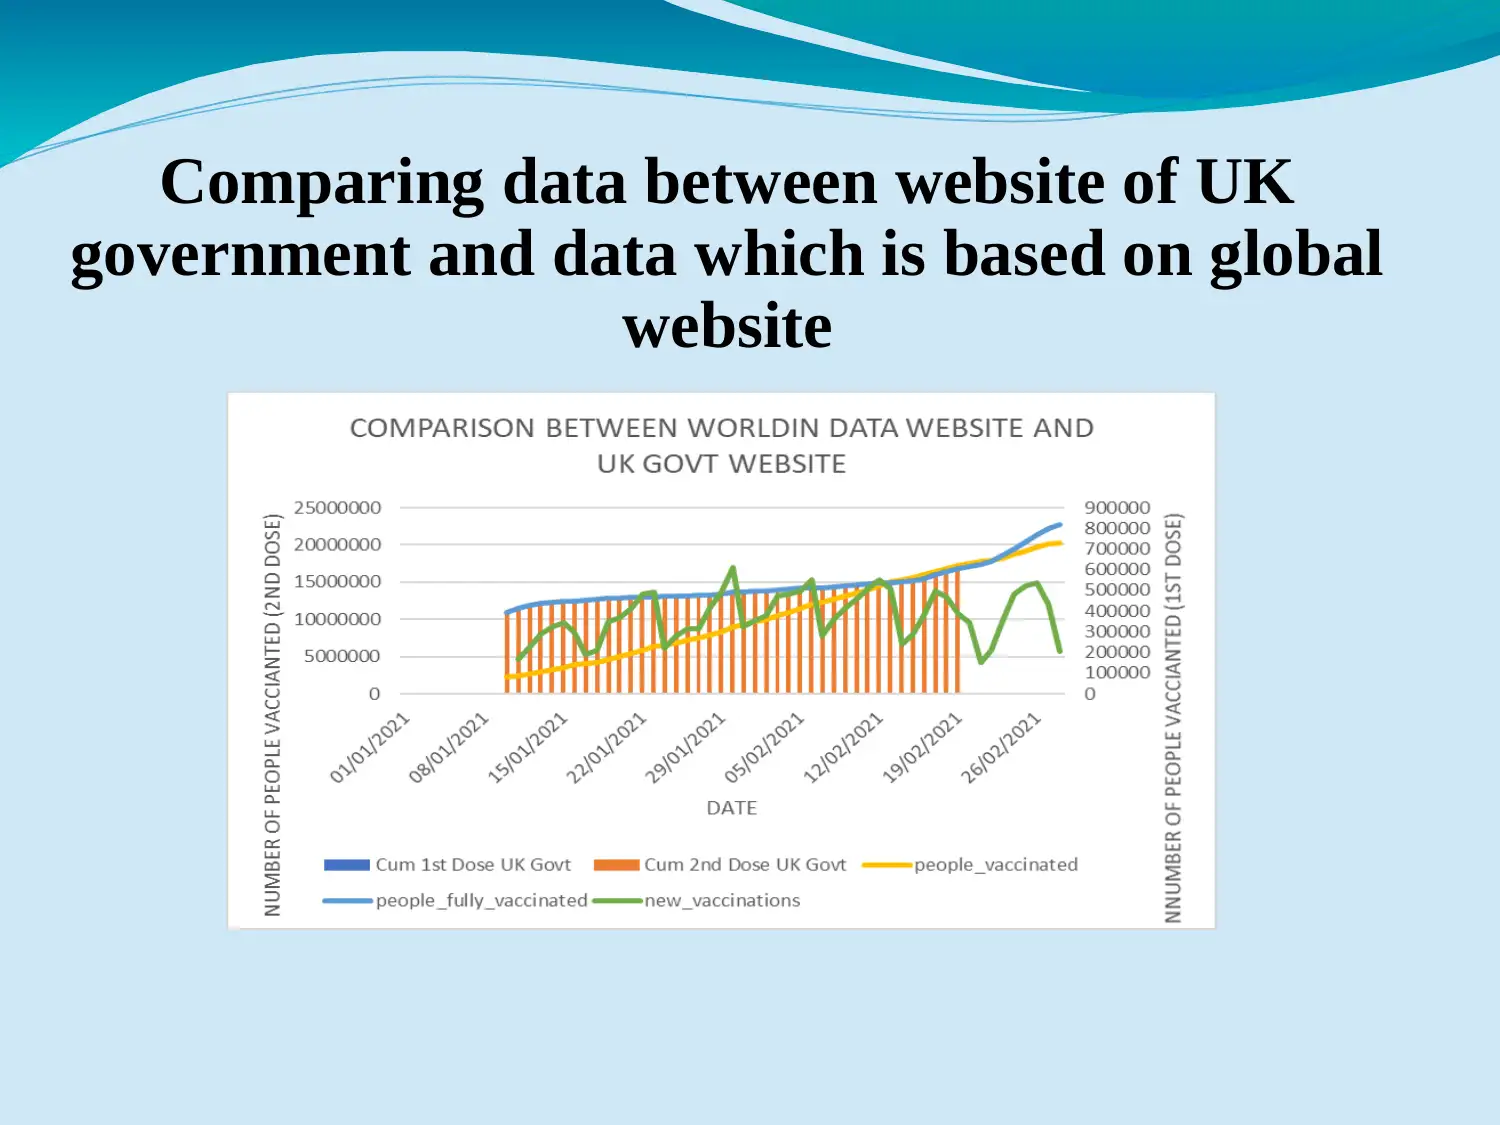
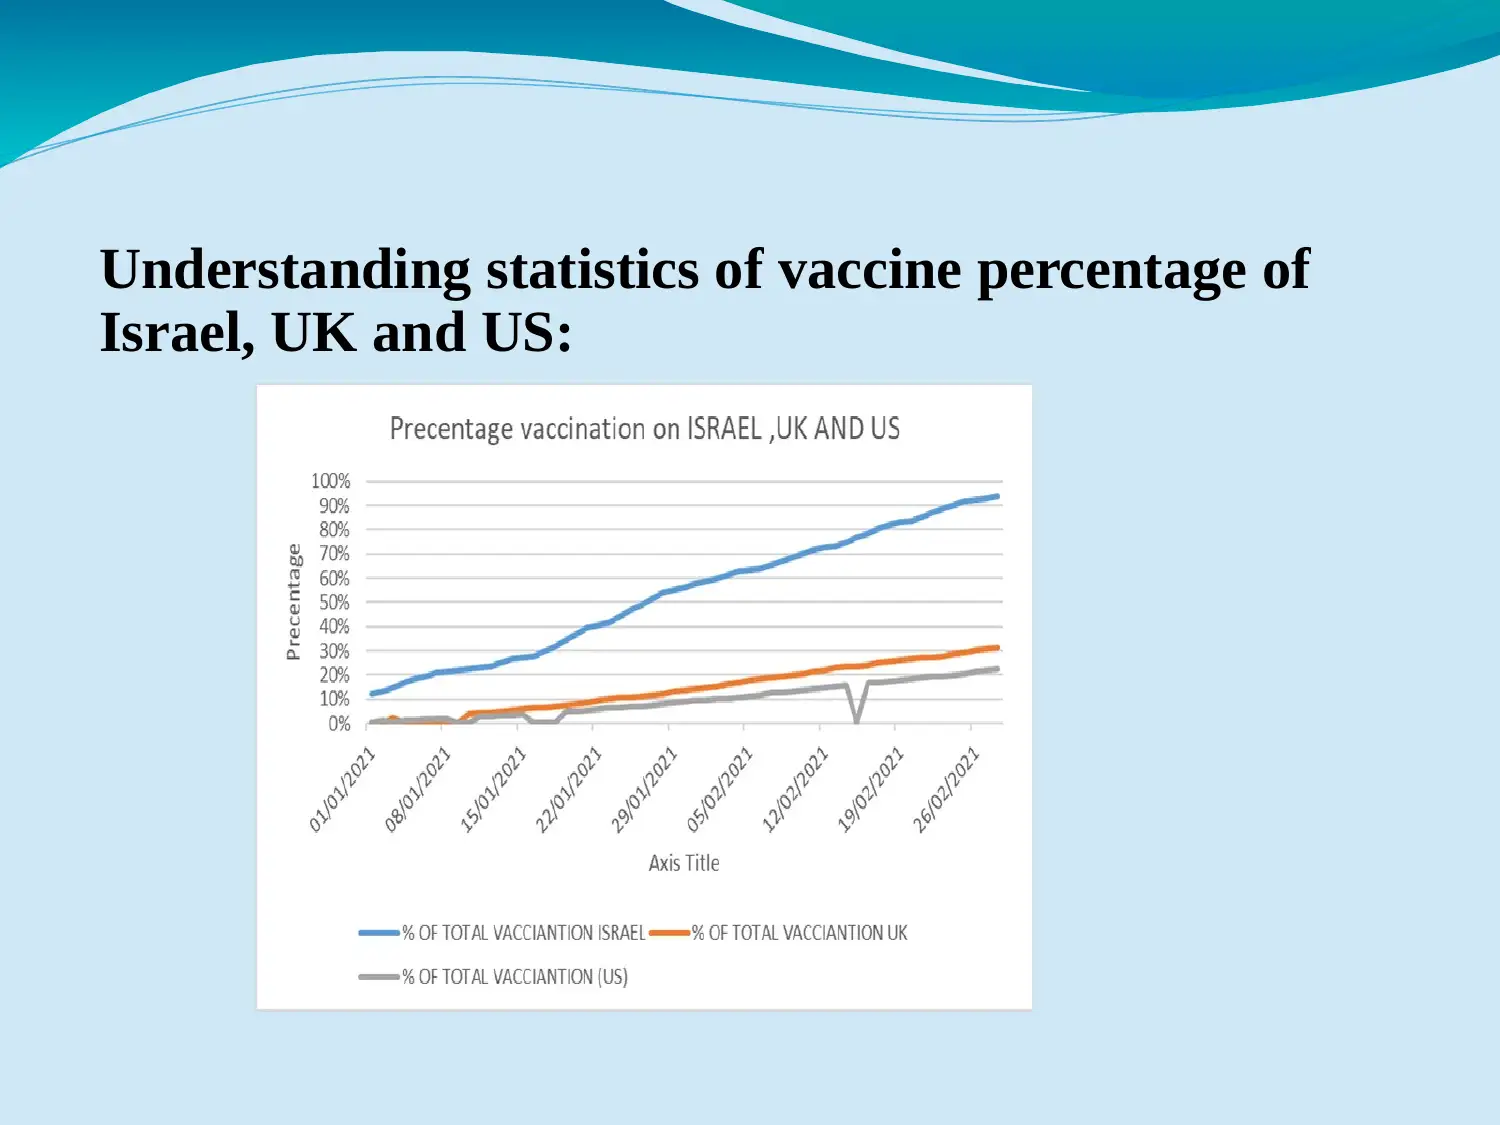
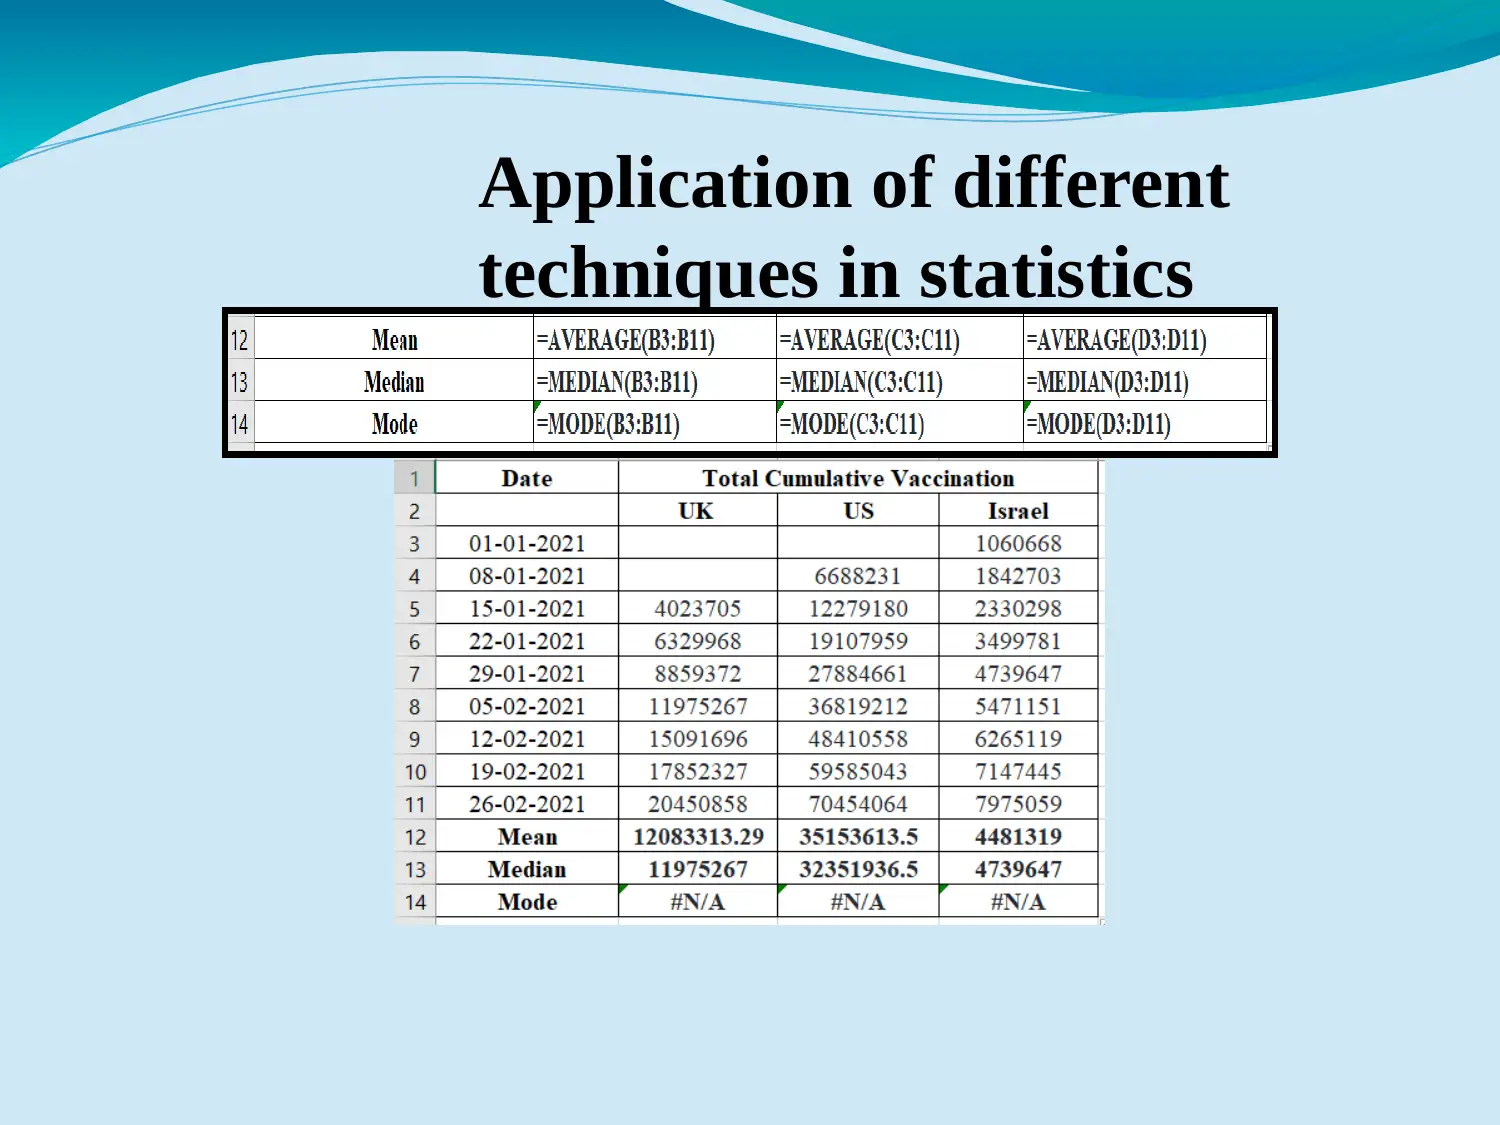
This report provides an analysis of COVID-19 vaccine data, comparing data from different sources between January 1 and February 28, 2021. It utilizes statistical techniques, data manipulation, and visual presentations to interpret the data. The report compares vaccination rates between the UK, US, and Israel, and includes a comparison of first and second vaccine doses, and the percentage of vaccinated populations. The report includes the use of charts and tables and explores the trends in vaccinated individuals. The report also explores the trends in the number of vaccinated men, and concludes with an overview of the data analysis and insights gained from the data, highlighting the application of statistical methods to understand the data.
Document Page
Title
Data Handling
tabler-icon-diamond-filled.svg

Paraphrase This Document

Need a fresh take? Get an instant paraphrase of this document with our AI Paraphraser
Document Page
Table of content
Introduction
Raw Data Presentation
Statistical Techniques
Data Manipulation
Visual Presentation
Conclusion
Document Page
INTRODUCTION:
The report helps in understanding a variety of key
features of COVID vaccine care from two different sources.
The report major feature and goal is to compare vaccination
data from January 1, 2021, to February 28, 2021, as reported
in two different reports. The vaccine data analysis for
current posts, using columns, proportion of total, statistical
tools, and Excel Auto sum features, reveals a substantial gap
Document Page
Primary Information
tabler-icon-diamond-filled.svg

Paraphrase This Document

Need a fresh take? Get an instant paraphrase of this document with our AI Paraphraser
Document Page
Comparing data between website of UK
government and data which is based on global
website
Document Page
Comparing statistics of Daily Vaccination in
Israel, UK and USA:
024681012
COMPARASION BETWEEN
UK,US AND ISRAEL
DATE
NUMBER OF PEOPLE
Document Page
Comparison between fresh vaccination of UK, US
and Israel:
tabler-icon-diamond-filled.svg

Paraphrase This Document

Need a fresh take? Get an instant paraphrase of this document with our AI Paraphraser
Document Page
Understanding statistics of vaccine percentage of
Israel, UK and US:
Document Page
Application of different
techniques in statistics
Document Page
Conclusion
Based on the above study, ratios and charts, combined with incremental trends, the overall number of
first and second vaccine subjects increased steadily. Vaccinated men have also shown the overall
trend of lining for vaccinated men both in the US and in Israel. However, a comparative Israeli group
survey reveals that with far more than 3 percent of the Israelis is the largest vaccine available.
tabler-icon-diamond-filled.svg

Paraphrase This Document

Need a fresh take? Get an instant paraphrase of this document with our AI Paraphraser
Document Page
Title
Data Handling
Document Page
References
Lester, J.N., Cho, Y. and Lochmiller, C.R., 2020. Learning
to do qualitative data analysis: A starting point. Human
Resource Development Review, 19(1), pp.94-106.
Mills, M.C., Barban, N. and Tropf, F.C., 2020. An
introduction to statistical genetic data analysis. MIT Press.
Purba, J.H.V. and Bimantara, D., 2020, May. The Influence
of Asset Management on Financial Performance, with Panel
Data Analysis. In 2nd International Seminar on Business,
Economics, Social Science and Technology (ISBEST 2019)
(pp. 150-155). Atlantis Press.
chevron_up_icon
1 out of 12
circle_padding
hide_on_mobile
zoom_out_icon
[object Object]