Financial Analysis of CQR REIT: Real Estate Equity Performance FY19
VerifiedAdded on 2022/12/05
|11
|2015
|335
Report
AI Summary
This report provides a detailed analysis of CQR REIT's financial performance in FY 2019. It highlights the significant increase in operating earnings, gross revenue, and total assets under management compared to the previous financial year. Despite these positive indicators, the report notes a decrease in statutory profit after tax and a subsequent reduction in the payout ratio to security holders. The analysis also covers the growth in the REIT's portfolio value and the number of properties held. The report concludes by recommending that the management focus on improving statutory after-tax profit to enhance returns for security holders. Desklib offers a wide range of solved assignments and past papers for students.
Running head: REAL ESTATE EQUITY
Real Estate Equity
Name of the Student:
Name of the University:
Authors Note:
Real Estate Equity
Name of the Student:
Name of the University:
Authors Note:
Paraphrase This Document
Need a fresh take? Get an instant paraphrase of this document with our AI Paraphraser
1
REAL ESTATE EQUITY
Contents
Introduction:....................................................................................................................................2
Selection of an appropriate AREIT for analysis:.............................................................................2
Review and critical analysis of recently published results of CQR REIT:......................................2
Conclusion and recommendations:..................................................................................................8
References:....................................................................................................................................10
2
REAL ESTATE EQUITY
Introduction:
A real estate investment trust (REIT) allows the investors opportunity to secure income and
experience gain from the real estate market. Investors with relatively small amount of investment
can also invest in REIT to earn significant amount of return from the real estate market in the
country. Australia has a vibrant market when it comes to REITs. Though different types of
REITs are listed in the recognized stock exchange of the country, i.e. ASX however, all REITs
specifically invest in assets from real estate market. Using the recently published report of a
specific REIT a brief discussion on its results and performance shall be provided in this
document to inform the readers about the results of such REIT in the latest financial year.
Selection of an appropriate AREIT for analysis:
There are number of REITs operating in the country however CQR, part of Charter Hall Group
has been selected for the purpose of analysis in this document. Thus, the review and critical
analysis of recently published report of Charter Hall Group’s CQR is provided in this document.
Review and critical analysis of recently published results of CQR REIT:
In order to review and critically analyze the results of CQR AREIT it would be crucial to have
the highlights of the result for the financial year 2019. The following is an extract from the
highlights published by the AREIT for the financial year 2019 (Solt and Miller, 2017).
⊘ This is a preview!⊘
Do you want full access?
Subscribe today to unlock all pages.
Trusted by 1+ million students worldwide
3
REAL ESTATE EQUITY
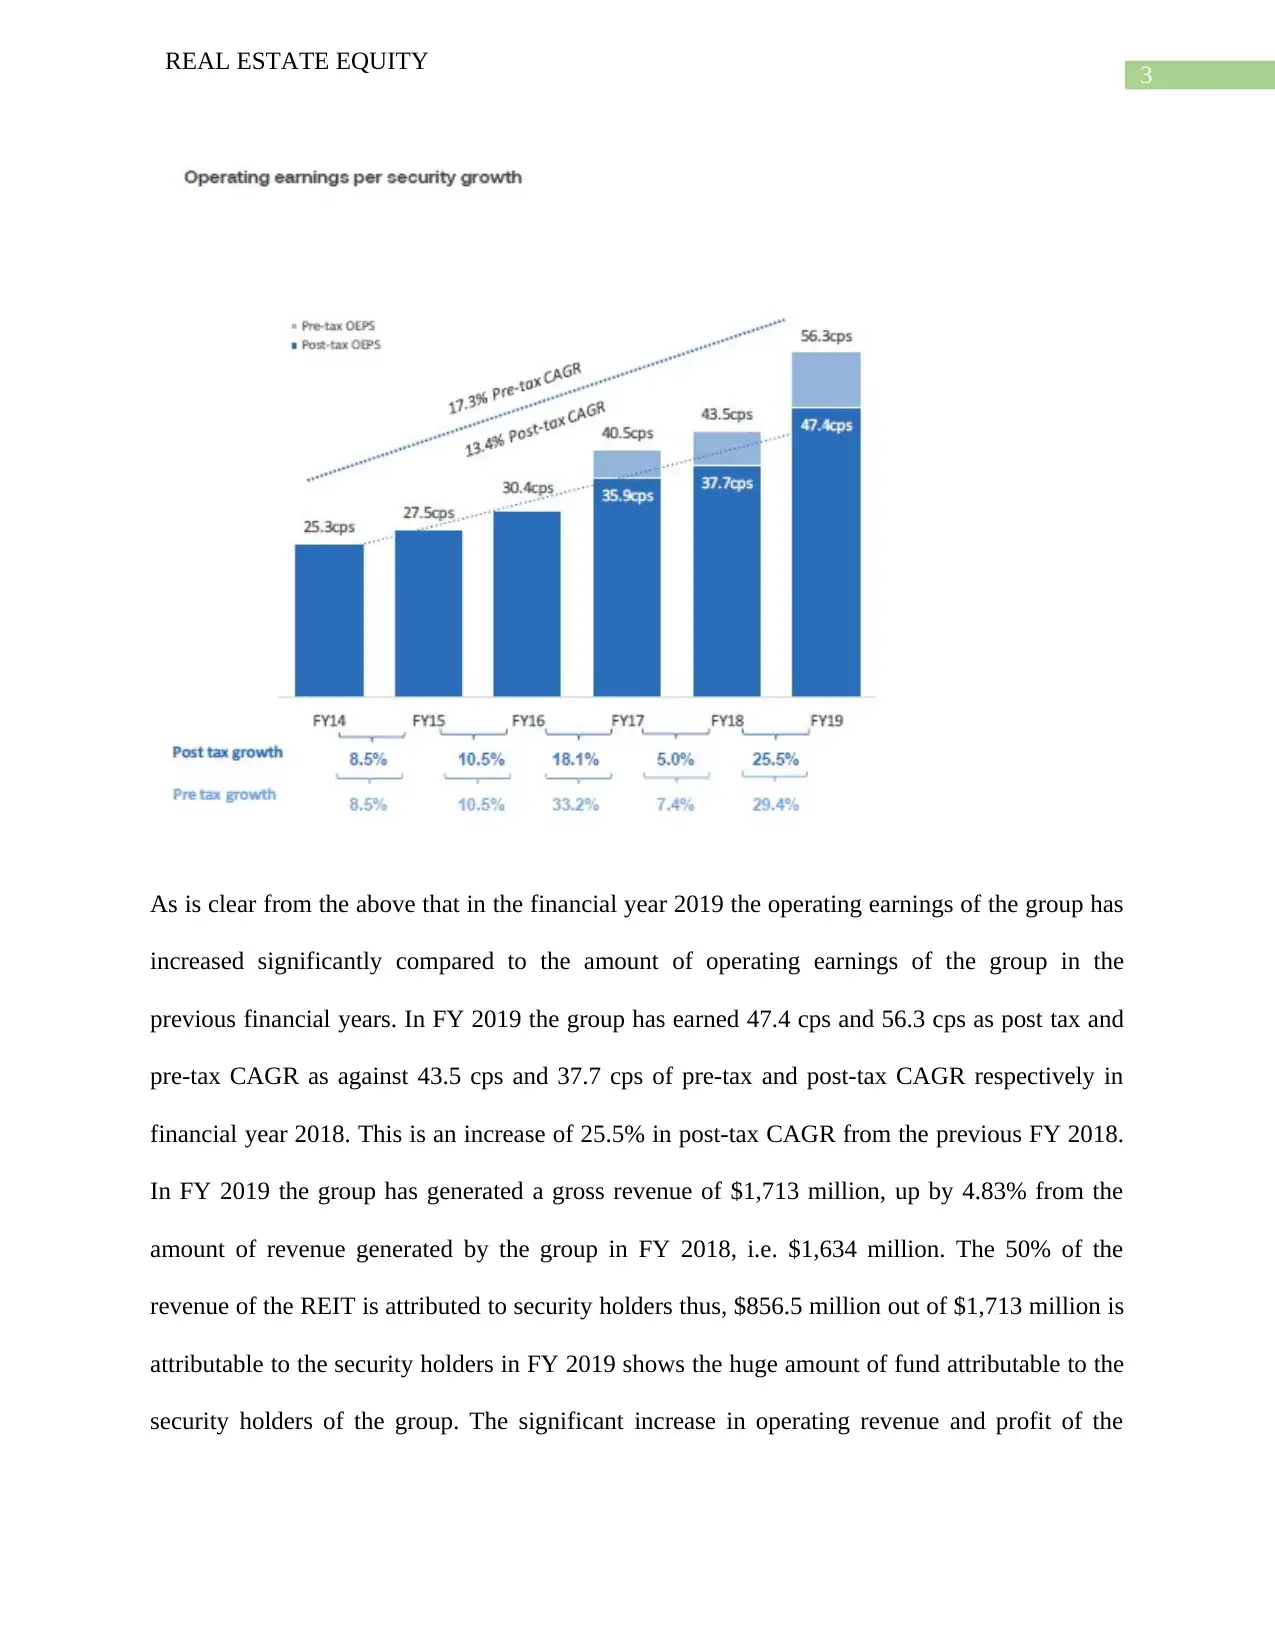
As is clear from the above that in the financial year 2019 the operating earnings of the group has
increased significantly compared to the amount of operating earnings of the group in the
previous financial years. In FY 2019 the group has earned 47.4 cps and 56.3 cps as post tax and
pre-tax CAGR as against 43.5 cps and 37.7 cps of pre-tax and post-tax CAGR respectively in
financial year 2018. This is an increase of 25.5% in post-tax CAGR from the previous FY 2018.
In FY 2019 the group has generated a gross revenue of $1,713 million, up by 4.83% from the
amount of revenue generated by the group in FY 2018, i.e. $1,634 million. The 50% of the
revenue of the REIT is attributed to security holders thus, $856.5 million out of $1,713 million is
attributable to the security holders in FY 2019 shows the huge amount of fund attributable to the
security holders of the group. The significant increase in operating revenue and profit of the
REAL ESTATE EQUITY
As is clear from the above that in the financial year 2019 the operating earnings of the group has
increased significantly compared to the amount of operating earnings of the group in the
previous financial years. In FY 2019 the group has earned 47.4 cps and 56.3 cps as post tax and
pre-tax CAGR as against 43.5 cps and 37.7 cps of pre-tax and post-tax CAGR respectively in
financial year 2018. This is an increase of 25.5% in post-tax CAGR from the previous FY 2018.
In FY 2019 the group has generated a gross revenue of $1,713 million, up by 4.83% from the
amount of revenue generated by the group in FY 2018, i.e. $1,634 million. The 50% of the
revenue of the REIT is attributed to security holders thus, $856.5 million out of $1,713 million is
attributable to the security holders in FY 2019 shows the huge amount of fund attributable to the
security holders of the group. The significant increase in operating revenue and profit of the
Paraphrase This Document
Need a fresh take? Get an instant paraphrase of this document with our AI Paraphraser
4
REAL ESTATE EQUITY
group certainly improve the profile of the REIT to attract more investors in the future (Sırma,
2019).
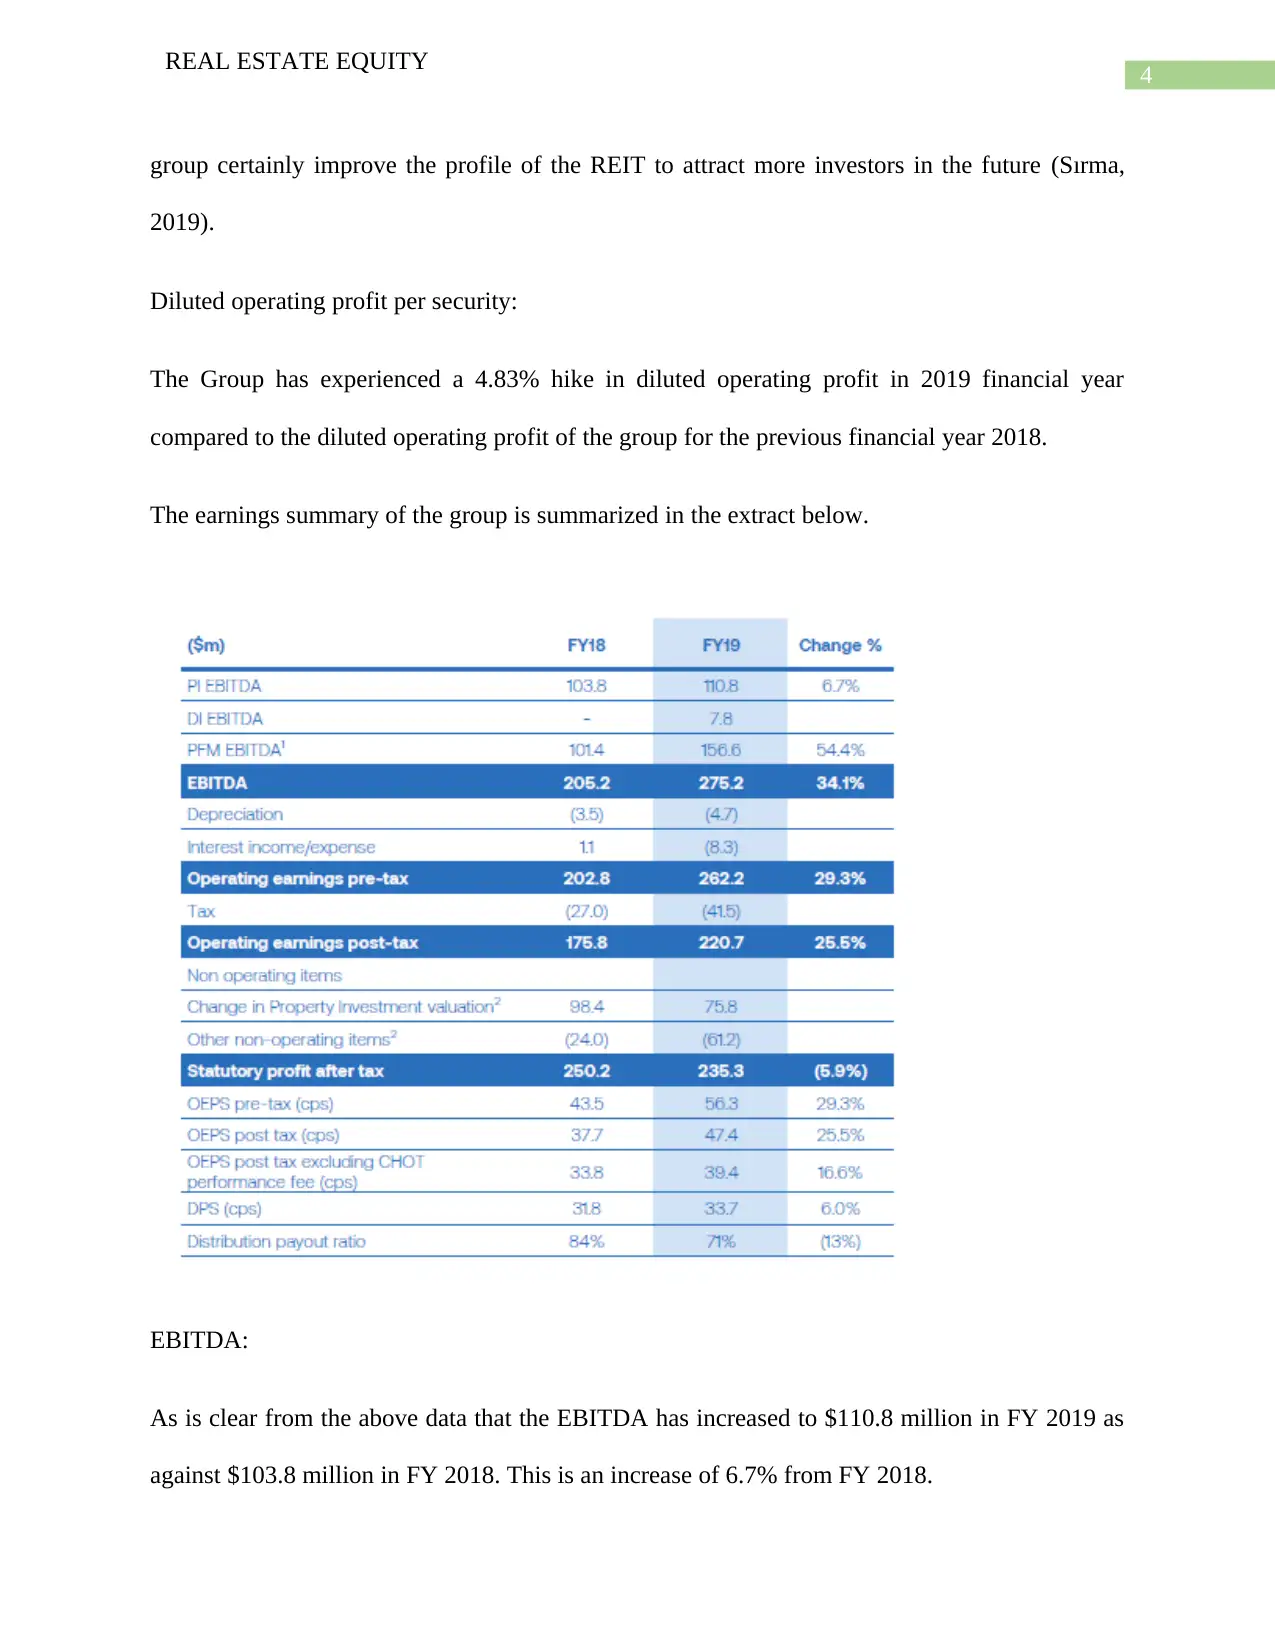
Diluted operating profit per security:
The Group has experienced a 4.83% hike in diluted operating profit in 2019 financial year
compared to the diluted operating profit of the group for the previous financial year 2018.
The earnings summary of the group is summarized in the extract below.
EBITDA:
As is clear from the above data that the EBITDA has increased to $110.8 million in FY 2019 as
against $103.8 million in FY 2018. This is an increase of 6.7% from FY 2018.
REAL ESTATE EQUITY
group certainly improve the profile of the REIT to attract more investors in the future (Sırma,
2019).
Diluted operating profit per security:
The Group has experienced a 4.83% hike in diluted operating profit in 2019 financial year
compared to the diluted operating profit of the group for the previous financial year 2018.
The earnings summary of the group is summarized in the extract below.
EBITDA:
As is clear from the above data that the EBITDA has increased to $110.8 million in FY 2019 as
against $103.8 million in FY 2018. This is an increase of 6.7% from FY 2018.
5
REAL ESTATE EQUITY
Statutory profit after tax:
However, despite the positive increase in EBITDA the statutory profit of the group for the FY
2019 is surprisingly lower than the statutory profit after tax of 2018. In FY 2019 the group has
reported a statutory profit after tax of $235.3 million whereas it was $250.2 million in FY 2018.
Both interim and final distributions made by the group in FY 2019 are lower than the
distributions made in FY 2018. In FY 2019 the group made 71% payout to the security holders
whereas in FY 2018 the group was able to pay out 84% of its earnings as interim and final
dividend. In terms of total amount the group paid $167.06 each million as interim and final
dividend in FY 2019. Interim dividend in terms of total amount decreased by 5.9% and the
security holders experienced a 4% decrease in final dividend in FY 2019 from the previous year.
An overall decrease of 13% in payout ratio has been experienced by the REIT. This is a
significant decrease considering that the REIT is already a well performing fund in the market
(Sırma, 2019).
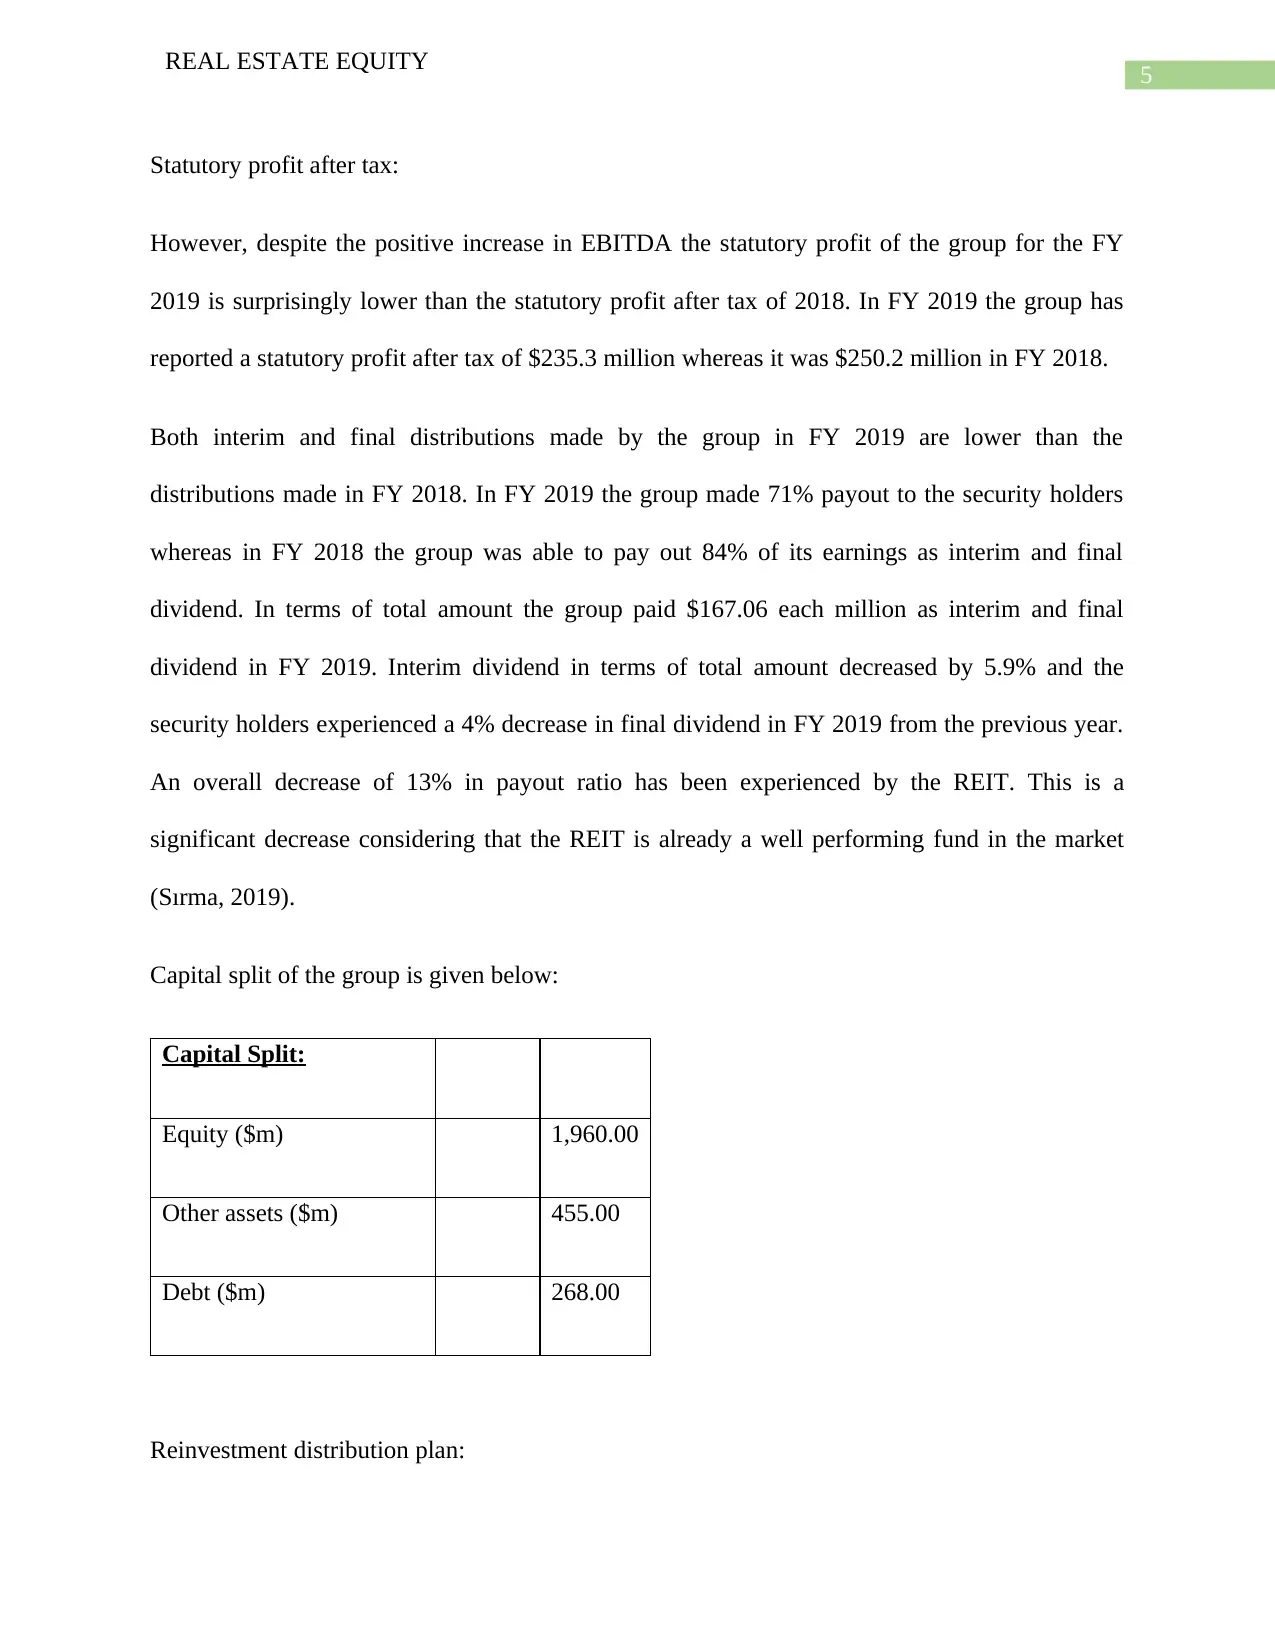
Capital split of the group is given below:
Capital Split:
Equity ($m) 1,960.00
Other assets ($m) 455.00
Debt ($m) 268.00
Reinvestment distribution plan:
REAL ESTATE EQUITY
Statutory profit after tax:
However, despite the positive increase in EBITDA the statutory profit of the group for the FY
2019 is surprisingly lower than the statutory profit after tax of 2018. In FY 2019 the group has
reported a statutory profit after tax of $235.3 million whereas it was $250.2 million in FY 2018.
Both interim and final distributions made by the group in FY 2019 are lower than the
distributions made in FY 2018. In FY 2019 the group made 71% payout to the security holders
whereas in FY 2018 the group was able to pay out 84% of its earnings as interim and final
dividend. In terms of total amount the group paid $167.06 each million as interim and final
dividend in FY 2019. Interim dividend in terms of total amount decreased by 5.9% and the
security holders experienced a 4% decrease in final dividend in FY 2019 from the previous year.
An overall decrease of 13% in payout ratio has been experienced by the REIT. This is a
significant decrease considering that the REIT is already a well performing fund in the market
(Sırma, 2019).
Capital split of the group is given below:
Capital Split:
Equity ($m) 1,960.00
Other assets ($m) 455.00
Debt ($m) 268.00
Reinvestment distribution plan:
⊘ This is a preview!⊘
Do you want full access?
Subscribe today to unlock all pages.
Trusted by 1+ million students worldwide
6
REAL ESTATE EQUITY
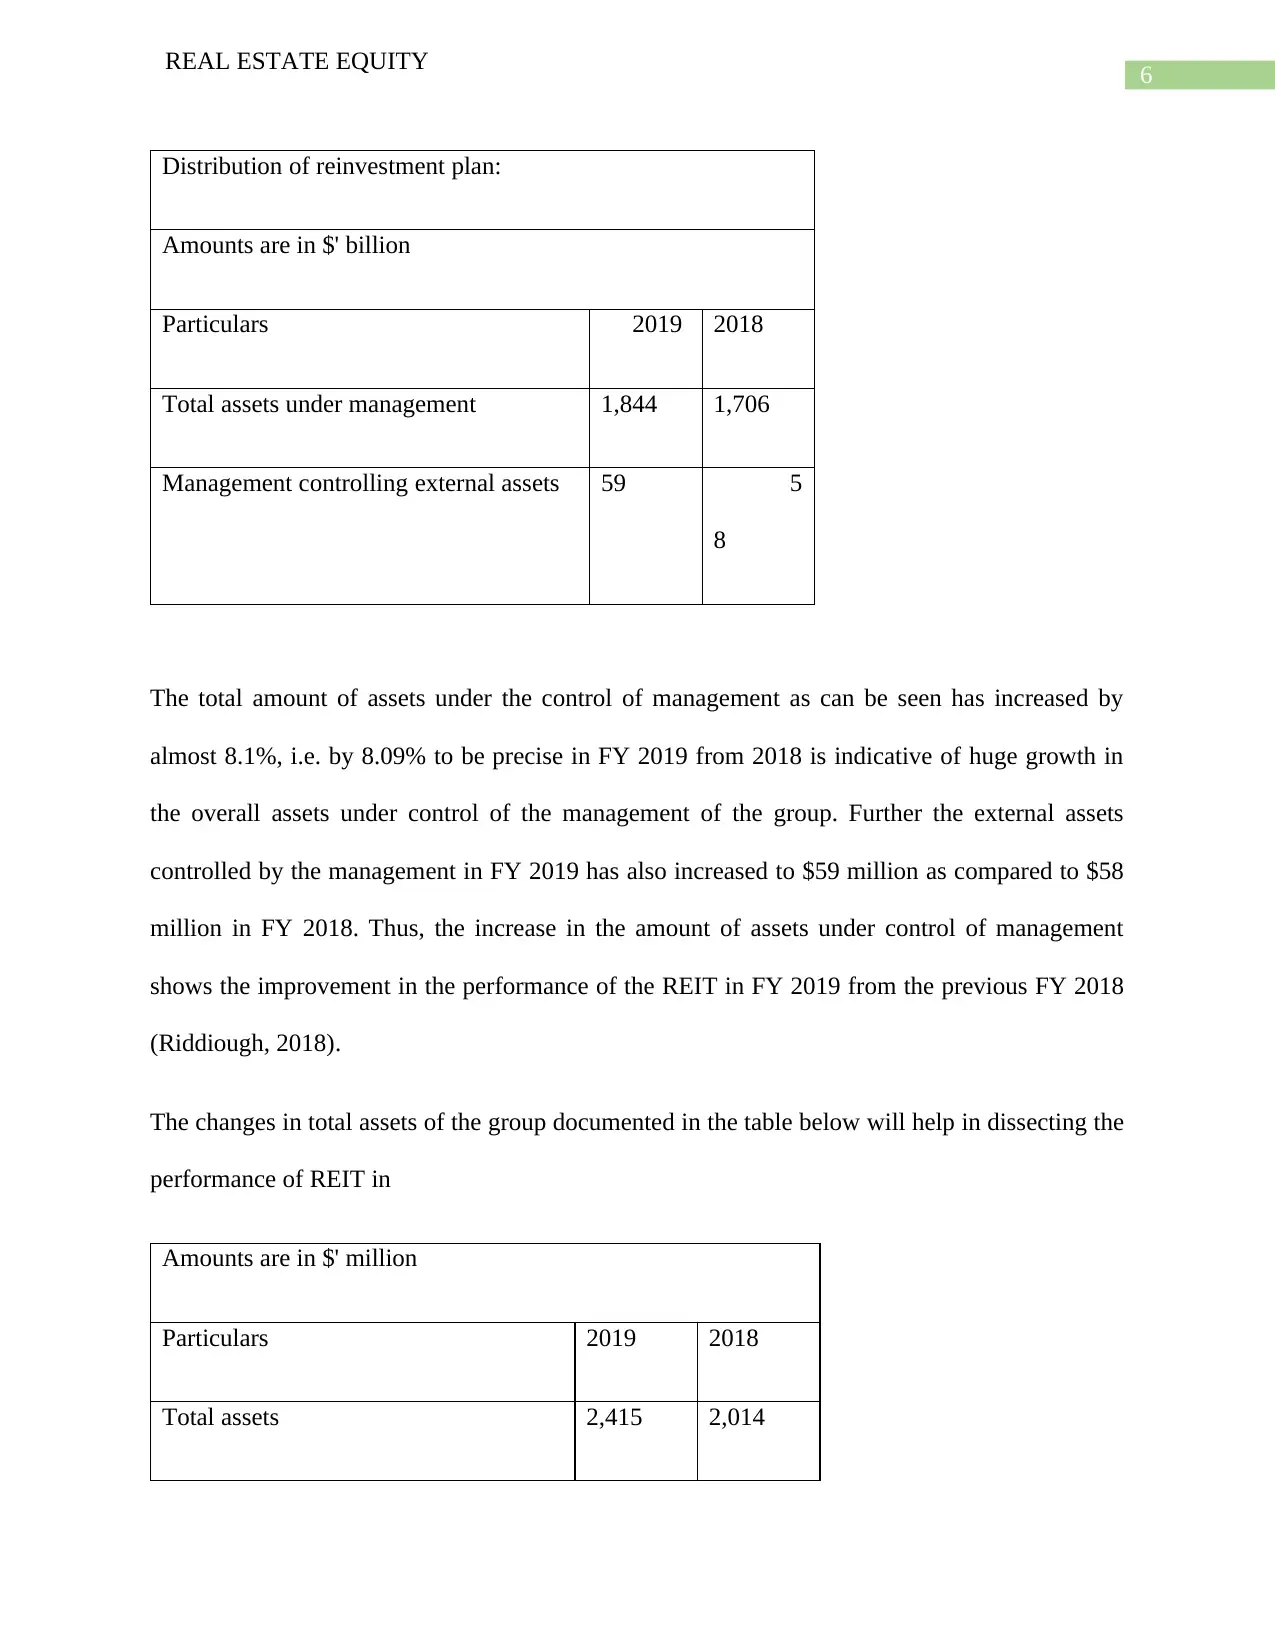
Distribution of reinvestment plan:
Amounts are in $' billion
Particulars 2019 2018
Total assets under management 1,844 1,706
Management controlling external assets 59 5
8
The total amount of assets under the control of management as can be seen has increased by
almost 8.1%, i.e. by 8.09% to be precise in FY 2019 from 2018 is indicative of huge growth in
the overall assets under control of the management of the group. Further the external assets
controlled by the management in FY 2019 has also increased to $59 million as compared to $58
million in FY 2018. Thus, the increase in the amount of assets under control of management
shows the improvement in the performance of the REIT in FY 2019 from the previous FY 2018
(Riddiough, 2018).
The changes in total assets of the group documented in the table below will help in dissecting the
performance of REIT in
Amounts are in $' million
Particulars 2019 2018
Total assets 2,415 2,014
REAL ESTATE EQUITY
Distribution of reinvestment plan:
Amounts are in $' billion
Particulars 2019 2018
Total assets under management 1,844 1,706
Management controlling external assets 59 5
8
The total amount of assets under the control of management as can be seen has increased by
almost 8.1%, i.e. by 8.09% to be precise in FY 2019 from 2018 is indicative of huge growth in
the overall assets under control of the management of the group. Further the external assets
controlled by the management in FY 2019 has also increased to $59 million as compared to $58
million in FY 2018. Thus, the increase in the amount of assets under control of management
shows the improvement in the performance of the REIT in FY 2019 from the previous FY 2018
(Riddiough, 2018).
The changes in total assets of the group documented in the table below will help in dissecting the
performance of REIT in
Amounts are in $' million
Particulars 2019 2018
Total assets 2,415 2,014
Paraphrase This Document
Need a fresh take? Get an instant paraphrase of this document with our AI Paraphraser
7
REAL ESTATE EQUITY
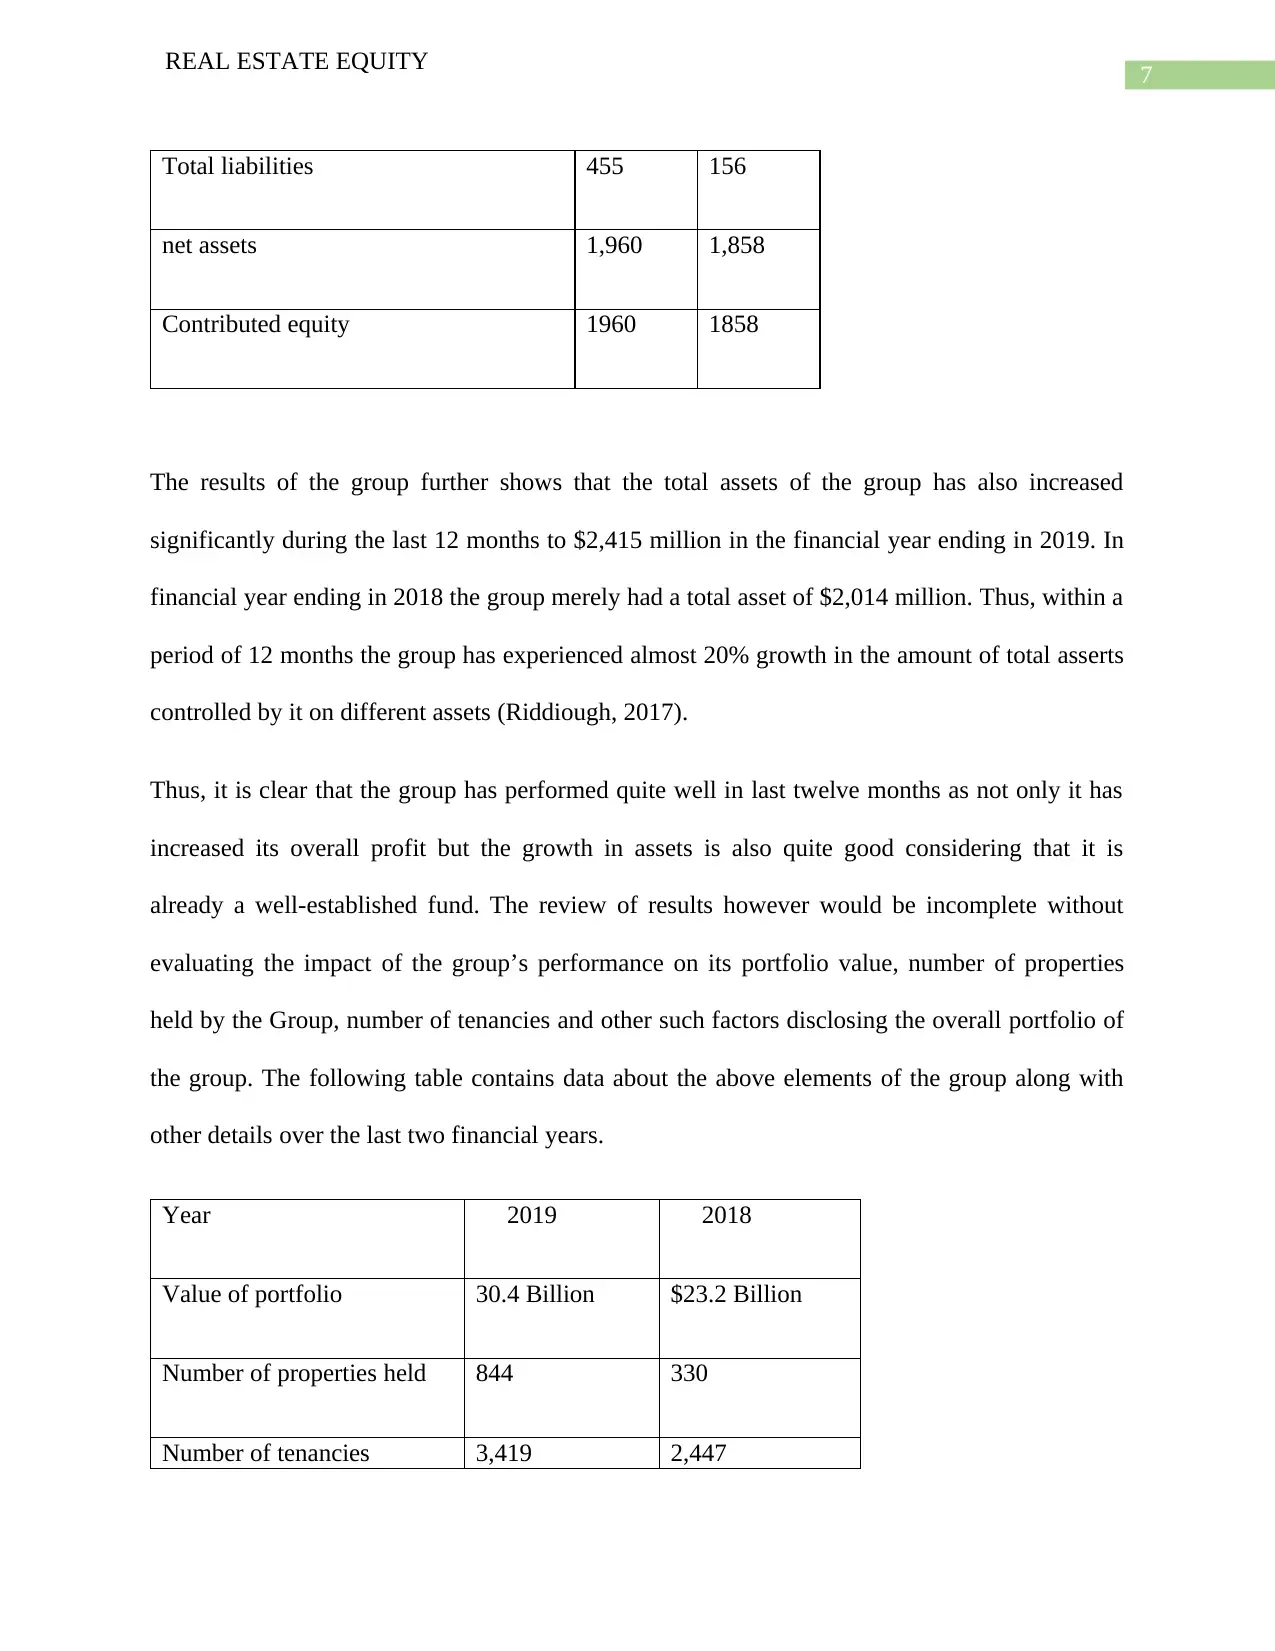
Total liabilities 455 156
net assets 1,960 1,858
Contributed equity 1960 1858
The results of the group further shows that the total assets of the group has also increased
significantly during the last 12 months to $2,415 million in the financial year ending in 2019. In
financial year ending in 2018 the group merely had a total asset of $2,014 million. Thus, within a
period of 12 months the group has experienced almost 20% growth in the amount of total asserts
controlled by it on different assets (Riddiough, 2017).
Thus, it is clear that the group has performed quite well in last twelve months as not only it has
increased its overall profit but the growth in assets is also quite good considering that it is
already a well-established fund. The review of results however would be incomplete without
evaluating the impact of the group’s performance on its portfolio value, number of properties
held by the Group, number of tenancies and other such factors disclosing the overall portfolio of
the group. The following table contains data about the above elements of the group along with
other details over the last two financial years.
Year 2019 2018
Value of portfolio 30.4 Billion $23.2 Billion
Number of properties held 844 330
Number of tenancies 3,419 2,447
REAL ESTATE EQUITY
Total liabilities 455 156
net assets 1,960 1,858
Contributed equity 1960 1858
The results of the group further shows that the total assets of the group has also increased
significantly during the last 12 months to $2,415 million in the financial year ending in 2019. In
financial year ending in 2018 the group merely had a total asset of $2,014 million. Thus, within a
period of 12 months the group has experienced almost 20% growth in the amount of total asserts
controlled by it on different assets (Riddiough, 2017).
Thus, it is clear that the group has performed quite well in last twelve months as not only it has
increased its overall profit but the growth in assets is also quite good considering that it is
already a well-established fund. The review of results however would be incomplete without
evaluating the impact of the group’s performance on its portfolio value, number of properties
held by the Group, number of tenancies and other such factors disclosing the overall portfolio of
the group. The following table contains data about the above elements of the group along with
other details over the last two financial years.
Year 2019 2018
Value of portfolio 30.4 Billion $23.2 Billion
Number of properties held 844 330
Number of tenancies 3,419 2,447
8
REAL ESTATE EQUITY
A huge increase in the portfolio value of the fund in FY 2019 is clear from the above table. In
fact the increased in portfolio value is 31.03% in 2019 financial year from the portfolio value of
$23.2 billion in FY 2018. The market capitalization of the group has naturally fuelled the growth
in portfolio value of the group. The biggest growth however, has been experienced on the
number of properties held by the group. As per the results of FY 2018 the group the merely held
330 properties in total at the end of the FY. However, by the end of FY 2019 the number of
properties hold by the company is 844. Thus, the increase is almost by 150% within a period of
12 months.
Thus, overall result of the group is certainly very encouraging for the security holders and
other stakeholders of the group. However, despite the encouraging results of the REIT it is quite
surprising that the group has failed to proportionately increase the statutory profit after tax in FY
2019 as discussed earlier. In fact whereas the group experienced decline in statutory profit after
tax in the FY 2019 as compared to FY 2018 (Kim, Pavabutr and Twite, 2017). Thus, the failure
of the increase the statutory profit after tax is an issue to be considered by the management in the
immediate future. Despite increase in almost all facets of operating performance of the group the
REIT has failed to increase its statutory profit that has further hampered its ability to distribute to
the security holders. Thus, the pay out of the group to the security holders has reduced to 71% in
2019 as compared to 84% payout ratio in 2018. Both intermix and final dividend distributed have
decreased significantly in FY 2019 (Hubbard, 2015).
⊘ This is a preview!⊘
Do you want full access?
Subscribe today to unlock all pages.
Trusted by 1+ million students worldwide
9
REAL ESTATE EQUITY
Conclusion and recommendations:
It is clear from the above discussion that the results of CQR for the FY 2019 has been quite
positive and encouraging for the security holders and others stakeholders of the group. Most of
the elements of operating performance of the group have showed significant growth in the last
twelve months in FY 2019. However, despite the encouraging results of the REIT the lack of
increase and growth operating revenue and statutory profit of the group has led to reduction in
payout ratio is certainly a concerning matter for the management.
The management should use its operating resources better and invest in properties that would
help the group to earn higher returns in the future to improve the statutory after tax profit and
subsequently the amount of dividend (Fuerst, 2015).
Paraphrase This Document
Need a fresh take? Get an instant paraphrase of this document with our AI Paraphraser
10
REAL ESTATE EQUITY
References:
Fuerst, F. (2015). The Financial Rewards of Sustainability: A Global Performance Study of Real
Estate Investment Trusts. SSRN Electronic Journal, 01(1A), pp.25-30.
Hubbard, J. (2015). The Environment and Performance of Real Estate Investment Trusts. CFA
Digest, 36(3), pp.10-11.
Kim, J., Pavabutr, P. and Twite, G. (2017). Long Run Performance of Real Estate Investment
Trusts: The Australian Experience. SSRN Electronic Journal, 3(3), pp.174-186.
Riddiough, T. (2017). Editor's Introduction: Special Issue on Real Estate Investment Trusts. Real
Estate Economics, 1(1), pp.17-22.
Riddiough, T. (2018). Editor's Introduction: Special Issue on Real Estate Investment Trusts. Real
Estate Economics, 1(1), pp.187-190.
Sırma, İ. (2019). Effect of Real Estate Investment Trusts Portfolio Structure on the Market
Performance. Alphanumeric Journal, 1(1), pp.187-199.
Sırma, İ. (2019). Effect of Real Estate Investment Trusts Portfolio Structure on the Market
Performance. Alphanumeric Journal, 1(1), pp.25-36.
Solt, M. and Miller, N. (2017). Managerial Incentives: Implications for the Financial
Performance of Real Estate Investment Trusts. Real Estate Economics, 16(6), pp.404-423.
1 out of 11
Related Documents


Your All-in-One AI-Powered Toolkit for Academic Success.
+13062052269
info@desklib.com
Available 24*7 on WhatsApp / Email
![[object Object]](/_next/static/media/star-bottom.7253800d.svg)
Unlock your academic potential
Copyright © 2020–2026 A2Z Services. All Rights Reserved. Developed and managed by ZUCOL.