Capital Budgeting Analysis: CQU Printers' Printer Investment Project
VerifiedAdded on 2020/05/16
|21
|3472
|44
Project
AI Summary
This project report analyzes a financial decision-making scenario for CQU Printers, focusing on whether to invest in new printers. The report begins with an introduction and case overview, explaining the need to replace old printers. Part A calculates initial investments, operating cash inflows, and terminal cash flows for two new printer options (Printer A and Printer B). Part B calculates relevant cash flow streams, and Part C assesses each printer using payback period, net present value (NPV), and internal rate of return (IRR). The analysis includes detailed calculations and working notes. Part D involves drawing graphs, and Part E discusses conflicting project rankings and recommendations based on the financial metrics. The report concludes with final recommendations in Part F and references. The analysis reveals that Printer B has a shorter payback period and a higher IRR compared to Printer A, suggesting it is the more financially attractive investment for CQU Printers. The report utilizes financial concepts such as capital budgeting and cash flow analysis to provide recommendations to the company.
Running Head: Finance
1
Project Report: Finance
1
Project Report: Finance
Paraphrase This Document
Need a fresh take? Get an instant paraphrase of this document with our AI Paraphraser
Finance
2
Contents
Introduction.......................................................................................................................3
Case Overview..................................................................................................................3
Part A................................................................................................................................4
Initial investment..........................................................................................................4
Operating cash inflows.................................................................................................5
Terminal cash flow.......................................................................................................7
Part B................................................................................................................................8
Relevant cash flow stream:...........................................................................................8
Part C..............................................................................................................................11
Payback period............................................................................................................11
Net present value........................................................................................................12
Internal rate of return..................................................................................................12
Past D..............................................................................................................................15
Draw the graph...........................................................................................................15
Part E..............................................................................................................................16
Conflicting ranking of projects...................................................................................16
Recommendation........................................................................................................16
Part F...............................................................................................................................17
Recommendation........................................................................................................17
References.......................................................................................................................18
Finance
3
Introduction:
In the given case, a company, CQU printers is looking to make few changes into its
operations and the printers to enhance the production and to reduce the cost. This case
explains that the few changes have taken place in the market and for competing with these
factors; it is required for the company to replace the old printers with new one. New manager
of the company has suggested to the management of the company to evaluate the old printers
and two new printers and evaluate that which new printer would be best for the company and
which printer would offer high return and high internal rate of return to the company. For
evaluating both the printers and their outcome in the company, capital budgeting techniques
have been evaluated and it has been found that how much return could be got by the
company.
Case Overview:
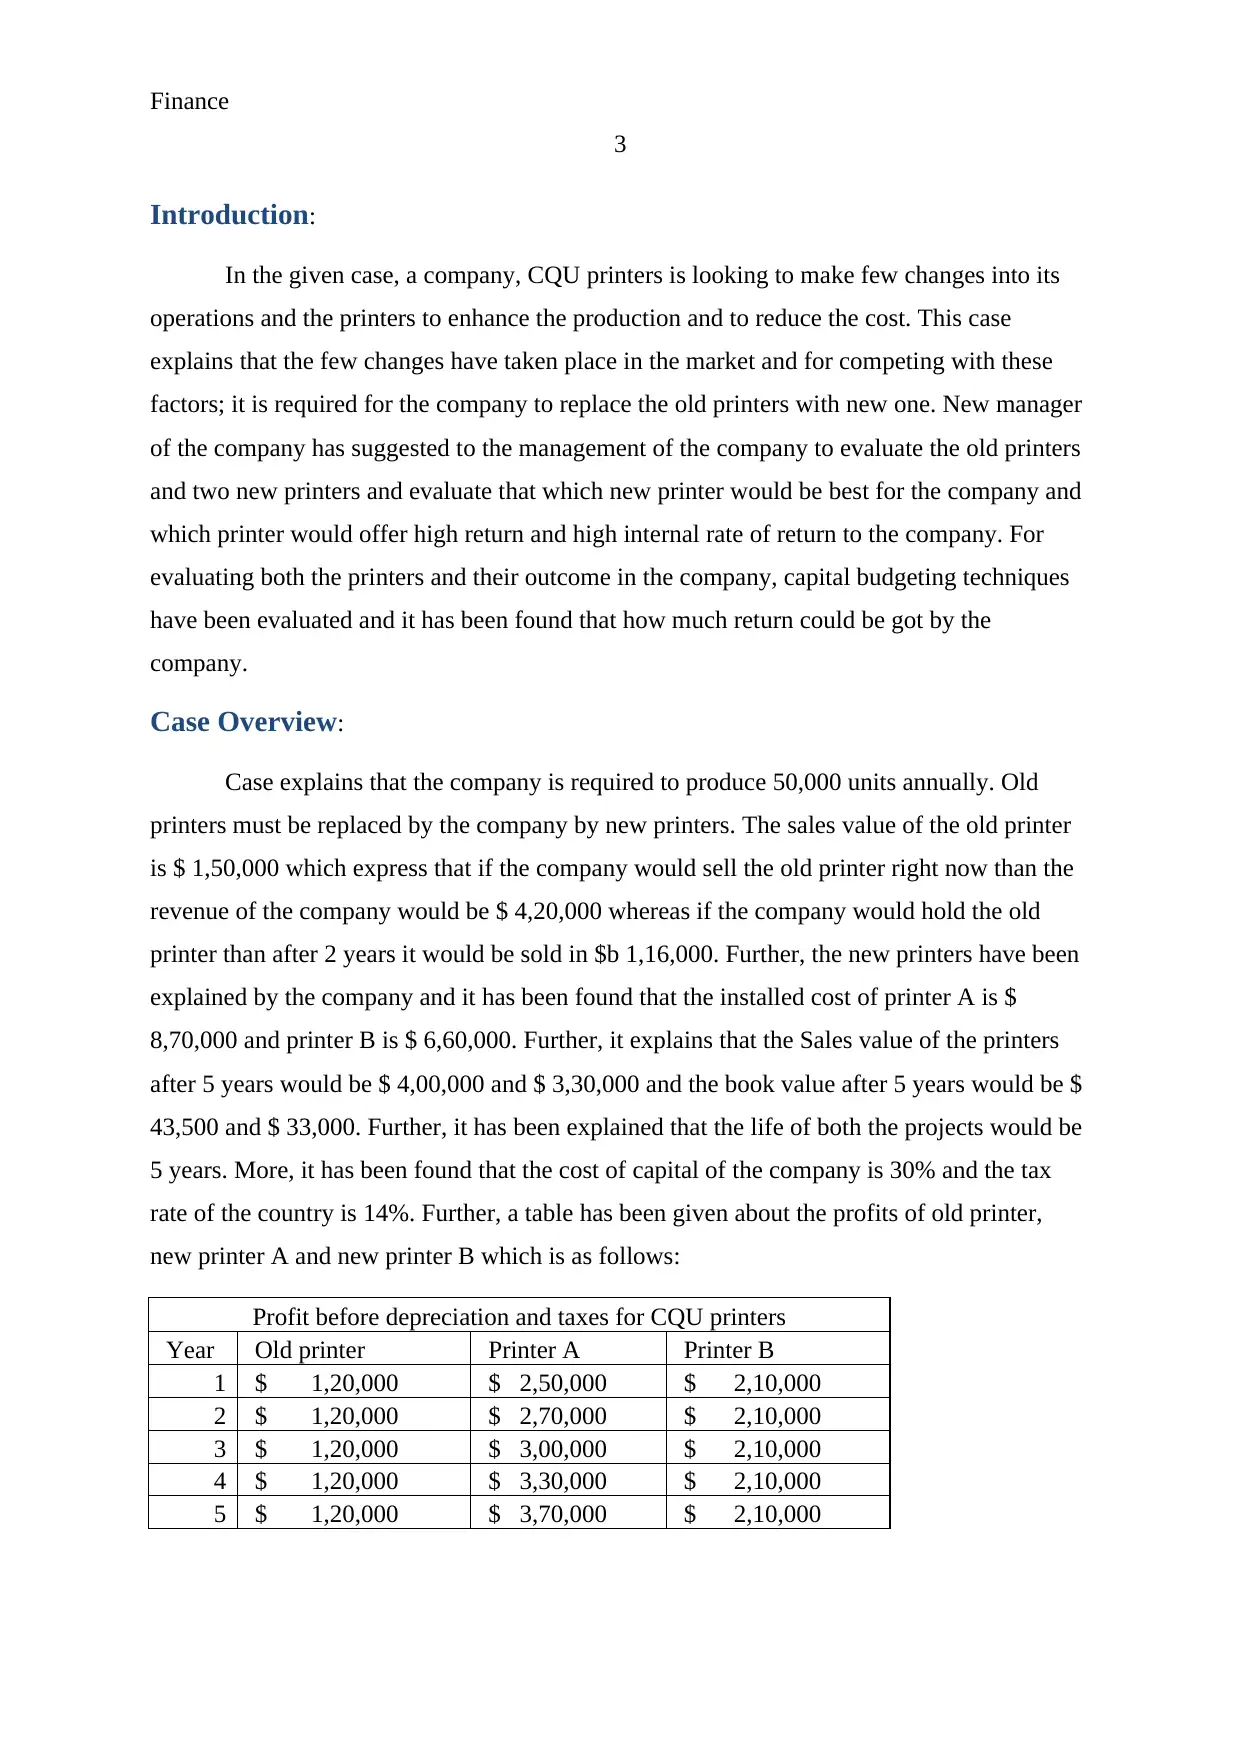
Case explains that the company is required to produce 50,000 units annually. Old
printers must be replaced by the company by new printers. The sales value of the old printer
is $ 1,50,000 which express that if the company would sell the old printer right now than the
revenue of the company would be $ 4,20,000 whereas if the company would hold the old
printer than after 2 years it would be sold in $b 1,16,000. Further, the new printers have been
explained by the company and it has been found that the installed cost of printer A is $
8,70,000 and printer B is $ 6,60,000. Further, it explains that the Sales value of the printers
after 5 years would be $ 4,00,000 and $ 3,30,000 and the book value after 5 years would be $
43,500 and $ 33,000. Further, it has been explained that the life of both the projects would be
5 years. More, it has been found that the cost of capital of the company is 30% and the tax
rate of the country is 14%. Further, a table has been given about the profits of old printer,
new printer A and new printer B which is as follows:
Profit before depreciation and taxes for CQU printers
Year Old printer Printer A Printer B
1 $ 1,20,000 $ 2,50,000 $ 2,10,000
2 $ 1,20,000 $ 2,70,000 $ 2,10,000
3 $ 1,20,000 $ 3,00,000 $ 2,10,000
4 $ 1,20,000 $ 3,30,000 $ 2,10,000
5 $ 1,20,000 $ 3,70,000 $ 2,10,000
3
Introduction:
In the given case, a company, CQU printers is looking to make few changes into its
operations and the printers to enhance the production and to reduce the cost. This case
explains that the few changes have taken place in the market and for competing with these
factors; it is required for the company to replace the old printers with new one. New manager
of the company has suggested to the management of the company to evaluate the old printers
and two new printers and evaluate that which new printer would be best for the company and
which printer would offer high return and high internal rate of return to the company. For
evaluating both the printers and their outcome in the company, capital budgeting techniques
have been evaluated and it has been found that how much return could be got by the
company.
Case Overview:
Case explains that the company is required to produce 50,000 units annually. Old
printers must be replaced by the company by new printers. The sales value of the old printer
is $ 1,50,000 which express that if the company would sell the old printer right now than the
revenue of the company would be $ 4,20,000 whereas if the company would hold the old
printer than after 2 years it would be sold in $b 1,16,000. Further, the new printers have been
explained by the company and it has been found that the installed cost of printer A is $
8,70,000 and printer B is $ 6,60,000. Further, it explains that the Sales value of the printers
after 5 years would be $ 4,00,000 and $ 3,30,000 and the book value after 5 years would be $
43,500 and $ 33,000. Further, it has been explained that the life of both the projects would be
5 years. More, it has been found that the cost of capital of the company is 30% and the tax
rate of the country is 14%. Further, a table has been given about the profits of old printer,
new printer A and new printer B which is as follows:
Profit before depreciation and taxes for CQU printers
Year Old printer Printer A Printer B
1 $ 1,20,000 $ 2,50,000 $ 2,10,000
2 $ 1,20,000 $ 2,70,000 $ 2,10,000
3 $ 1,20,000 $ 3,00,000 $ 2,10,000
4 $ 1,20,000 $ 3,30,000 $ 2,10,000
5 $ 1,20,000 $ 3,70,000 $ 2,10,000
⊘ This is a preview!⊘
Do you want full access?
Subscribe today to unlock all pages.
Trusted by 1+ million students worldwide
Finance
4
Part A:
It is required for the company to evaluate the installed cost, total cash flows and
terminal cash flows of the project before investing into the project. It assists the company to
evaluate that which project is best and how much cash inflow would be got by the company
from a particular project after a particular time period (Chittenden & Derregia, 2015).
Following is the study of Initial investment, cash flows and terminal cash flows after 5 years
of both the projects:
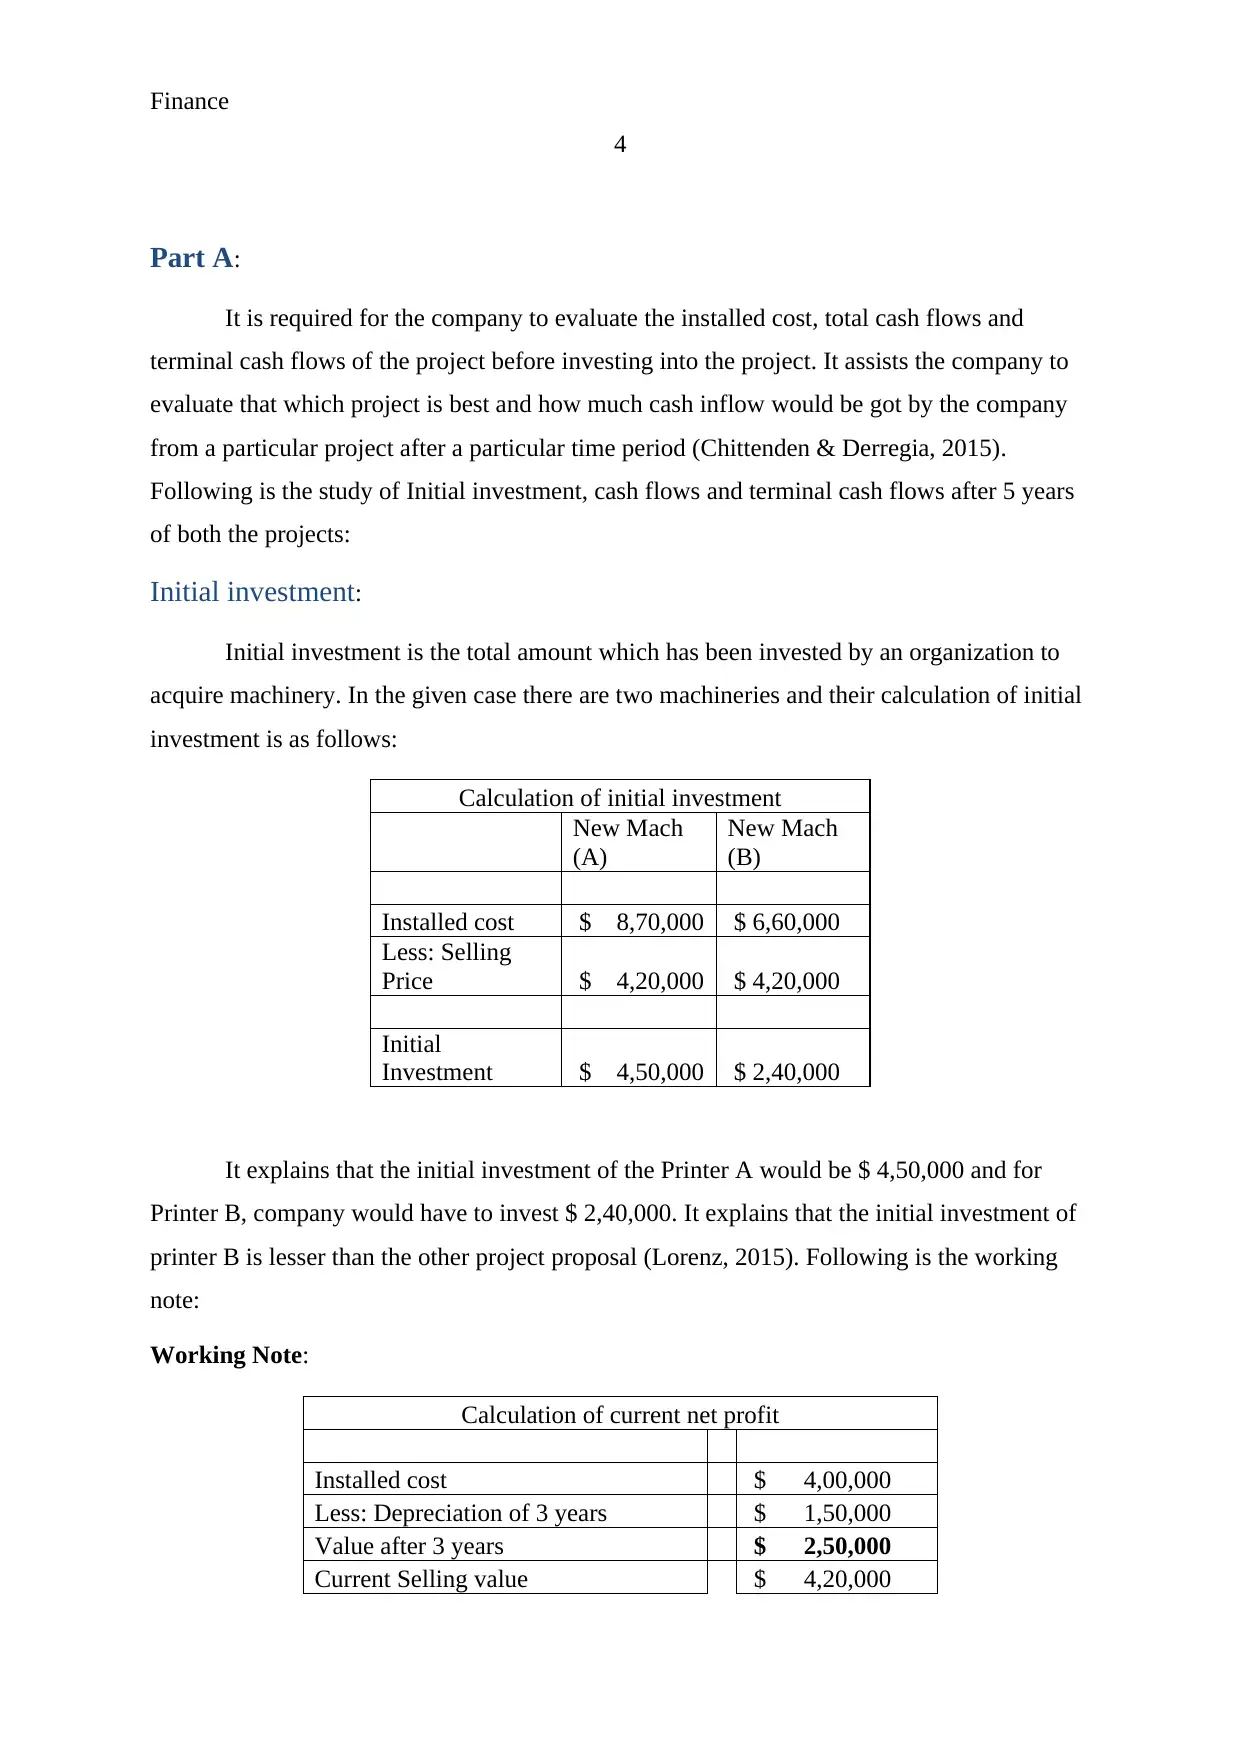
Initial investment:
Initial investment is the total amount which has been invested by an organization to
acquire machinery. In the given case there are two machineries and their calculation of initial
investment is as follows:
Calculation of initial investment
New Mach
(A)
New Mach
(B)
Installed cost $ 8,70,000 $ 6,60,000
Less: Selling
Price $ 4,20,000 $ 4,20,000
Initial
Investment $ 4,50,000 $ 2,40,000
It explains that the initial investment of the Printer A would be $ 4,50,000 and for
Printer B, company would have to invest $ 2,40,000. It explains that the initial investment of
printer B is lesser than the other project proposal (Lorenz, 2015). Following is the working
note:
Working Note:
Calculation of current net profit
Installed cost $ 4,00,000
Less: Depreciation of 3 years $ 1,50,000
Value after 3 years $ 2,50,000
Current Selling value $ 4,20,000
4
Part A:
It is required for the company to evaluate the installed cost, total cash flows and
terminal cash flows of the project before investing into the project. It assists the company to
evaluate that which project is best and how much cash inflow would be got by the company
from a particular project after a particular time period (Chittenden & Derregia, 2015).
Following is the study of Initial investment, cash flows and terminal cash flows after 5 years
of both the projects:
Initial investment:
Initial investment is the total amount which has been invested by an organization to
acquire machinery. In the given case there are two machineries and their calculation of initial
investment is as follows:
Calculation of initial investment
New Mach
(A)
New Mach
(B)
Installed cost $ 8,70,000 $ 6,60,000
Less: Selling
Price $ 4,20,000 $ 4,20,000
Initial
Investment $ 4,50,000 $ 2,40,000
It explains that the initial investment of the Printer A would be $ 4,50,000 and for
Printer B, company would have to invest $ 2,40,000. It explains that the initial investment of
printer B is lesser than the other project proposal (Lorenz, 2015). Following is the working
note:
Working Note:
Calculation of current net profit
Installed cost $ 4,00,000
Less: Depreciation of 3 years $ 1,50,000
Value after 3 years $ 2,50,000
Current Selling value $ 4,20,000
Paraphrase This Document
Need a fresh take? Get an instant paraphrase of this document with our AI Paraphraser
Finance
5
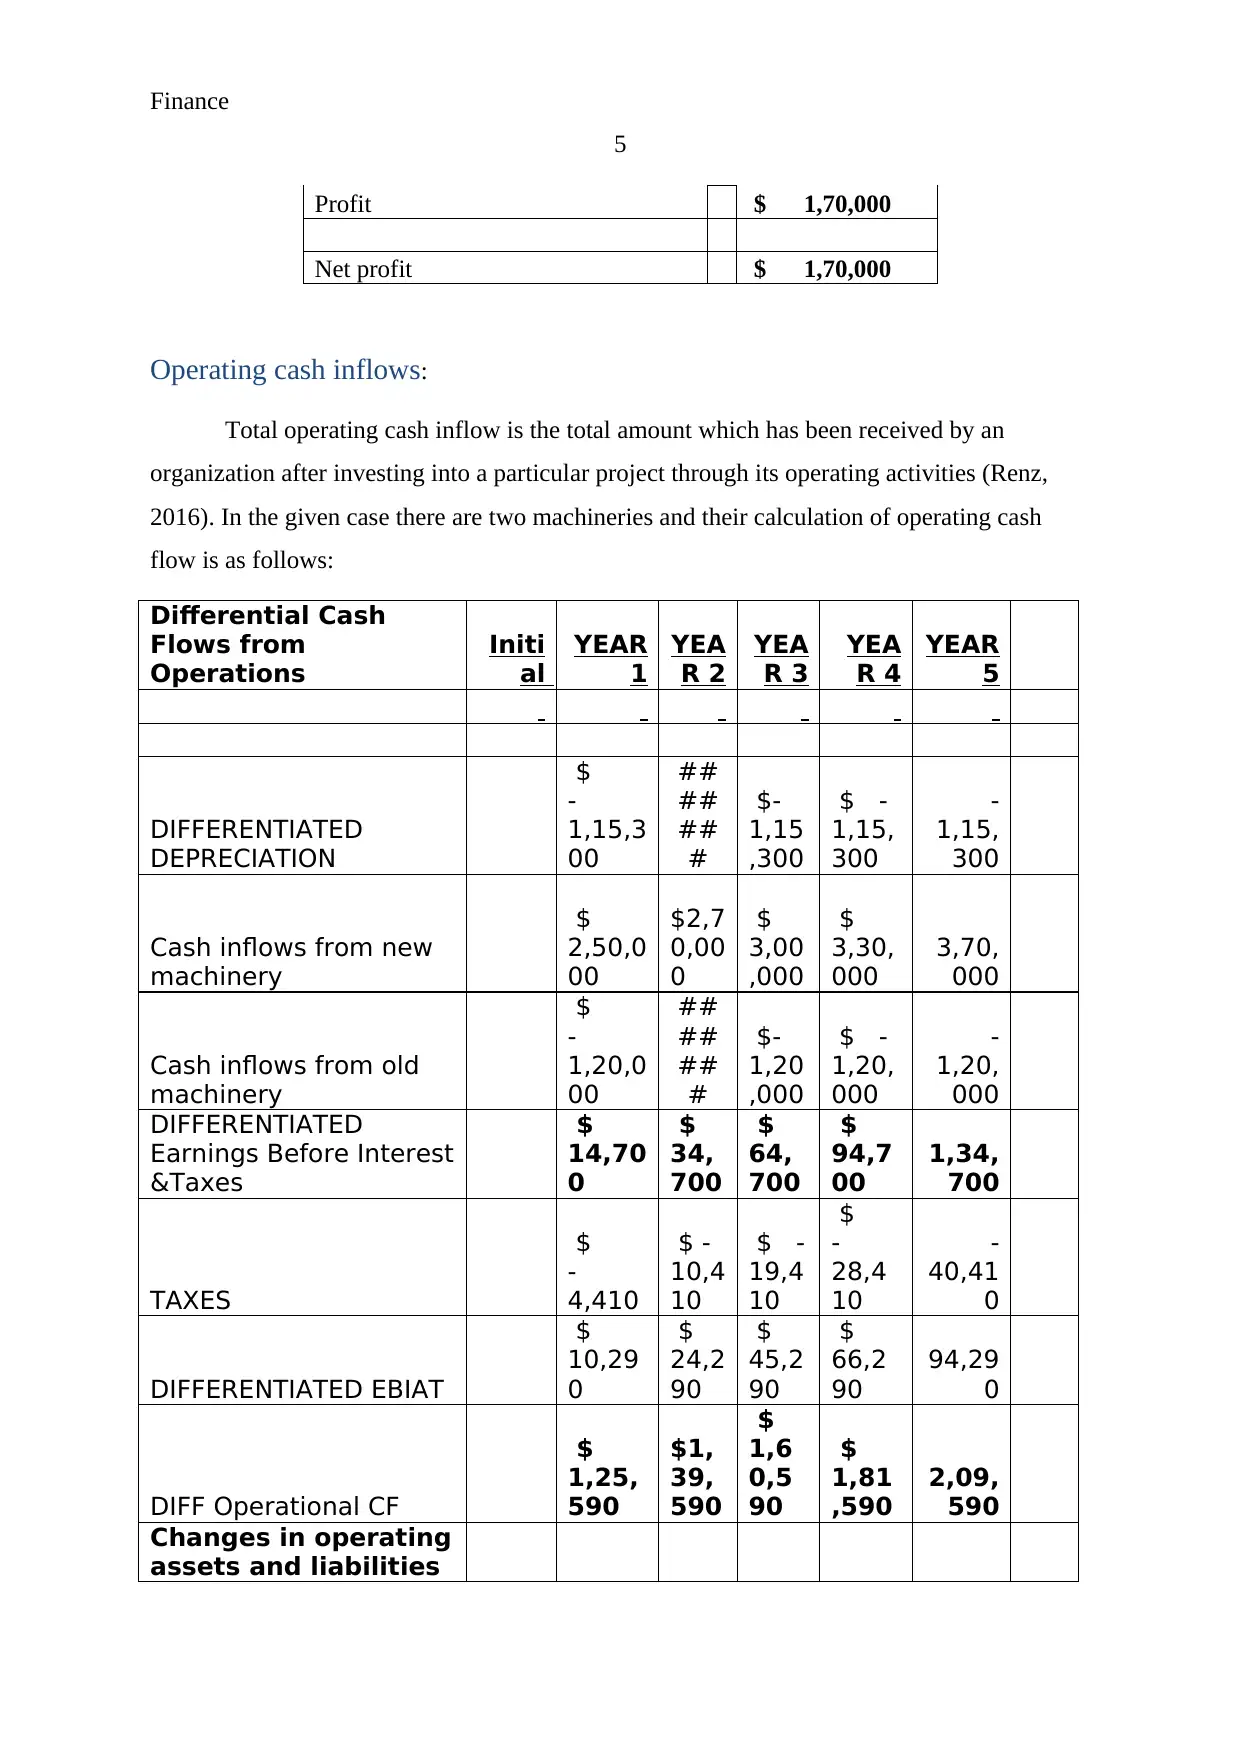
Profit $ 1,70,000
Net profit $ 1,70,000
Operating cash inflows:
Total operating cash inflow is the total amount which has been received by an
organization after investing into a particular project through its operating activities (Renz,
2016). In the given case there are two machineries and their calculation of operating cash
flow is as follows:
Differential Cash
Flows from
Operations
Initi
al
YEAR
1
YEA
R 2
YEA
R 3
YEA
R 4
YEAR
5
DIFFERENTIATED
DEPRECIATION
$
-
1,15,3
00
##
##
##
#
$-
1,15
,300
$ -
1,15,
300
-
1,15,
300
Cash inflows from new
machinery
$
2,50,0
00
$2,7
0,00
0
$
3,00
,000
$
3,30,
000
3,70,
000
Cash inflows from old
machinery
$
-
1,20,0
00
##
##
##
#
$-
1,20
,000
$ -
1,20,
000
-
1,20,
000
DIFFERENTIATED
Earnings Before Interest
&Taxes
$
14,70
0
$
34,
700
$
64,
700
$
94,7
00
1,34,
700
TAXES
$
-
4,410
$ -
10,4
10
$ -
19,4
10
$
-
28,4
10
-
40,41
0
DIFFERENTIATED EBIAT
$
10,29
0
$
24,2
90
$
45,2
90
$
66,2
90
94,29
0
DIFF Operational CF
$
1,25,
590
$1,
39,
590
$
1,6
0,5
90
$
1,81
,590
2,09,
590
Changes in operating
assets and liabilities
5
Profit $ 1,70,000
Net profit $ 1,70,000
Operating cash inflows:
Total operating cash inflow is the total amount which has been received by an
organization after investing into a particular project through its operating activities (Renz,
2016). In the given case there are two machineries and their calculation of operating cash
flow is as follows:
Differential Cash
Flows from
Operations
Initi
al
YEAR
1
YEA
R 2
YEA
R 3
YEA
R 4
YEAR
5
DIFFERENTIATED
DEPRECIATION
$
-
1,15,3
00
##
##
##
#
$-
1,15
,300
$ -
1,15,
300
-
1,15,
300
Cash inflows from new
machinery
$
2,50,0
00
$2,7
0,00
0
$
3,00
,000
$
3,30,
000
3,70,
000
Cash inflows from old
machinery
$
-
1,20,0
00
##
##
##
#
$-
1,20
,000
$ -
1,20,
000
-
1,20,
000
DIFFERENTIATED
Earnings Before Interest
&Taxes
$
14,70
0
$
34,
700
$
64,
700
$
94,7
00
1,34,
700
TAXES
$
-
4,410
$ -
10,4
10
$ -
19,4
10
$
-
28,4
10
-
40,41
0
DIFFERENTIATED EBIAT
$
10,29
0
$
24,2
90
$
45,2
90
$
66,2
90
94,29
0
DIFF Operational CF
$
1,25,
590
$1,
39,
590
$
1,6
0,5
90
$
1,81
,590
2,09,
590
Changes in operating
assets and liabilities
Finance
6
Changes in cash
$
-
25,4
00
Changes in Accounts
Receivable
$ -
1,20,
000
Inventories
$
20,0
00
Changes in Accounts
Payable
$
35,0
00
$ -
90,40
0
$
1,25,
590
$1,
39,
590
$
1,6
0,5
90
$
1,81
,590
$
2,09,
590
Total Operational Cash flows
7,26
,550
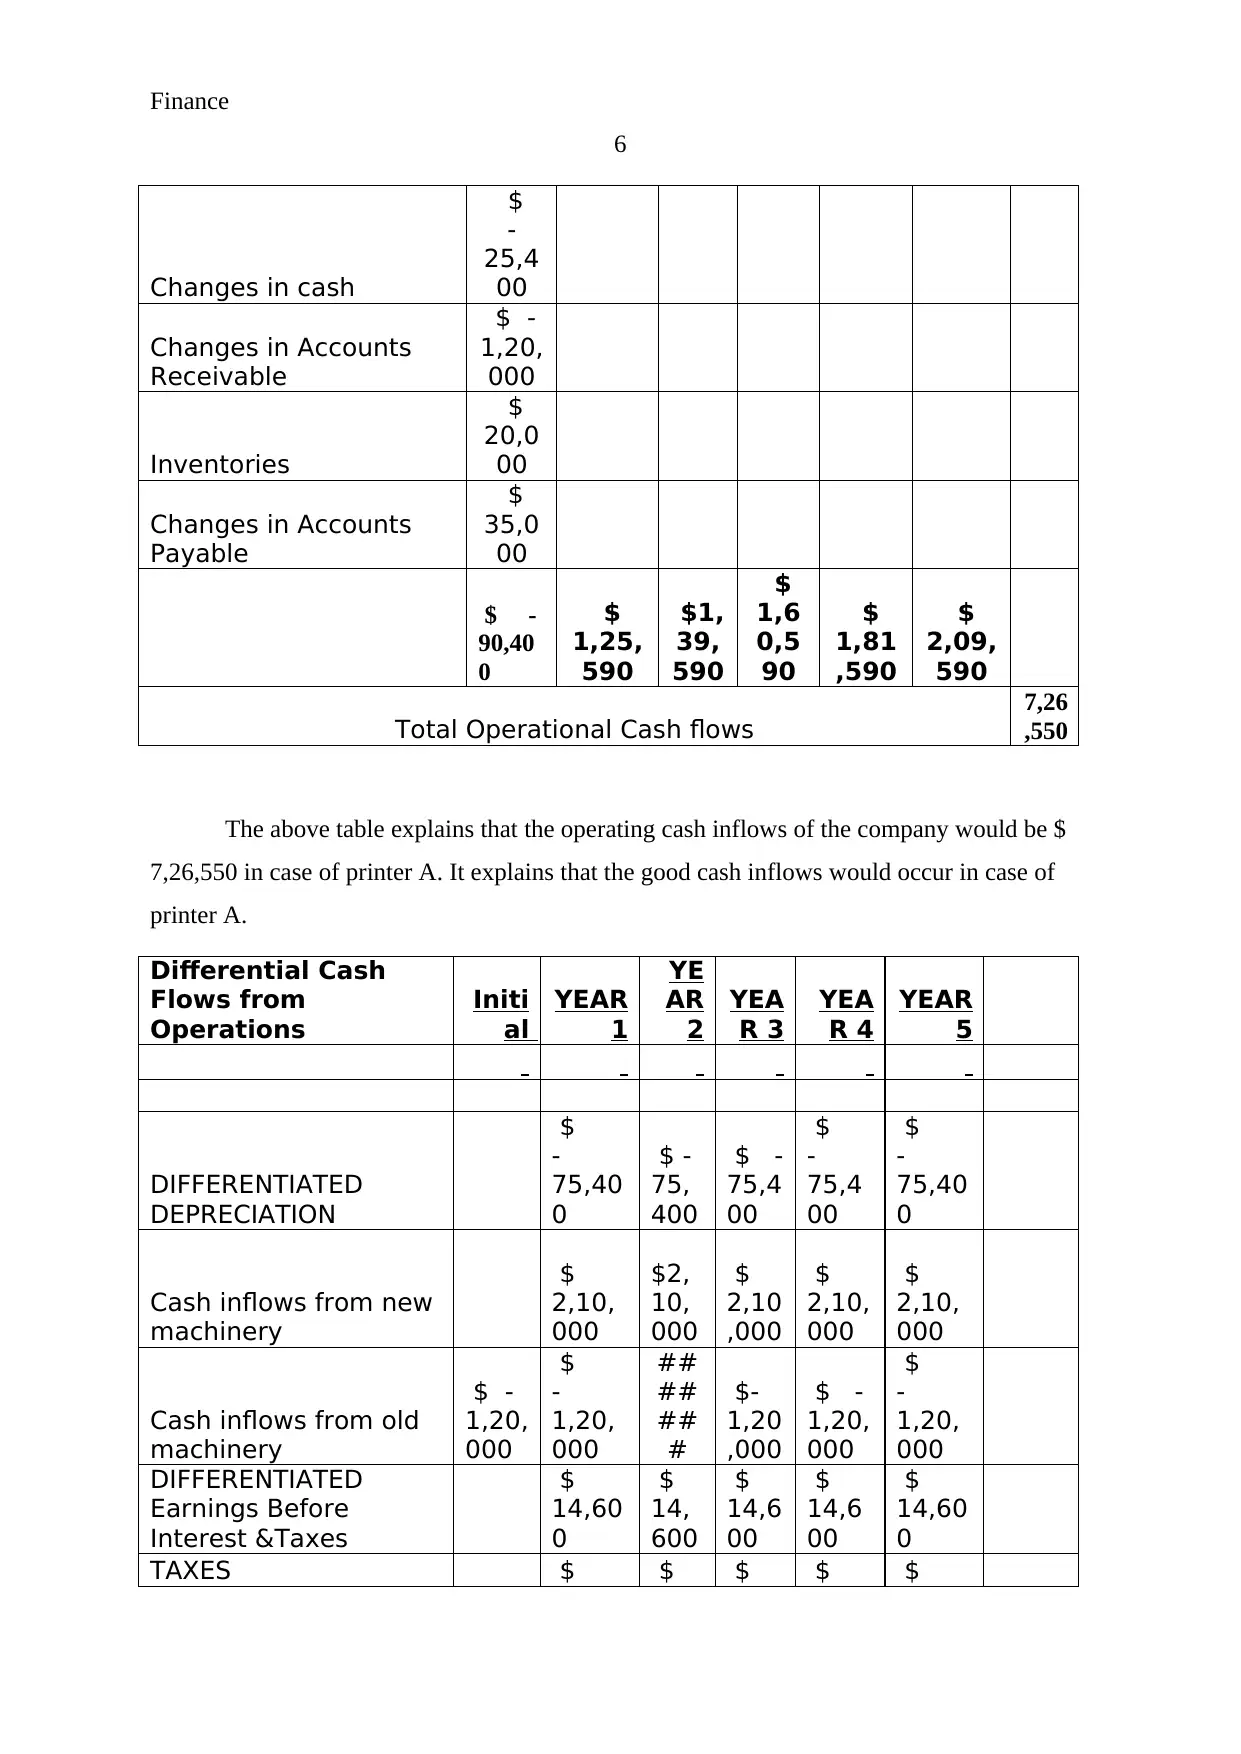
The above table explains that the operating cash inflows of the company would be $
7,26,550 in case of printer A. It explains that the good cash inflows would occur in case of
printer A.
Differential Cash
Flows from
Operations
Initi
al
YEAR
1
YE
AR
2
YEA
R 3
YEA
R 4
YEAR
5
DIFFERENTIATED
DEPRECIATION
$
-
75,40
0
$ -
75,
400
$ -
75,4
00
$
-
75,4
00
$
-
75,40
0
Cash inflows from new
machinery
$
2,10,
000
$2,
10,
000
$
2,10
,000
$
2,10,
000
$
2,10,
000
Cash inflows from old
machinery
$ -
1,20,
000
$
-
1,20,
000
##
##
##
#
$-
1,20
,000
$ -
1,20,
000
$
-
1,20,
000
DIFFERENTIATED
Earnings Before
Interest &Taxes
$
14,60
0
$
14,
600
$
14,6
00
$
14,6
00
$
14,60
0
TAXES $ $ $ $ $
6
Changes in cash
$
-
25,4
00
Changes in Accounts
Receivable
$ -
1,20,
000
Inventories
$
20,0
00
Changes in Accounts
Payable
$
35,0
00
$ -
90,40
0
$
1,25,
590
$1,
39,
590
$
1,6
0,5
90
$
1,81
,590
$
2,09,
590
Total Operational Cash flows
7,26
,550
The above table explains that the operating cash inflows of the company would be $
7,26,550 in case of printer A. It explains that the good cash inflows would occur in case of
printer A.
Differential Cash
Flows from
Operations
Initi
al
YEAR
1
YE
AR
2
YEA
R 3
YEA
R 4
YEAR
5
DIFFERENTIATED
DEPRECIATION
$
-
75,40
0
$ -
75,
400
$ -
75,4
00
$
-
75,4
00
$
-
75,40
0
Cash inflows from new
machinery
$
2,10,
000
$2,
10,
000
$
2,10
,000
$
2,10,
000
$
2,10,
000
Cash inflows from old
machinery
$ -
1,20,
000
$
-
1,20,
000
##
##
##
#
$-
1,20
,000
$ -
1,20,
000
$
-
1,20,
000
DIFFERENTIATED
Earnings Before
Interest &Taxes
$
14,60
0
$
14,
600
$
14,6
00
$
14,6
00
$
14,60
0
TAXES $ $ $ $ $
⊘ This is a preview!⊘
Do you want full access?
Subscribe today to unlock all pages.
Trusted by 1+ million students worldwide
Finance
7
-
4,380
-
4,3
80
-
4,38
0
-
4,38
0
-
4,380
DIFFERENTIATED
EBIAT
$
10,22
0
$
10,
220
$
10,2
20
$
10,2
20
$
10,22
0
DIFF Operational CF
$
85,62
0
$
85,
620
$
85,6
20
$
85,6
20
$
85,62
0
Total Operational Cash flows
$
4,28,1
00
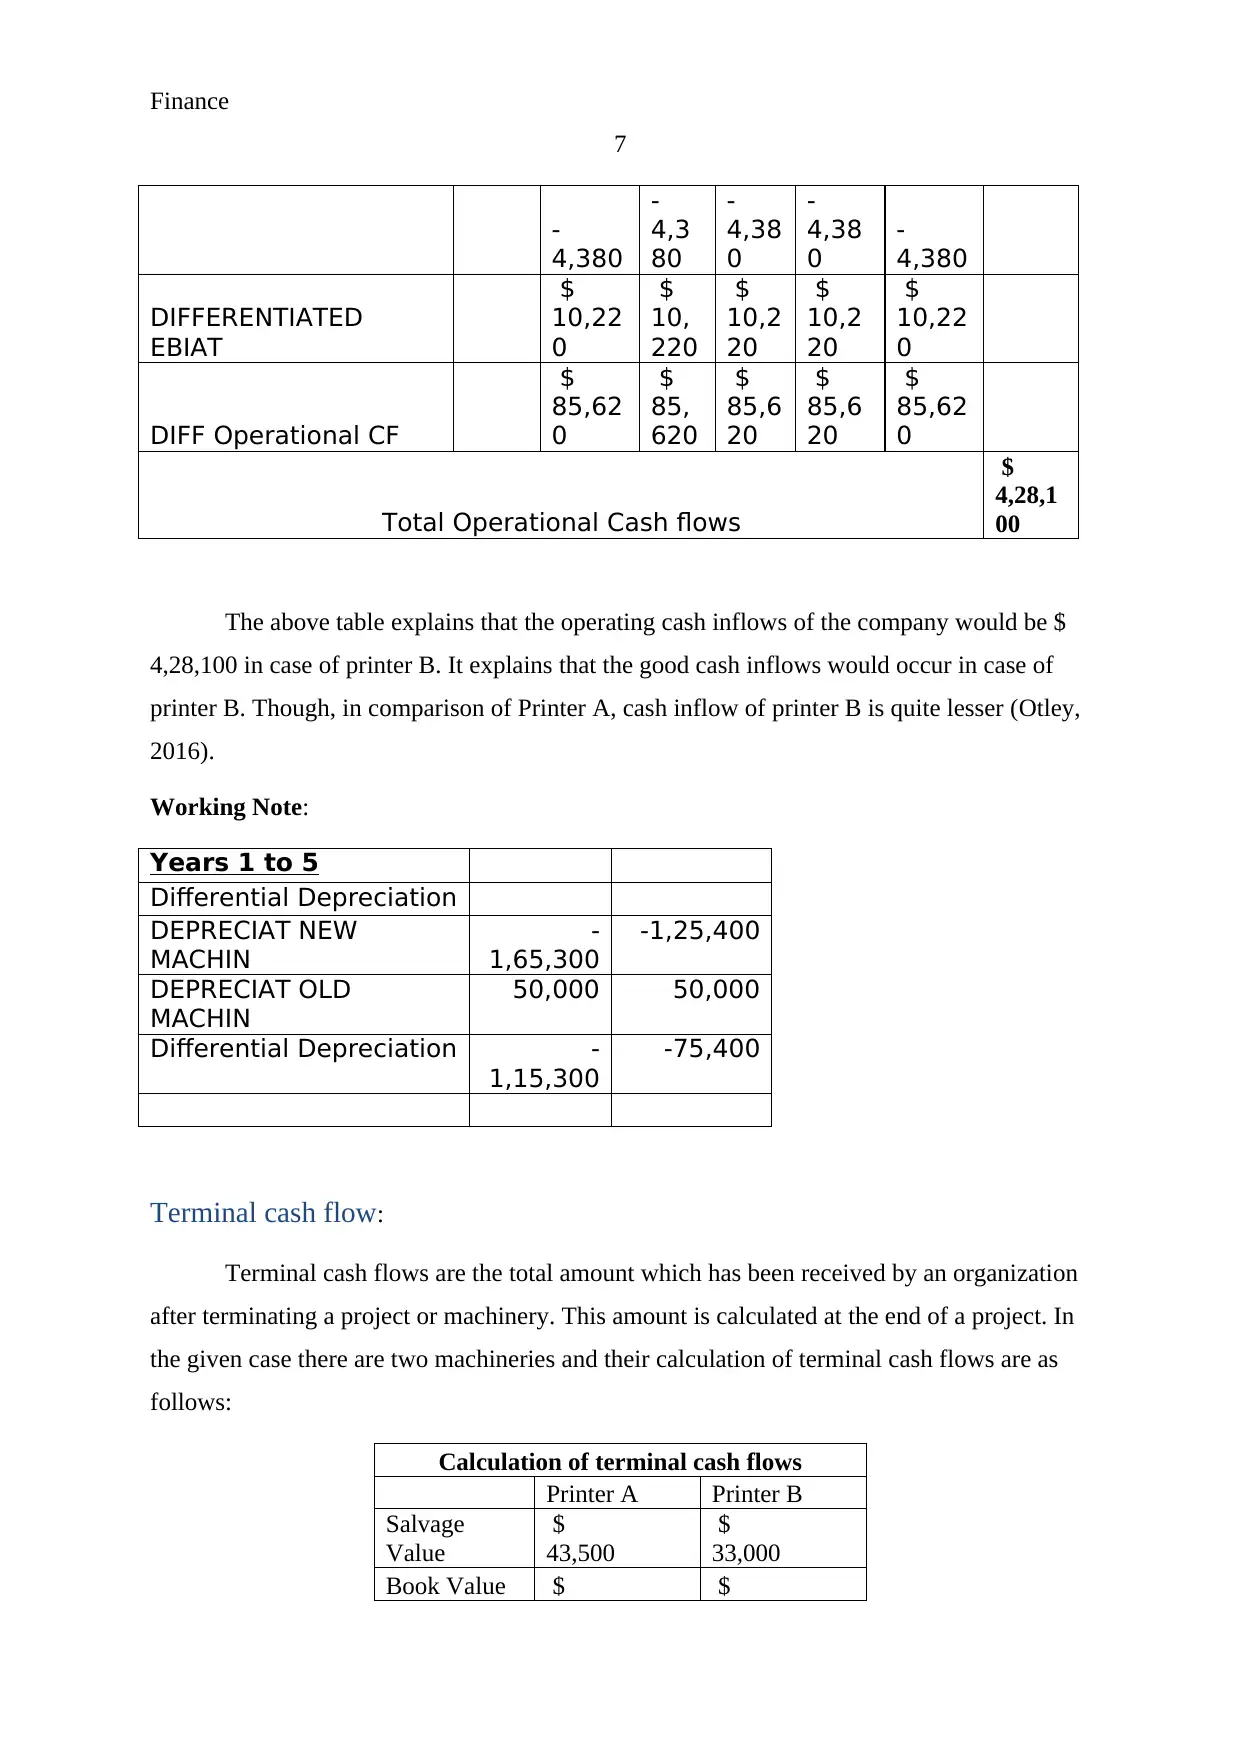
The above table explains that the operating cash inflows of the company would be $
4,28,100 in case of printer B. It explains that the good cash inflows would occur in case of
printer B. Though, in comparison of Printer A, cash inflow of printer B is quite lesser (Otley,
2016).
Working Note:
Years 1 to 5
Differential Depreciation
DEPRECIAT NEW
MACHIN
-
1,65,300
-1,25,400
DEPRECIAT OLD
MACHIN
50,000 50,000
Differential Depreciation -
1,15,300
-75,400
Terminal cash flow:
Terminal cash flows are the total amount which has been received by an organization
after terminating a project or machinery. This amount is calculated at the end of a project. In
the given case there are two machineries and their calculation of terminal cash flows are as
follows:
Calculation of terminal cash flows
Printer A Printer B
Salvage
Value
$
43,500
$
33,000
Book Value $ $
7
-
4,380
-
4,3
80
-
4,38
0
-
4,38
0
-
4,380
DIFFERENTIATED
EBIAT
$
10,22
0
$
10,
220
$
10,2
20
$
10,2
20
$
10,22
0
DIFF Operational CF
$
85,62
0
$
85,
620
$
85,6
20
$
85,6
20
$
85,62
0
Total Operational Cash flows
$
4,28,1
00
The above table explains that the operating cash inflows of the company would be $
4,28,100 in case of printer B. It explains that the good cash inflows would occur in case of
printer B. Though, in comparison of Printer A, cash inflow of printer B is quite lesser (Otley,
2016).
Working Note:
Years 1 to 5
Differential Depreciation
DEPRECIAT NEW
MACHIN
-
1,65,300
-1,25,400
DEPRECIAT OLD
MACHIN
50,000 50,000
Differential Depreciation -
1,15,300
-75,400
Terminal cash flow:
Terminal cash flows are the total amount which has been received by an organization
after terminating a project or machinery. This amount is calculated at the end of a project. In
the given case there are two machineries and their calculation of terminal cash flows are as
follows:
Calculation of terminal cash flows
Printer A Printer B
Salvage
Value
$
43,500
$
33,000
Book Value $ $
Paraphrase This Document
Need a fresh take? Get an instant paraphrase of this document with our AI Paraphraser
Finance
8
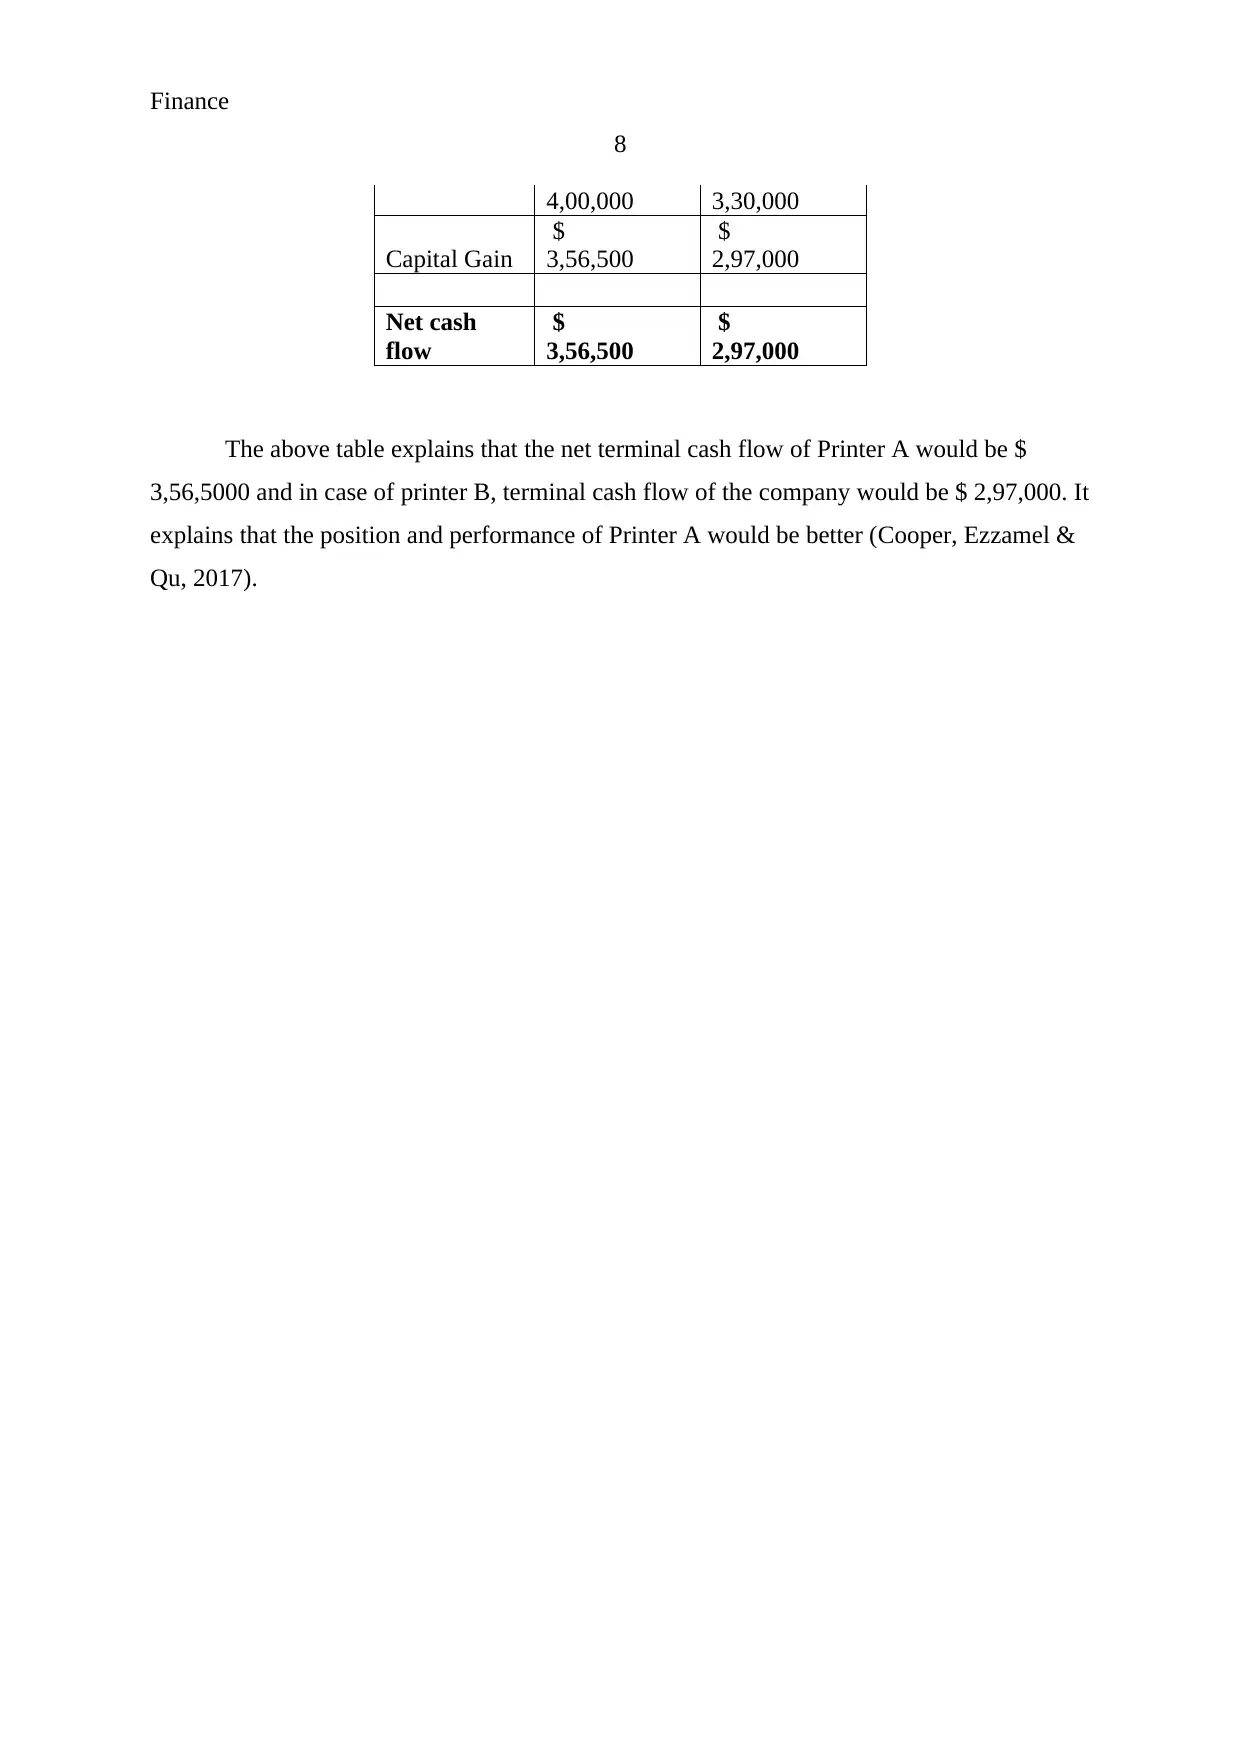
4,00,000 3,30,000
Capital Gain
$
3,56,500
$
2,97,000
Net cash
flow
$
3,56,500
$
2,97,000
The above table explains that the net terminal cash flow of Printer A would be $
3,56,5000 and in case of printer B, terminal cash flow of the company would be $ 2,97,000. It
explains that the position and performance of Printer A would be better (Cooper, Ezzamel &
Qu, 2017).
8
4,00,000 3,30,000
Capital Gain
$
3,56,500
$
2,97,000
Net cash
flow
$
3,56,500
$
2,97,000
The above table explains that the net terminal cash flow of Printer A would be $
3,56,5000 and in case of printer B, terminal cash flow of the company would be $ 2,97,000. It
explains that the position and performance of Printer A would be better (Cooper, Ezzamel &
Qu, 2017).
Finance
9
Part B:
Relevant cash flow stream:
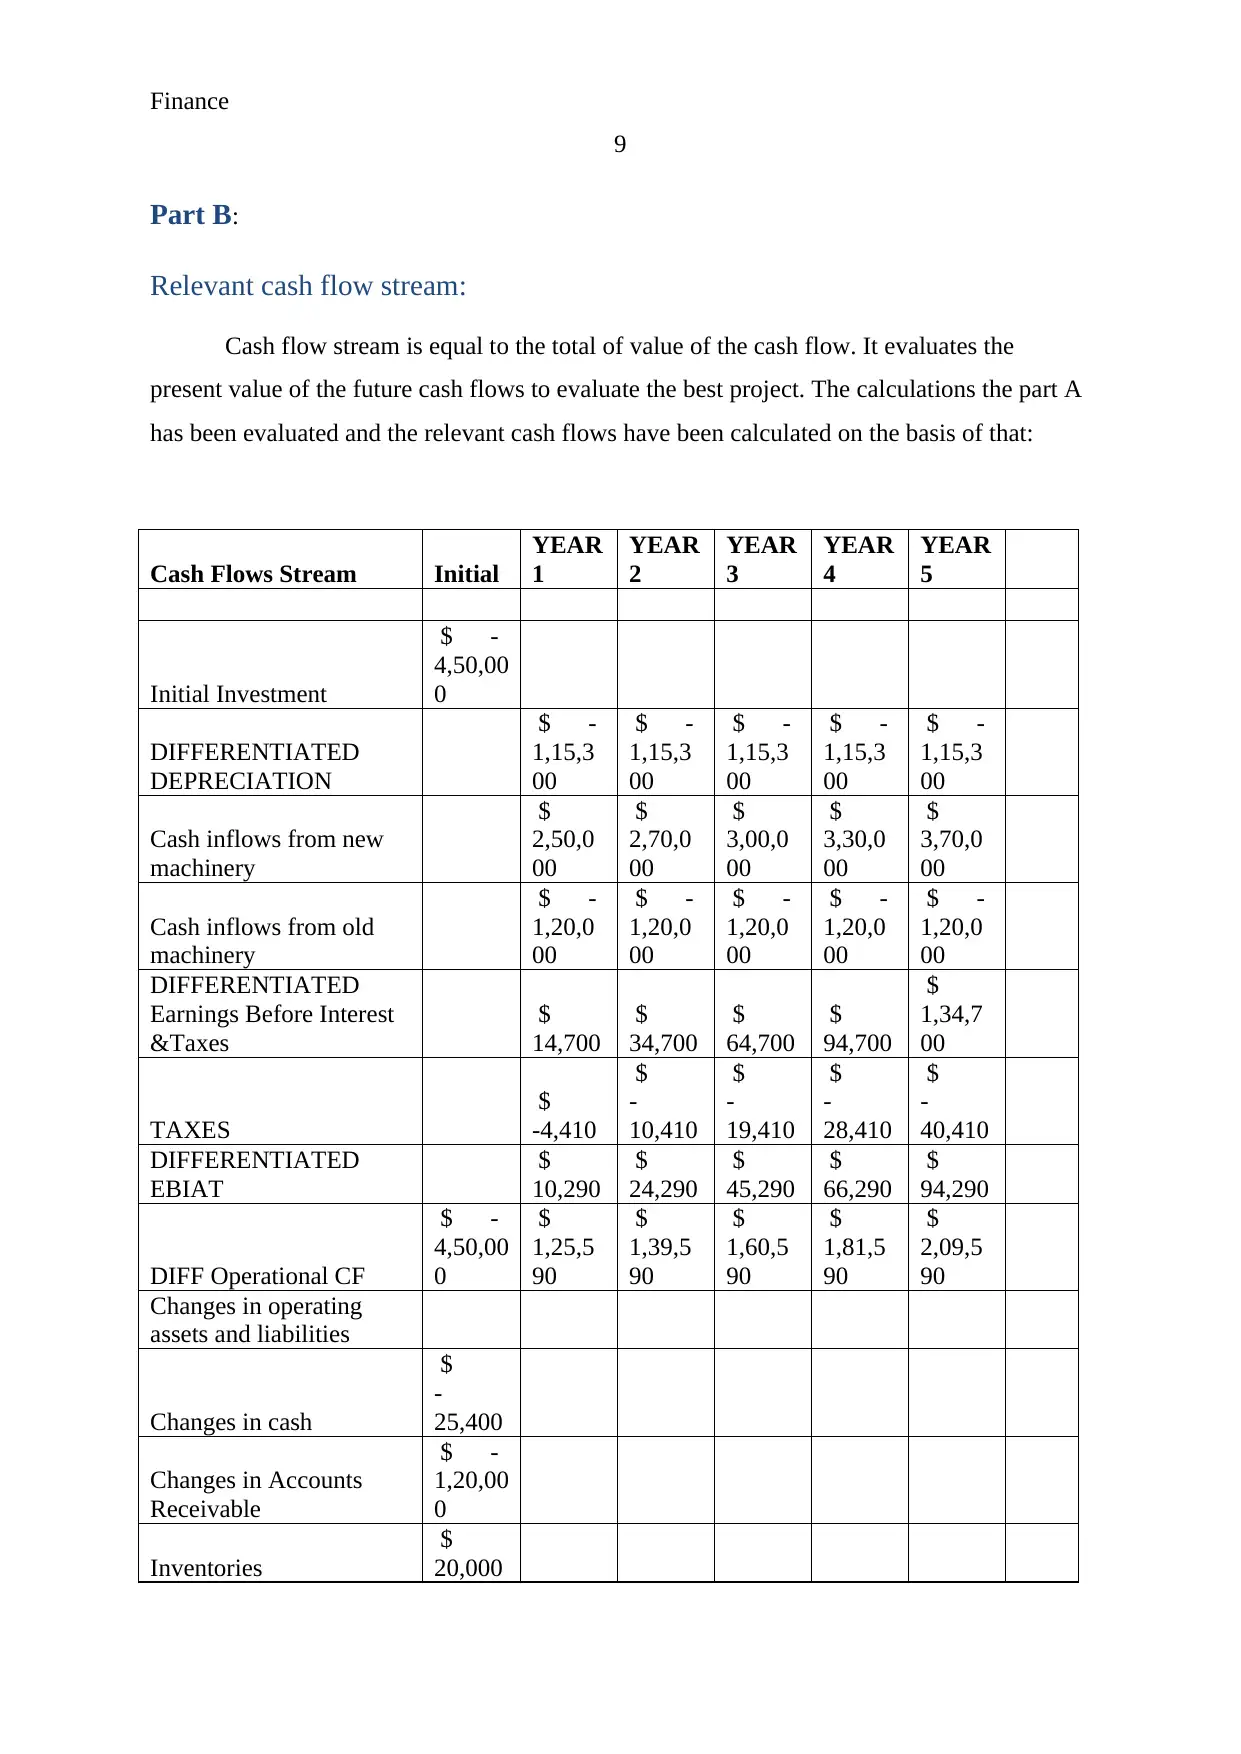
Cash flow stream is equal to the total of value of the cash flow. It evaluates the
present value of the future cash flows to evaluate the best project. The calculations the part A
has been evaluated and the relevant cash flows have been calculated on the basis of that:
Cash Flows Stream Initial
YEAR
1
YEAR
2
YEAR
3
YEAR
4
YEAR
5
Initial Investment
$ -
4,50,00
0
DIFFERENTIATED
DEPRECIATION
$ -
1,15,3
00
$ -
1,15,3
00
$ -
1,15,3
00
$ -
1,15,3
00
$ -
1,15,3
00
Cash inflows from new
machinery
$
2,50,0
00
$
2,70,0
00
$
3,00,0
00
$
3,30,0
00
$
3,70,0
00
Cash inflows from old
machinery
$ -
1,20,0
00
$ -
1,20,0
00
$ -
1,20,0
00
$ -
1,20,0
00
$ -
1,20,0
00
DIFFERENTIATED
Earnings Before Interest
&Taxes
$
14,700
$
34,700
$
64,700
$
94,700
$
1,34,7
00
TAXES
$
-4,410
$
-
10,410
$
-
19,410
$
-
28,410
$
-
40,410
DIFFERENTIATED
EBIAT
$
10,290
$
24,290
$
45,290
$
66,290
$
94,290
DIFF Operational CF
$ -
4,50,00
0
$
1,25,5
90
$
1,39,5
90
$
1,60,5
90
$
1,81,5
90
$
2,09,5
90
Changes in operating
assets and liabilities
Changes in cash
$
-
25,400
Changes in Accounts
Receivable
$ -
1,20,00
0
Inventories
$
20,000
9
Part B:
Relevant cash flow stream:
Cash flow stream is equal to the total of value of the cash flow. It evaluates the
present value of the future cash flows to evaluate the best project. The calculations the part A
has been evaluated and the relevant cash flows have been calculated on the basis of that:
Cash Flows Stream Initial
YEAR
1
YEAR
2
YEAR
3
YEAR
4
YEAR
5
Initial Investment
$ -
4,50,00
0
DIFFERENTIATED
DEPRECIATION
$ -
1,15,3
00
$ -
1,15,3
00
$ -
1,15,3
00
$ -
1,15,3
00
$ -
1,15,3
00
Cash inflows from new
machinery
$
2,50,0
00
$
2,70,0
00
$
3,00,0
00
$
3,30,0
00
$
3,70,0
00
Cash inflows from old
machinery
$ -
1,20,0
00
$ -
1,20,0
00
$ -
1,20,0
00
$ -
1,20,0
00
$ -
1,20,0
00
DIFFERENTIATED
Earnings Before Interest
&Taxes
$
14,700
$
34,700
$
64,700
$
94,700
$
1,34,7
00
TAXES
$
-4,410
$
-
10,410
$
-
19,410
$
-
28,410
$
-
40,410
DIFFERENTIATED
EBIAT
$
10,290
$
24,290
$
45,290
$
66,290
$
94,290
DIFF Operational CF
$ -
4,50,00
0
$
1,25,5
90
$
1,39,5
90
$
1,60,5
90
$
1,81,5
90
$
2,09,5
90
Changes in operating
assets and liabilities
Changes in cash
$
-
25,400
Changes in Accounts
Receivable
$ -
1,20,00
0
Inventories
$
20,000
⊘ This is a preview!⊘
Do you want full access?
Subscribe today to unlock all pages.
Trusted by 1+ million students worldwide
Finance
10
Changes in Accounts
Payable
$
35,000
$ -
5,40,40
0
$
1,25,5
90
$
1,39,5
90
$
1,60,5
90
$
1,81,5
90
$
2,09,5
90
Salvage Value
$
43,500
Book Value
$
4,00,0
00
Capital Gain
$
3,56,5
00
Tax on capital gain
Net cash flow
$
3,56,5
00
Total Operational Cash
flows
$ -
5,40,40
0
$
1,25,5
90
$
1,39,5
90
$
1,60,5
90
$
1,81,5
90
$
5,66,0
90
$6,3
3,05
0
Present value factor 1 0.8772 0.7695 0.6750 0.5921 0.5194
Present value
-
540400
11016
6.6667
10740
9.9723
10839
3.6758
10751
5.8576
29400
9.4072
1,87,
096
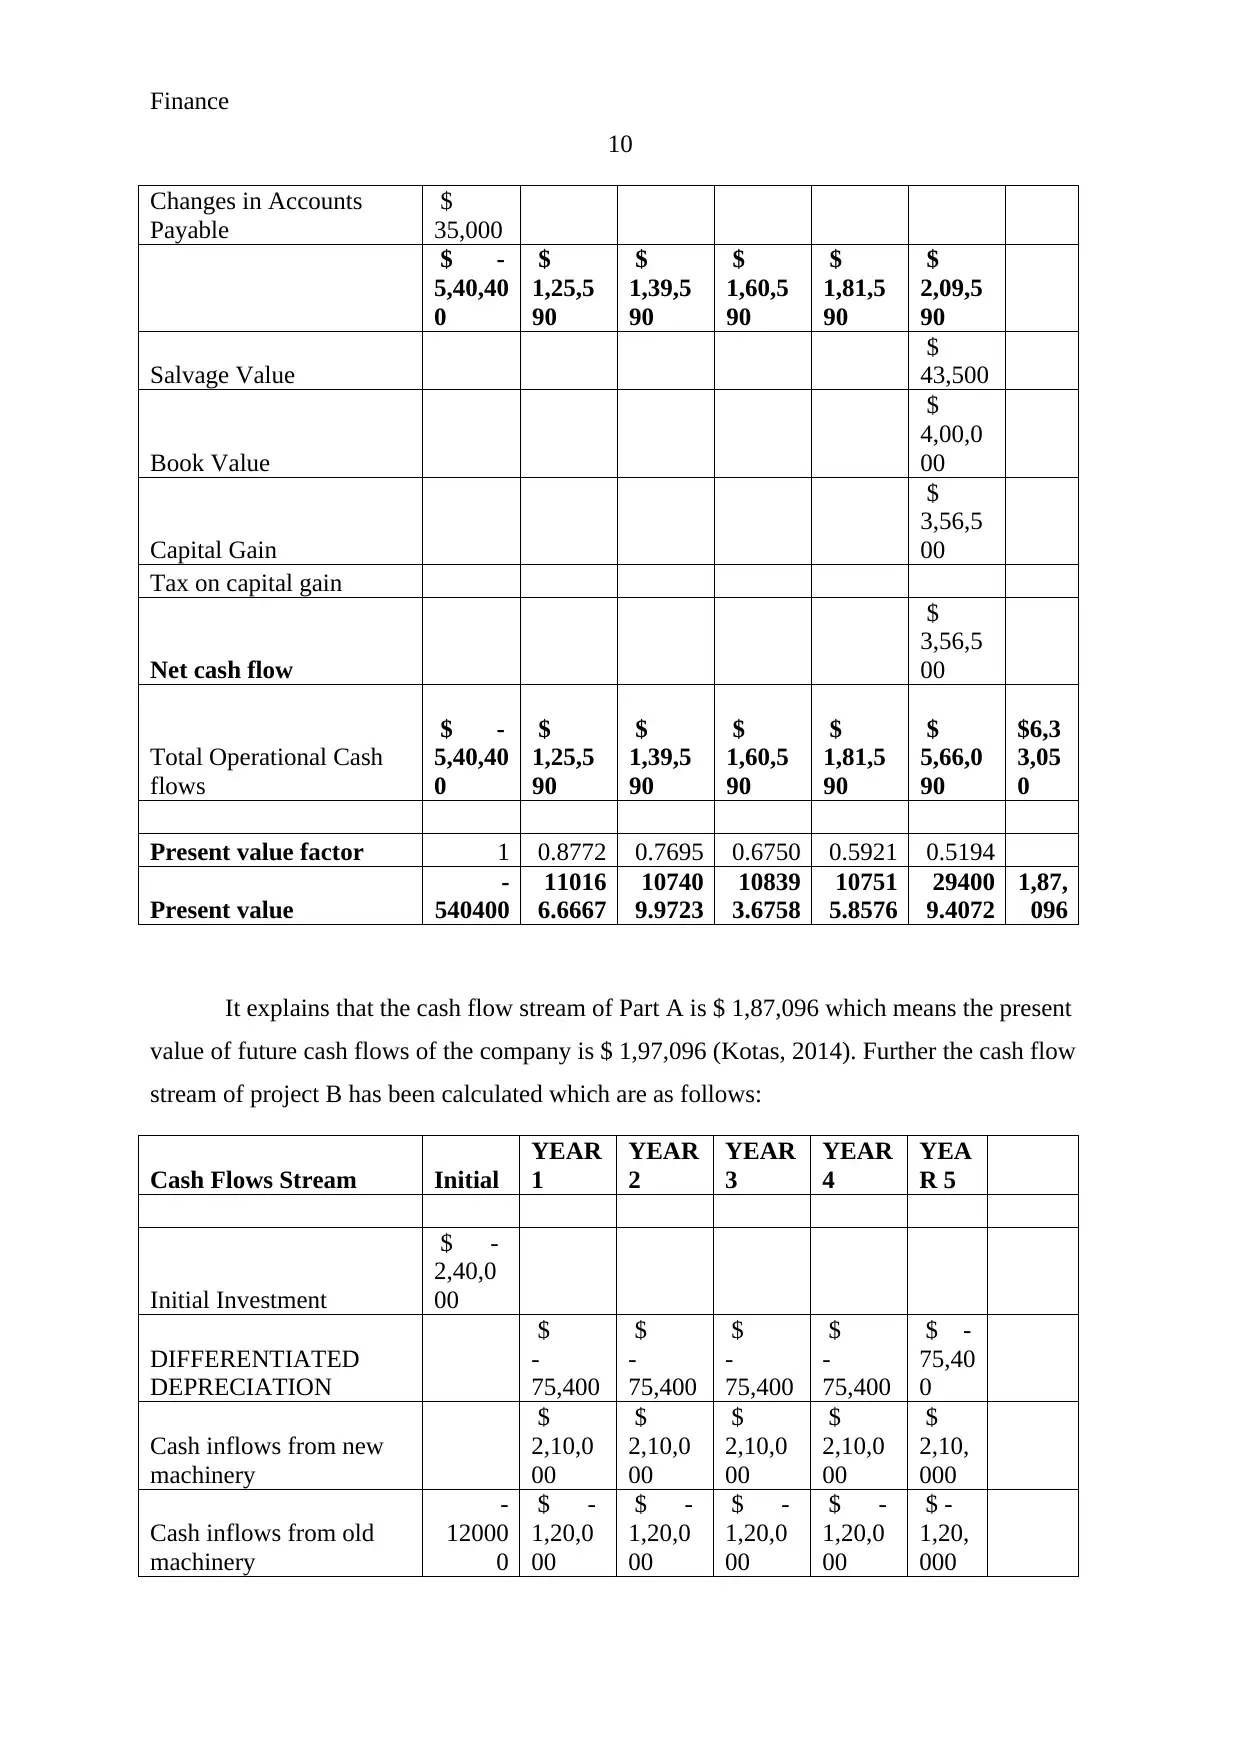
It explains that the cash flow stream of Part A is $ 1,87,096 which means the present
value of future cash flows of the company is $ 1,97,096 (Kotas, 2014). Further the cash flow
stream of project B has been calculated which are as follows:
Cash Flows Stream Initial
YEAR
1
YEAR
2
YEAR
3
YEAR
4
YEA
R 5
Initial Investment
$ -
2,40,0
00
DIFFERENTIATED
DEPRECIATION
$
-
75,400
$
-
75,400
$
-
75,400
$
-
75,400
$ -
75,40
0
Cash inflows from new
machinery
$
2,10,0
00
$
2,10,0
00
$
2,10,0
00
$
2,10,0
00
$
2,10,
000
Cash inflows from old
machinery
-
12000
0
$ -
1,20,0
00
$ -
1,20,0
00
$ -
1,20,0
00
$ -
1,20,0
00
$ -
1,20,
000
10
Changes in Accounts
Payable
$
35,000
$ -
5,40,40
0
$
1,25,5
90
$
1,39,5
90
$
1,60,5
90
$
1,81,5
90
$
2,09,5
90
Salvage Value
$
43,500
Book Value
$
4,00,0
00
Capital Gain
$
3,56,5
00
Tax on capital gain
Net cash flow
$
3,56,5
00
Total Operational Cash
flows
$ -
5,40,40
0
$
1,25,5
90
$
1,39,5
90
$
1,60,5
90
$
1,81,5
90
$
5,66,0
90
$6,3
3,05
0
Present value factor 1 0.8772 0.7695 0.6750 0.5921 0.5194
Present value
-
540400
11016
6.6667
10740
9.9723
10839
3.6758
10751
5.8576
29400
9.4072
1,87,
096
It explains that the cash flow stream of Part A is $ 1,87,096 which means the present
value of future cash flows of the company is $ 1,97,096 (Kotas, 2014). Further the cash flow
stream of project B has been calculated which are as follows:
Cash Flows Stream Initial
YEAR
1
YEAR
2
YEAR
3
YEAR
4
YEA
R 5
Initial Investment
$ -
2,40,0
00
DIFFERENTIATED
DEPRECIATION
$
-
75,400
$
-
75,400
$
-
75,400
$
-
75,400
$ -
75,40
0
Cash inflows from new
machinery
$
2,10,0
00
$
2,10,0
00
$
2,10,0
00
$
2,10,0
00
$
2,10,
000
Cash inflows from old
machinery
-
12000
0
$ -
1,20,0
00
$ -
1,20,0
00
$ -
1,20,0
00
$ -
1,20,0
00
$ -
1,20,
000
Paraphrase This Document
Need a fresh take? Get an instant paraphrase of this document with our AI Paraphraser
Finance
11
DIFFERENTIATED
Earnings Before Interest
&Taxes
$
14,600
$
14,600
$
14,600
$
14,600
$
14,60
0
TAXES
$
-4,380
$
-4,380
$
-4,380
$
-4,380
$
-
4,380
DIFFERENTIATED
EBIAT
$
10,220
$
10,220
$
10,220
$
10,220
$
10,22
0
DIFF Operational CF
$ -
2,40,0
00
$
85,620
$
85,620
$
85,620
$
85,620
$
85,62
0
Salvage Value
$
33,00
0
Book Value
$
3,30,
000
Capital Gain
$
2,97,
000
Tax on capital gain
Net cash flow
2970
00
Total Operational Cash
flows
$ -
2,40,0
00
$
85,620
$
85,620
$
85,620
$
85,620
$
3,82,
620
$
4,85,1
00
Present value factor
$
1
$
1
$
1
$
1
$
1
$
1
Present value
$ -
2,40,0
00
$
75,105
$
65,882
$
57,791
$
50,694
$
1,98,
721
$
2,08,1
93
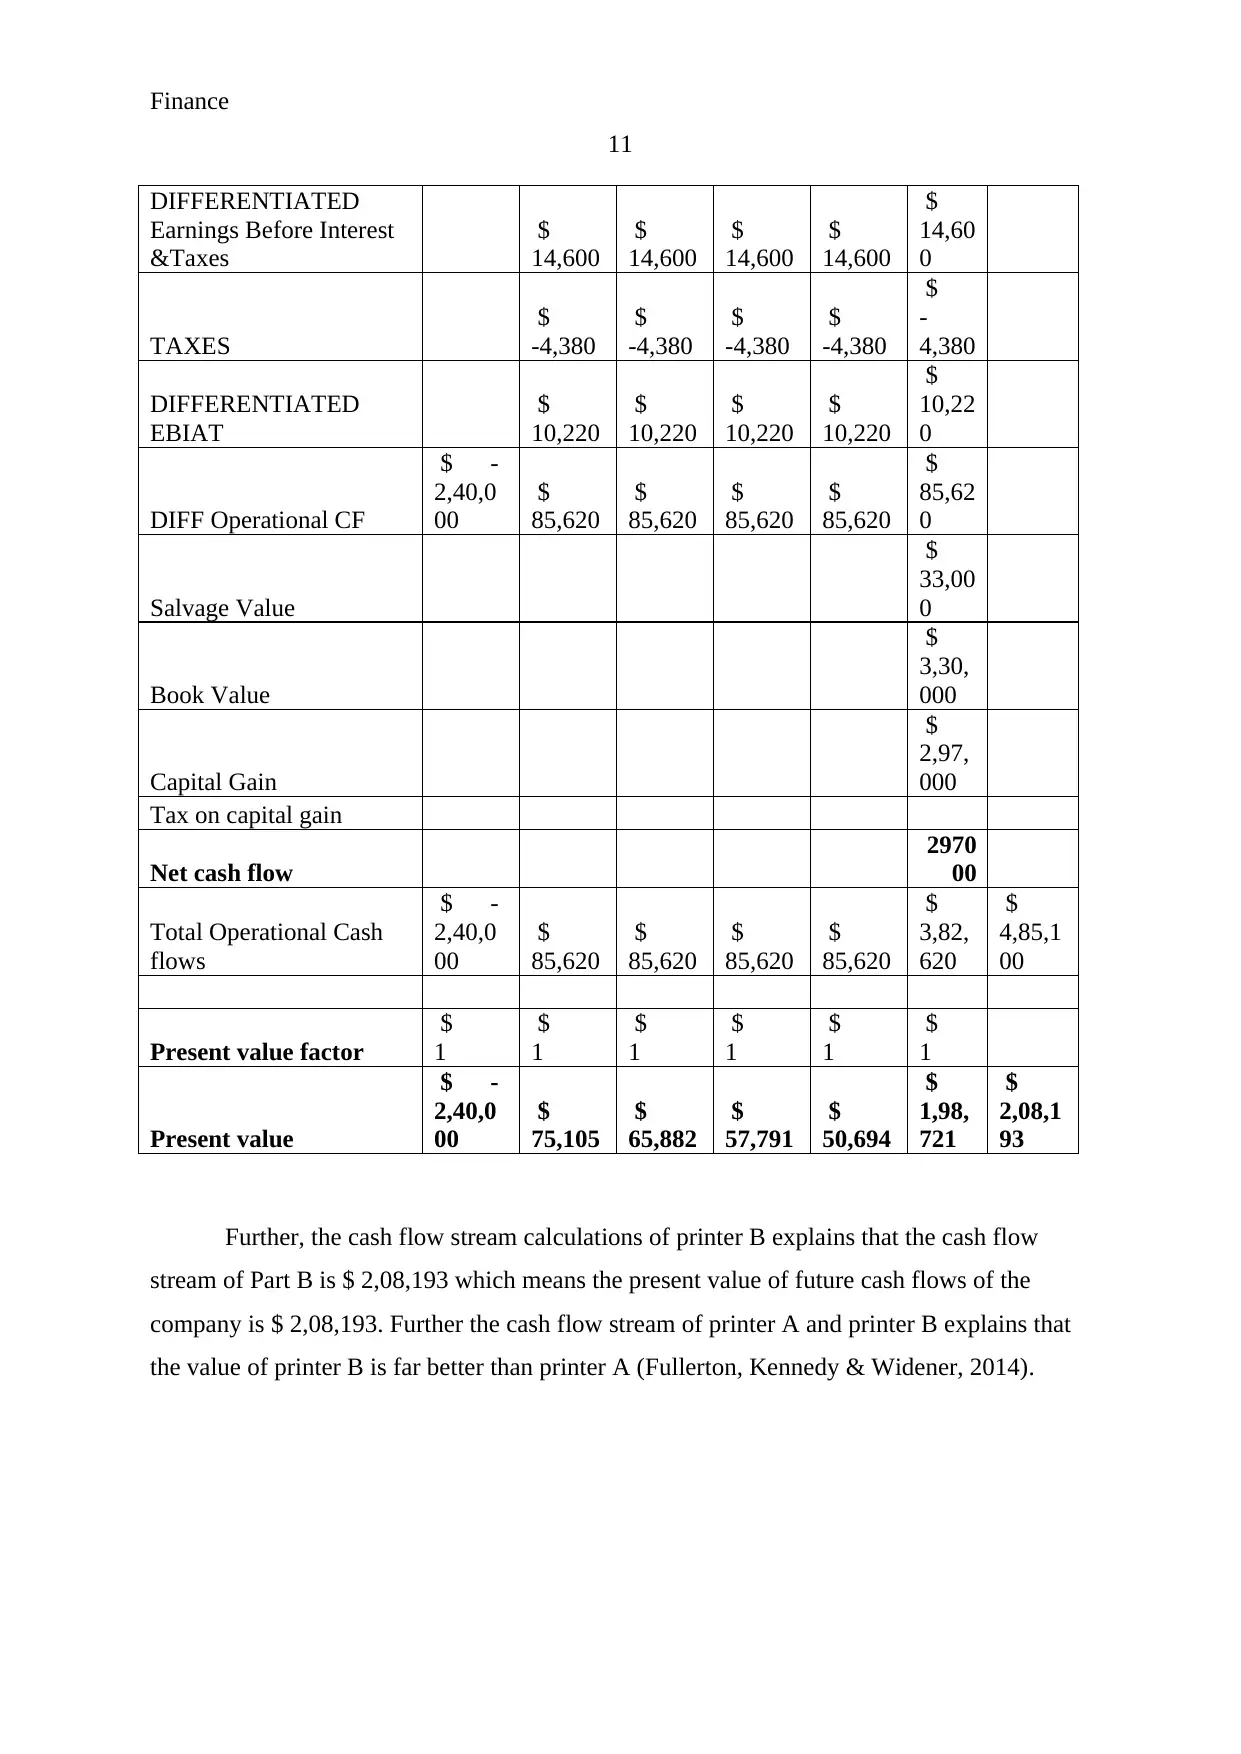
Further, the cash flow stream calculations of printer B explains that the cash flow
stream of Part B is $ 2,08,193 which means the present value of future cash flows of the
company is $ 2,08,193. Further the cash flow stream of printer A and printer B explains that
the value of printer B is far better than printer A (Fullerton, Kennedy & Widener, 2014).
11
DIFFERENTIATED
Earnings Before Interest
&Taxes
$
14,600
$
14,600
$
14,600
$
14,600
$
14,60
0
TAXES
$
-4,380
$
-4,380
$
-4,380
$
-4,380
$
-
4,380
DIFFERENTIATED
EBIAT
$
10,220
$
10,220
$
10,220
$
10,220
$
10,22
0
DIFF Operational CF
$ -
2,40,0
00
$
85,620
$
85,620
$
85,620
$
85,620
$
85,62
0
Salvage Value
$
33,00
0
Book Value
$
3,30,
000
Capital Gain
$
2,97,
000
Tax on capital gain
Net cash flow
2970
00
Total Operational Cash
flows
$ -
2,40,0
00
$
85,620
$
85,620
$
85,620
$
85,620
$
3,82,
620
$
4,85,1
00
Present value factor
$
1
$
1
$
1
$
1
$
1
$
1
Present value
$ -
2,40,0
00
$
75,105
$
65,882
$
57,791
$
50,694
$
1,98,
721
$
2,08,1
93
Further, the cash flow stream calculations of printer B explains that the cash flow
stream of Part B is $ 2,08,193 which means the present value of future cash flows of the
company is $ 2,08,193. Further the cash flow stream of printer A and printer B explains that
the value of printer B is far better than printer A (Fullerton, Kennedy & Widener, 2014).
Finance
12
Part C:
After evaluating the cash flows of both the projects, the NPV, IRR and payback
period of both the printers have been calculated to evaluate the best project. Capital
budgeting techniques makes it easy for the company to measure the changes and make a
better decision:
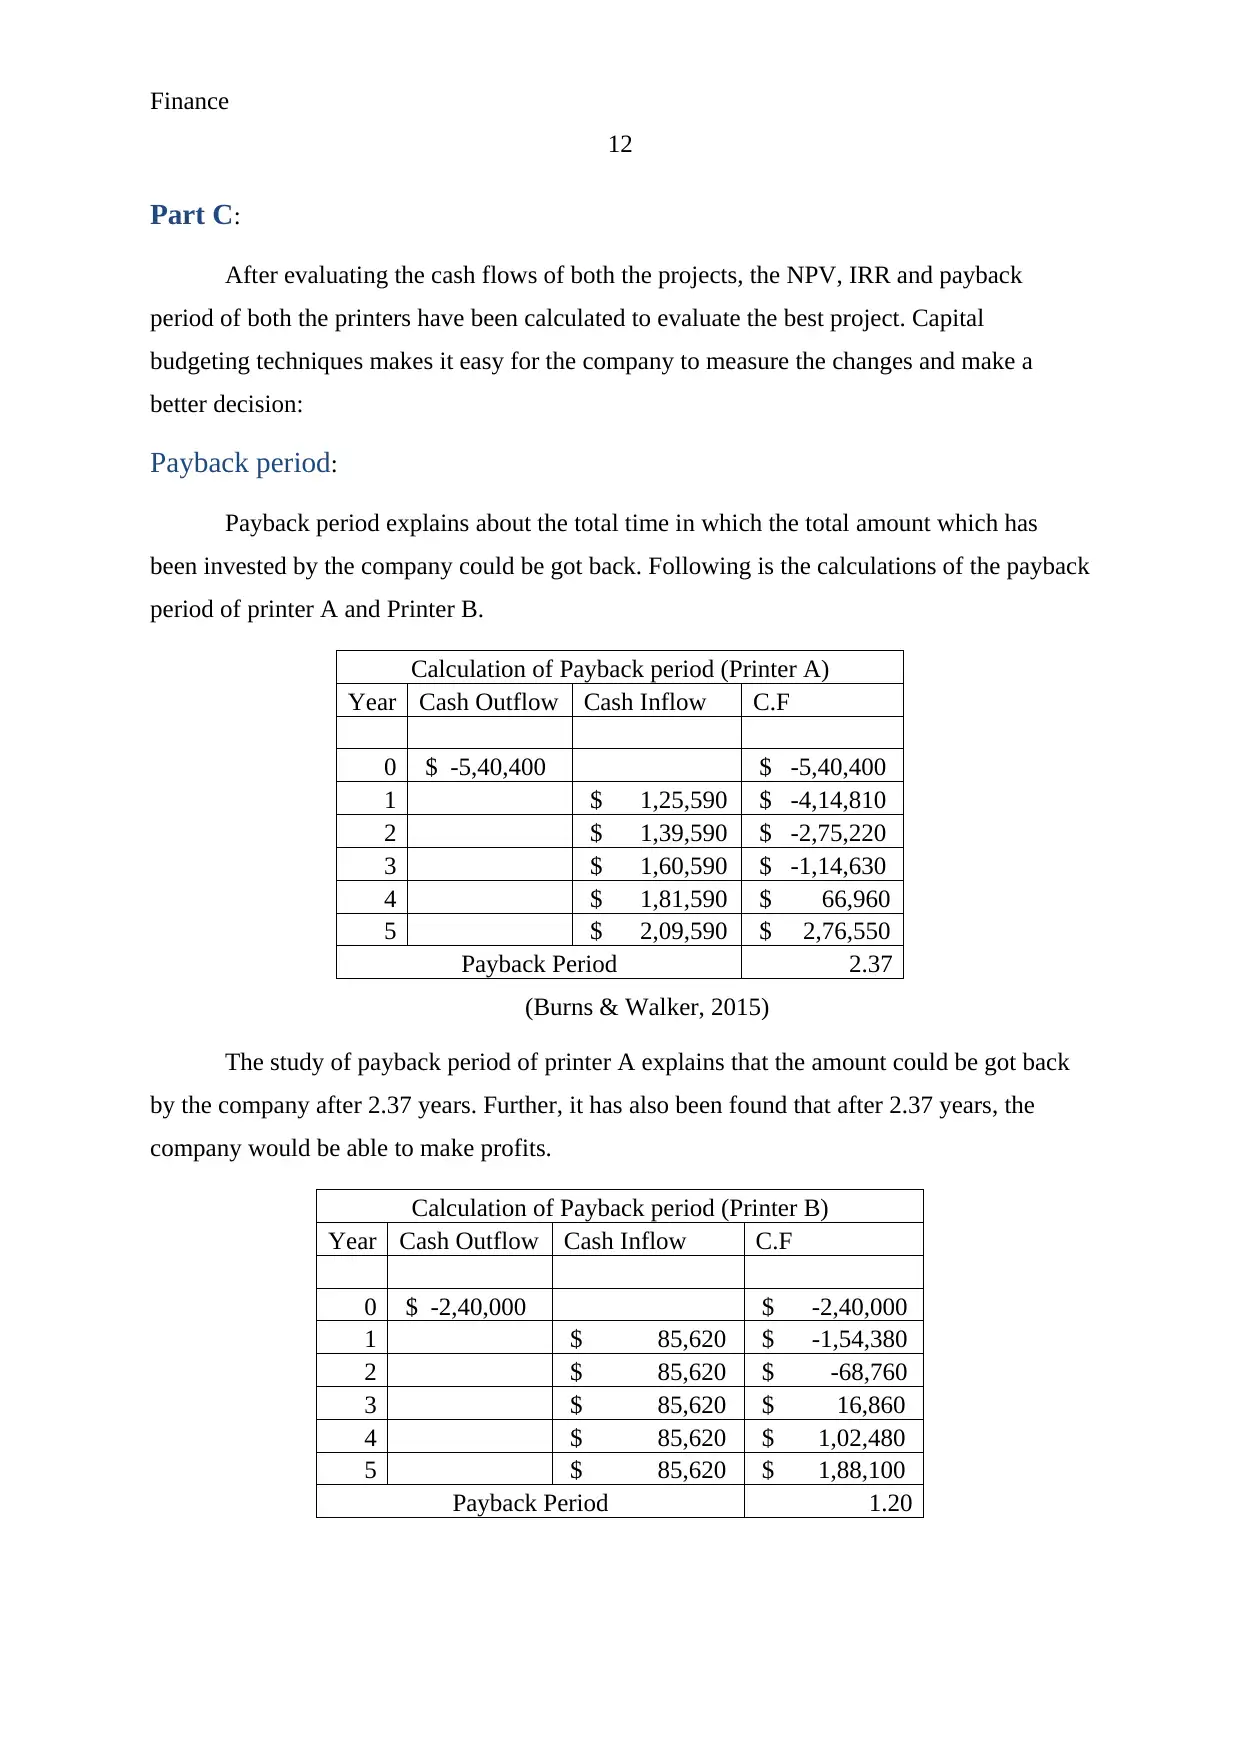
Payback period:
Payback period explains about the total time in which the total amount which has
been invested by the company could be got back. Following is the calculations of the payback
period of printer A and Printer B.
Calculation of Payback period (Printer A)
Year Cash Outflow Cash Inflow C.F
0 $ -5,40,400 $ -5,40,400
1 $ 1,25,590 $ -4,14,810
2 $ 1,39,590 $ -2,75,220
3 $ 1,60,590 $ -1,14,630
4 $ 1,81,590 $ 66,960
5 $ 2,09,590 $ 2,76,550
Payback Period 2.37
(Burns & Walker, 2015)
The study of payback period of printer A explains that the amount could be got back
by the company after 2.37 years. Further, it has also been found that after 2.37 years, the
company would be able to make profits.
Calculation of Payback period (Printer B)
Year Cash Outflow Cash Inflow C.F
0 $ -2,40,000 $ -2,40,000
1 $ 85,620 $ -1,54,380
2 $ 85,620 $ -68,760
3 $ 85,620 $ 16,860
4 $ 85,620 $ 1,02,480
5 $ 85,620 $ 1,88,100
Payback Period 1.20
12
Part C:
After evaluating the cash flows of both the projects, the NPV, IRR and payback
period of both the printers have been calculated to evaluate the best project. Capital
budgeting techniques makes it easy for the company to measure the changes and make a
better decision:
Payback period:
Payback period explains about the total time in which the total amount which has
been invested by the company could be got back. Following is the calculations of the payback
period of printer A and Printer B.
Calculation of Payback period (Printer A)
Year Cash Outflow Cash Inflow C.F
0 $ -5,40,400 $ -5,40,400
1 $ 1,25,590 $ -4,14,810
2 $ 1,39,590 $ -2,75,220
3 $ 1,60,590 $ -1,14,630
4 $ 1,81,590 $ 66,960
5 $ 2,09,590 $ 2,76,550
Payback Period 2.37
(Burns & Walker, 2015)
The study of payback period of printer A explains that the amount could be got back
by the company after 2.37 years. Further, it has also been found that after 2.37 years, the
company would be able to make profits.
Calculation of Payback period (Printer B)
Year Cash Outflow Cash Inflow C.F
0 $ -2,40,000 $ -2,40,000
1 $ 85,620 $ -1,54,380
2 $ 85,620 $ -68,760
3 $ 85,620 $ 16,860
4 $ 85,620 $ 1,02,480
5 $ 85,620 $ 1,88,100
Payback Period 1.20
⊘ This is a preview!⊘
Do you want full access?
Subscribe today to unlock all pages.
Trusted by 1+ million students worldwide
1 out of 21
Related Documents


Your All-in-One AI-Powered Toolkit for Academic Success.
+13062052269
info@desklib.com
Available 24*7 on WhatsApp / Email
![[object Object]](/_next/static/media/star-bottom.7253800d.svg)
Unlock your academic potential
Copyright © 2020–2026 A2Z Services. All Rights Reserved. Developed and managed by ZUCOL.