Foundations of Business Computing: CQUniversity Solar Panel Report
VerifiedAdded on 2020/04/21
|15
|2583
|160
Report
AI Summary
This report analyzes a proposal by CQUniversity for utilizing solar panels, examining the viability of solar energy as a renewable resource. The study assesses the efficiency of 10 different solar panels, considering factors like price, energy output, greenhouse gas reduction, and overall efficiency. Data analysis reveals that the "Fusion Catcha" solar panel has the highest overall scores, particularly in greenhouse gas reduction, despite a higher price point. The report also considers the impact of increased weightage on greenhouse gas reduction in the scoring. The conclusion recommends further data analysis to assist CQUniversity in making an informed decision regarding the best solar panel to adopt. The analysis covers various aspects, including electricity generation, value of electricity, and gross return per year, providing a comprehensive evaluation of each panel's performance and its contribution to CQUniversity's sustainability goals.

Running head: FOUNDATIONS OF BUSINESS COMPUTING
CQUniversity’s Solar Power Strategy
Name of the student
Name of the university
Author’s note
CQUniversity’s Solar Power Strategy
Name of the student
Name of the university
Author’s note
Paraphrase This Document
Need a fresh take? Get an instant paraphrase of this document with our AI Paraphraser

1FOUNDATIONS OF BUSINESS COMPUTING
Executive Summary
In the present assignment we analysed a proposal by CQUniversity for the use of Solar Panels.
The use of Solar Energy as a form of renewable energy resource is fast developing as a viable
option to the use of fossil fuels. In this task, we analysed the efficiency of 10 solar panels. The
solar panels were judged on the basis of their price, energy output, greenhouse gas reduction,
efficiency and thus their overall scores. The analysis of the data showed that the solar panel
manufactured by "Fusion Catcha" had the highest overall scores. The panels made by the
"Fusion Catcha" had a very high greenhouse gas reduction, while the gross return is low. It is
also found that the price of the organization is also high as compared to the prices of solar panels
by other organizations. The analysis found that when the weightage of greenhouse gas
reductions is increased by two or three times then also the overall score of the panels of "Fusion
Catcha" is the best. The university should analyse further data in order to make a decision
regarding the best solar panels.

2FOUNDATIONS OF BUSINESS COMPUTING
Table of Contents
Introduction......................................................................................................................................3
Discussion........................................................................................................................................3
Conclusion and Recommendations..................................................................................................3
Reference.........................................................................................................................................3
⊘ This is a preview!⊘
Do you want full access?
Subscribe today to unlock all pages.
Trusted by 1+ million students worldwide
3FOUNDATIONS OF BUSINESS COMPUTING
Introduction
Electricity is generated by the use of either of renewable or non-renewable energy
resources. The non-renewable sources of electricity generation are coal, fossil fuels and nuclear
materials. The non-renewable energy resources are limited in nature and it is viable to produce
electricity from these resources till the time it is economically viable. On the other hand
renewable energy resources are wind, solar, hydel, geothermal and biomass. There is an
unlimited amount of renewable energy resources.
Solar Power refers to the generation of electricity from sunlight.
Herein, the analyst has analysed the solar power strategy for CQUniversity. To
investigate the strategy, solar panels of 10 different organizations were chosen. Data was
collected for the output capacity of the solar panels based on the length and width of the panels.
The prices ($) of the solar panels was also collected.
The following parameters have been calculated to compare the solar panels.
Area (sqM) of different solar panels was calculated. To calculate the area Length and
Width of the Solar Panels were multiplied.
Electricity Generated (KW/Year) was calculated by multiplying the output of each solar
panel with the number of days in a year (i.e., 365), the number of hours of sunlight per day (7).
The above result was divided by 1000 to get the Electricity generated in a year.
The Value of Electricity generated ($/Year) was calculated by multiplying the Electricity
Generated per year with price of Electricity (0.15 $/KWh).
The Efficiency (%) of the solar panels of different organizations was calculated from the
output capacity (W) of different solar panels by 1000 times the area of the solar panels.
Greenhouse Gas Reductions (Tons/Year) is calculated as the thousandth part of product
of Electricity generated in one year and Greenhouse reduction factor.
The Gross Return Per Year is the ratio of value of electricity generated per year to the
price of the solar panel.
The sun is the source of Solar Energy. The most important benefit of using solar energy
is that it is a form of renewable energy. Solar energy is available throughout the day and can be
harnessed from around the earth. Moreover, unlike other forms of energy, the electricity bill for
the use of solar power would be less. The amount of power saved would be directly proportional
to the size of the solar panels. In addition, to generating electricity, solar power can also be used
to heat the rooms. Further, solar power can also be used in areas which are inaccessible to energy
Paraphrase This Document
Need a fresh take? Get an instant paraphrase of this document with our AI Paraphraser
4FOUNDATIONS OF BUSINESS COMPUTING
grids. The cost of maintaining of solar energy panels is also very less. The only problem with
solar panels is that they should be cleaned regularly. The solar panels have no moving parts.
Hence the upkeep of Solar Panels is very cheap.
In the present report we analyse the efficiencies of solar panels based on greenhouse gas
reductions, gross return per year and the price of the solar panels. This would aid CQUniversity
in deciding the best solar panel. The use of solar panels by CQUniversity is a step towards its
social responsibility. The use of Solar panels would stimulate the economy of the university. The
generation of power through solar energy is less expensive as compared to the use of fossil fuels.
The use of Solar panel would aid in the reduction of the energy bill of the university. In the long
run, the difference in electricity bill can help the university in diverting the money being spent
for purchase of electricity to doing research in other fields.
Moreover, since solar panels do not emit polluting air, hence it is a clean form of energy.
Thus through the use of Solar energy the university would help in cleaning the atmosphere in its
vicinity. Research has found that the use of fossil fuels for generating electricity is responsible
for global warming. As a social responsibility thus the university would not only clean the
atmosphere but also reduce the emission of greenhouse gases.
Discussion
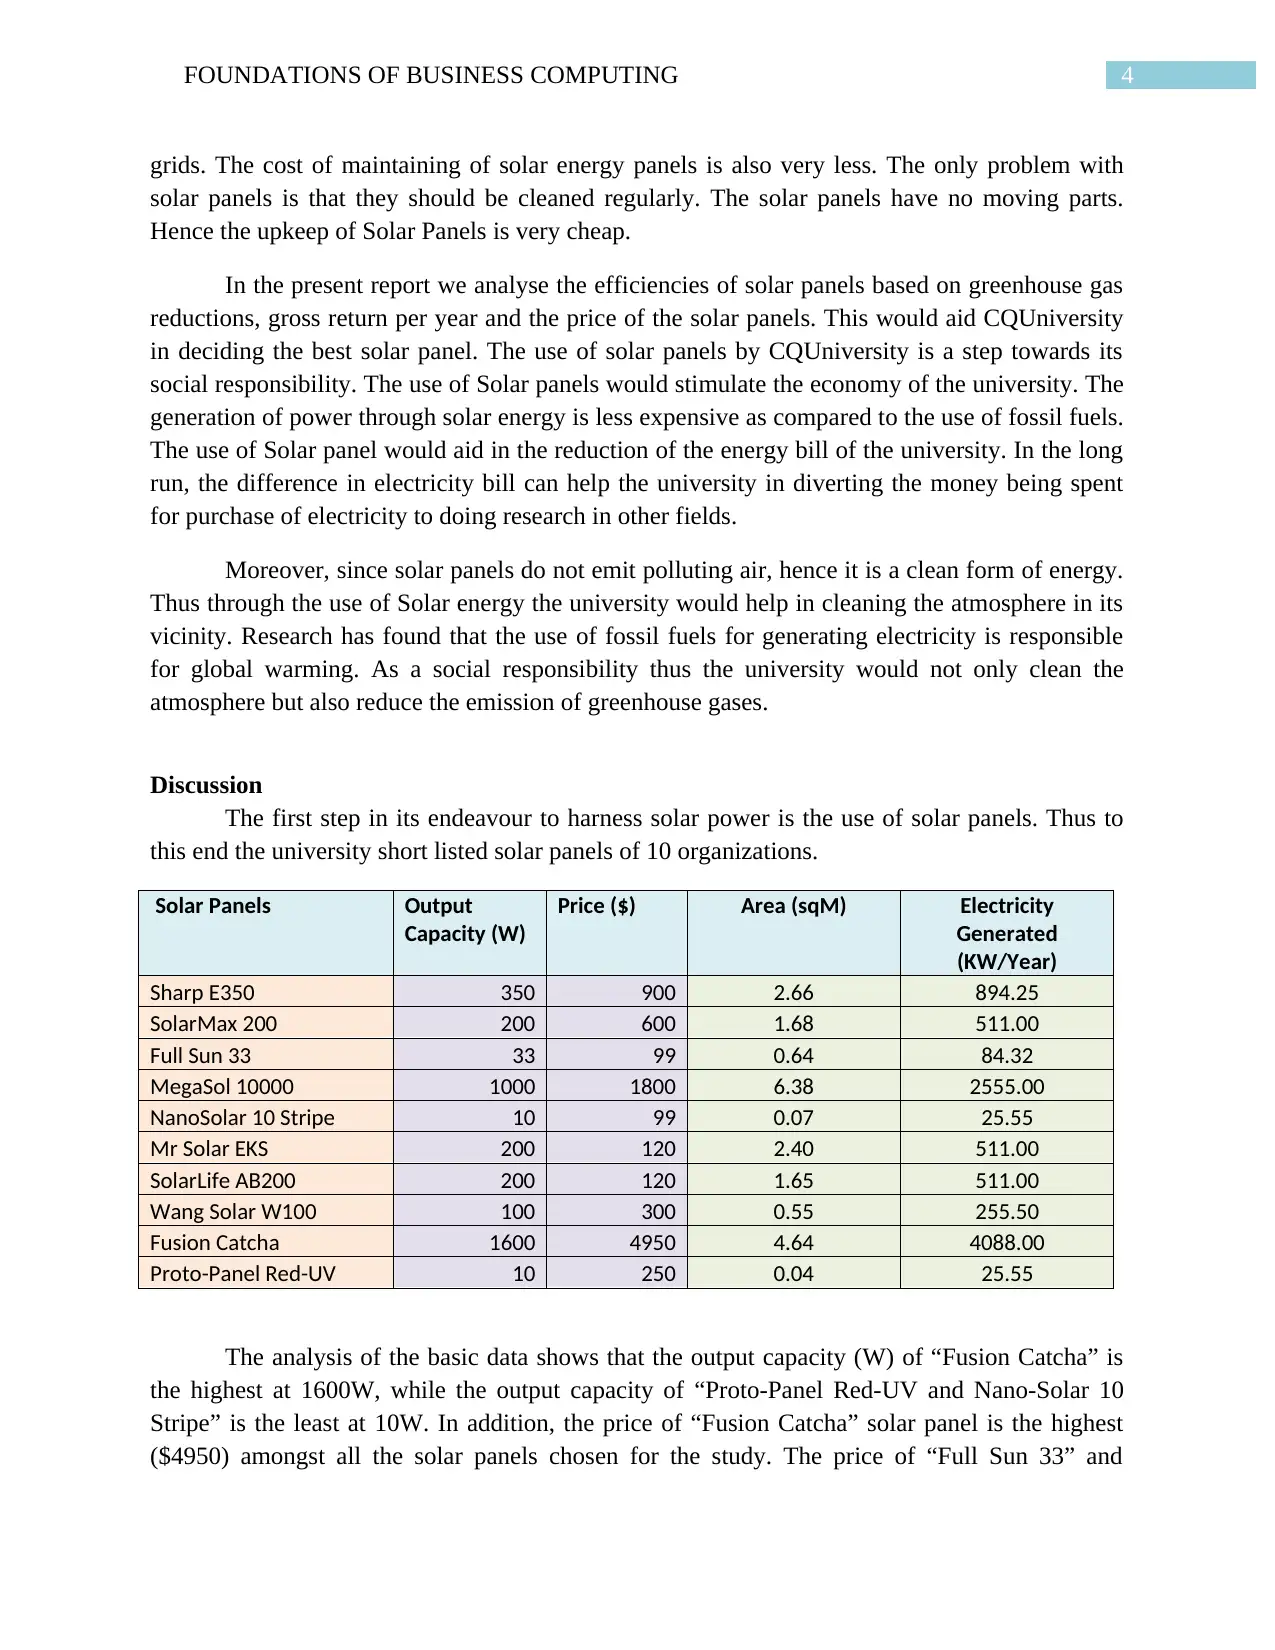
The first step in its endeavour to harness solar power is the use of solar panels. Thus to
this end the university short listed solar panels of 10 organizations.
Solar Panels Output
Capacity (W)
Price ($) Area (sqM) Electricity
Generated
(KW/Year)
Sharp E350 350 900 2.66 894.25
SolarMax 200 200 600 1.68 511.00
Full Sun 33 33 99 0.64 84.32
MegaSol 10000 1000 1800 6.38 2555.00
NanoSolar 10 Stripe 10 99 0.07 25.55
Mr Solar EKS 200 120 2.40 511.00
SolarLife AB200 200 120 1.65 511.00
Wang Solar W100 100 300 0.55 255.50
Fusion Catcha 1600 4950 4.64 4088.00
Proto-Panel Red-UV 10 250 0.04 25.55
The analysis of the basic data shows that the output capacity (W) of “Fusion Catcha” is
the highest at 1600W, while the output capacity of “Proto-Panel Red-UV and Nano-Solar 10
Stripe” is the least at 10W. In addition, the price of “Fusion Catcha” solar panel is the highest
($4950) amongst all the solar panels chosen for the study. The price of “Full Sun 33” and
grids. The cost of maintaining of solar energy panels is also very less. The only problem with
solar panels is that they should be cleaned regularly. The solar panels have no moving parts.
Hence the upkeep of Solar Panels is very cheap.
In the present report we analyse the efficiencies of solar panels based on greenhouse gas
reductions, gross return per year and the price of the solar panels. This would aid CQUniversity
in deciding the best solar panel. The use of solar panels by CQUniversity is a step towards its
social responsibility. The use of Solar panels would stimulate the economy of the university. The
generation of power through solar energy is less expensive as compared to the use of fossil fuels.
The use of Solar panel would aid in the reduction of the energy bill of the university. In the long
run, the difference in electricity bill can help the university in diverting the money being spent
for purchase of electricity to doing research in other fields.
Moreover, since solar panels do not emit polluting air, hence it is a clean form of energy.
Thus through the use of Solar energy the university would help in cleaning the atmosphere in its
vicinity. Research has found that the use of fossil fuels for generating electricity is responsible
for global warming. As a social responsibility thus the university would not only clean the
atmosphere but also reduce the emission of greenhouse gases.
Discussion
The first step in its endeavour to harness solar power is the use of solar panels. Thus to
this end the university short listed solar panels of 10 organizations.
Solar Panels Output
Capacity (W)
Price ($) Area (sqM) Electricity
Generated
(KW/Year)
Sharp E350 350 900 2.66 894.25
SolarMax 200 200 600 1.68 511.00
Full Sun 33 33 99 0.64 84.32
MegaSol 10000 1000 1800 6.38 2555.00
NanoSolar 10 Stripe 10 99 0.07 25.55
Mr Solar EKS 200 120 2.40 511.00
SolarLife AB200 200 120 1.65 511.00
Wang Solar W100 100 300 0.55 255.50
Fusion Catcha 1600 4950 4.64 4088.00
Proto-Panel Red-UV 10 250 0.04 25.55
The analysis of the basic data shows that the output capacity (W) of “Fusion Catcha” is
the highest at 1600W, while the output capacity of “Proto-Panel Red-UV and Nano-Solar 10
Stripe” is the least at 10W. In addition, the price of “Fusion Catcha” solar panel is the highest
($4950) amongst all the solar panels chosen for the study. The price of “Full Sun 33” and
5FOUNDATIONS OF BUSINESS COMPUTING
“NanoSolar 10 Stripe” is the lowest ($99). MegaSol 10000 has the highest surface Area of all the
solar panels (6.38 sq.M), while the surface area of Proto-Panel Red-UV is the lowest (0.04
sq.M). Taking into consideration that we get solar power in 365 days of a year, 7 hours of
sunlight per day, the electricity generated by “Fusion Catcha” is the highest at 4088KW/Year.
On the other hand, the electricity generated by “Nano-Stripe 10” and “Proto-Panel Red-UV” is
the lowest at 25.55 KW/Year.
Solar Panels Value of Electricity
Generated ($/Year)
Efficiency (%)
Sharp E350 $ 134.14 13%
SolarMax 200 $ 76.65 12%
Full Sun 33 $ 12.65 5%
MegaSol 10000 $ 383.25 16%
NanoSolar 10 Stripe $ 3.83 14%
Mr Solar EKS $ 76.65 8%
SolarLife AB200 $ 76.65 12%
Wang Solar W100 $ 38.33 18%
Fusion Catcha $ 613.20 34%
Proto-Panel Red-UV $ 3.83 27%
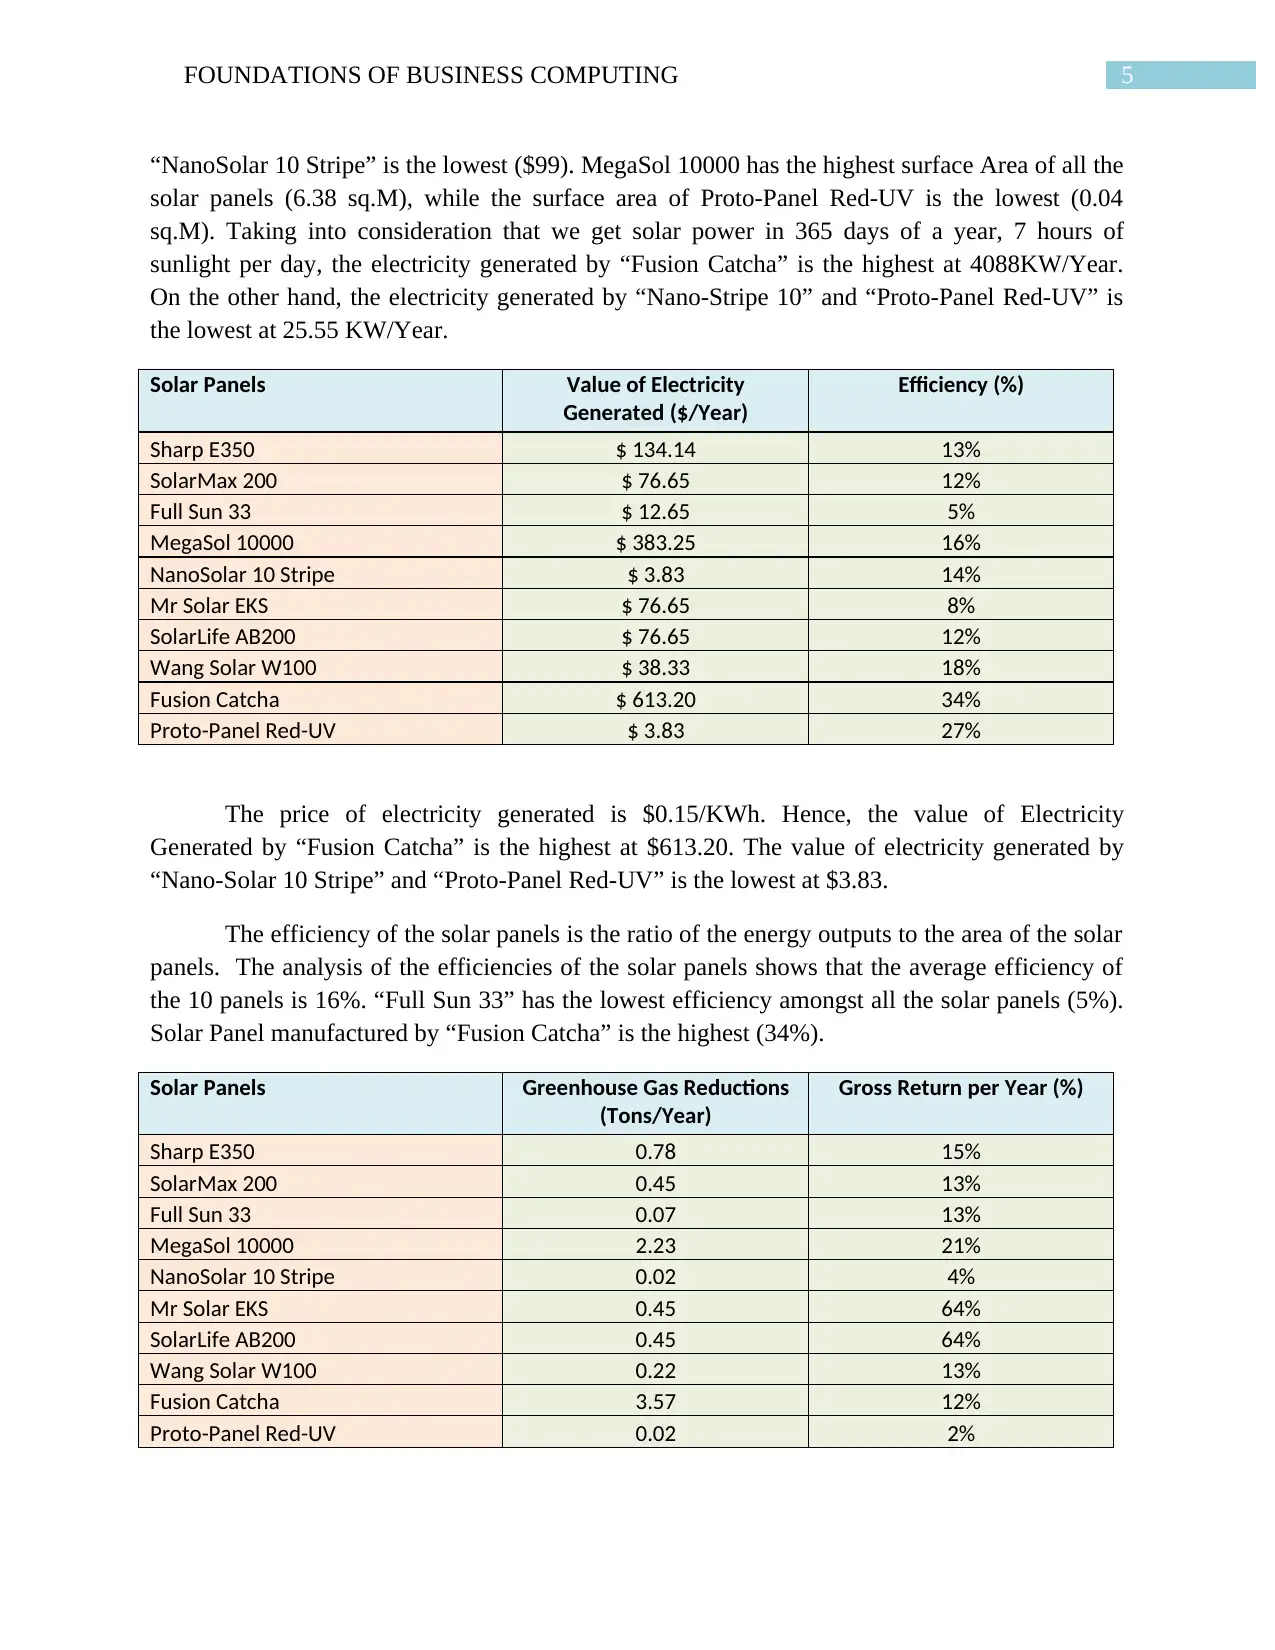
The price of electricity generated is $0.15/KWh. Hence, the value of Electricity
Generated by “Fusion Catcha” is the highest at $613.20. The value of electricity generated by
“Nano-Solar 10 Stripe” and “Proto-Panel Red-UV” is the lowest at $3.83.
The efficiency of the solar panels is the ratio of the energy outputs to the area of the solar
panels. The analysis of the efficiencies of the solar panels shows that the average efficiency of
the 10 panels is 16%. “Full Sun 33” has the lowest efficiency amongst all the solar panels (5%).
Solar Panel manufactured by “Fusion Catcha” is the highest (34%).
Solar Panels Greenhouse Gas Reductions
(Tons/Year)
Gross Return per Year (%)
Sharp E350 0.78 15%
SolarMax 200 0.45 13%
Full Sun 33 0.07 13%
MegaSol 10000 2.23 21%
NanoSolar 10 Stripe 0.02 4%
Mr Solar EKS 0.45 64%
SolarLife AB200 0.45 64%
Wang Solar W100 0.22 13%
Fusion Catcha 3.57 12%
Proto-Panel Red-UV 0.02 2%
“NanoSolar 10 Stripe” is the lowest ($99). MegaSol 10000 has the highest surface Area of all the
solar panels (6.38 sq.M), while the surface area of Proto-Panel Red-UV is the lowest (0.04
sq.M). Taking into consideration that we get solar power in 365 days of a year, 7 hours of
sunlight per day, the electricity generated by “Fusion Catcha” is the highest at 4088KW/Year.
On the other hand, the electricity generated by “Nano-Stripe 10” and “Proto-Panel Red-UV” is
the lowest at 25.55 KW/Year.
Solar Panels Value of Electricity
Generated ($/Year)
Efficiency (%)
Sharp E350 $ 134.14 13%
SolarMax 200 $ 76.65 12%
Full Sun 33 $ 12.65 5%
MegaSol 10000 $ 383.25 16%
NanoSolar 10 Stripe $ 3.83 14%
Mr Solar EKS $ 76.65 8%
SolarLife AB200 $ 76.65 12%
Wang Solar W100 $ 38.33 18%
Fusion Catcha $ 613.20 34%
Proto-Panel Red-UV $ 3.83 27%
The price of electricity generated is $0.15/KWh. Hence, the value of Electricity
Generated by “Fusion Catcha” is the highest at $613.20. The value of electricity generated by
“Nano-Solar 10 Stripe” and “Proto-Panel Red-UV” is the lowest at $3.83.
The efficiency of the solar panels is the ratio of the energy outputs to the area of the solar
panels. The analysis of the efficiencies of the solar panels shows that the average efficiency of
the 10 panels is 16%. “Full Sun 33” has the lowest efficiency amongst all the solar panels (5%).
Solar Panel manufactured by “Fusion Catcha” is the highest (34%).
Solar Panels Greenhouse Gas Reductions
(Tons/Year)
Gross Return per Year (%)
Sharp E350 0.78 15%
SolarMax 200 0.45 13%
Full Sun 33 0.07 13%
MegaSol 10000 2.23 21%
NanoSolar 10 Stripe 0.02 4%
Mr Solar EKS 0.45 64%
SolarLife AB200 0.45 64%
Wang Solar W100 0.22 13%
Fusion Catcha 3.57 12%
Proto-Panel Red-UV 0.02 2%
⊘ This is a preview!⊘
Do you want full access?
Subscribe today to unlock all pages.
Trusted by 1+ million students worldwide
6FOUNDATIONS OF BUSINESS COMPUTING
Sharp E350
SolarMax 200
Full Sun 33
MegaSol 10000
NanoSolar 10 Stripe
Mr Solar EKS
SolarLife AB200
Wang Solar W100
Fusion Catcha
Proto-Panel Red-UV
0.00
0.50
1.00
1.50
2.00
2.50
3.00
3.50
4.00
Greenhouse Gas Reductions of Solar Panels
Solar Panels
Greenhouse gas reductions
(Tons/year)
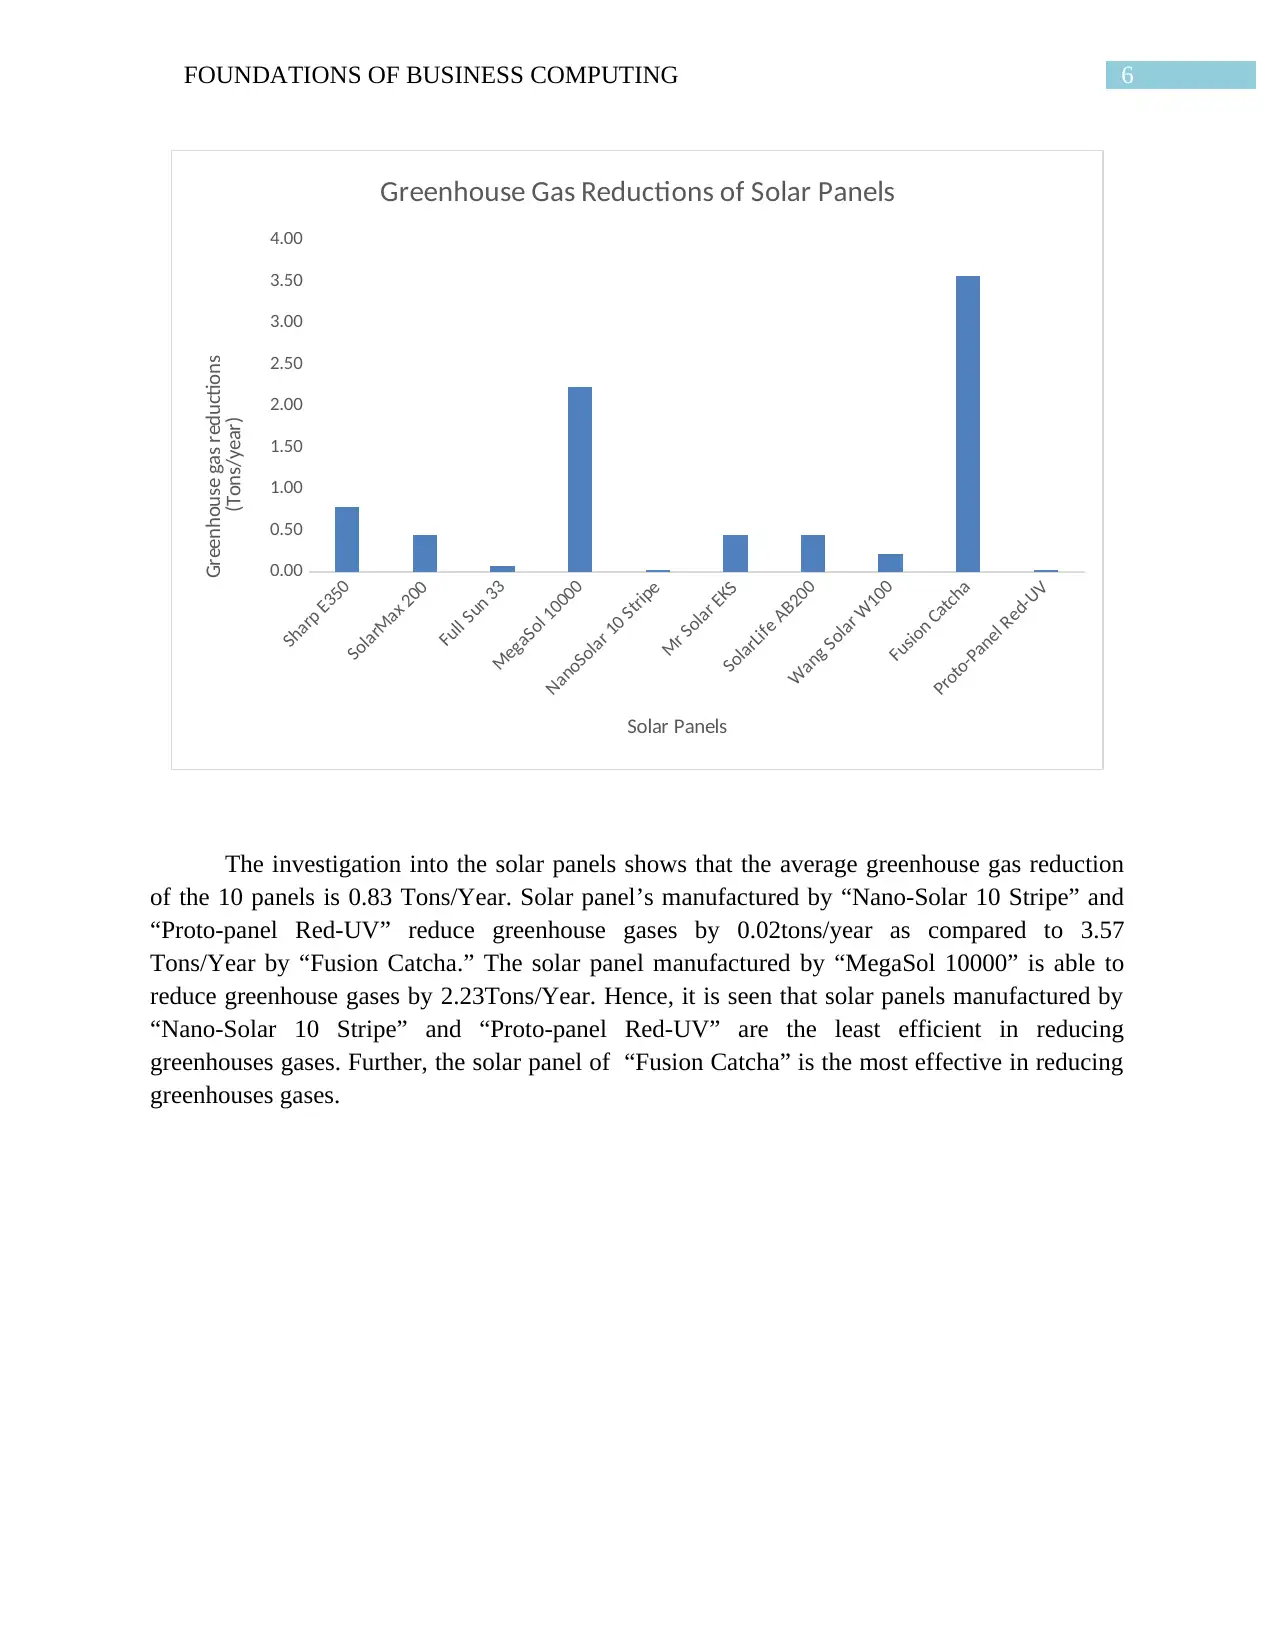
The investigation into the solar panels shows that the average greenhouse gas reduction
of the 10 panels is 0.83 Tons/Year. Solar panel’s manufactured by “Nano-Solar 10 Stripe” and
“Proto-panel Red-UV” reduce greenhouse gases by 0.02tons/year as compared to 3.57
Tons/Year by “Fusion Catcha.” The solar panel manufactured by “MegaSol 10000” is able to
reduce greenhouse gases by 2.23Tons/Year. Hence, it is seen that solar panels manufactured by
“Nano-Solar 10 Stripe” and “Proto-panel Red-UV” are the least efficient in reducing
greenhouses gases. Further, the solar panel of “Fusion Catcha” is the most effective in reducing
greenhouses gases.
Sharp E350
SolarMax 200
Full Sun 33
MegaSol 10000
NanoSolar 10 Stripe
Mr Solar EKS
SolarLife AB200
Wang Solar W100
Fusion Catcha
Proto-Panel Red-UV
0.00
0.50
1.00
1.50
2.00
2.50
3.00
3.50
4.00
Greenhouse Gas Reductions of Solar Panels
Solar Panels
Greenhouse gas reductions
(Tons/year)
The investigation into the solar panels shows that the average greenhouse gas reduction
of the 10 panels is 0.83 Tons/Year. Solar panel’s manufactured by “Nano-Solar 10 Stripe” and
“Proto-panel Red-UV” reduce greenhouse gases by 0.02tons/year as compared to 3.57
Tons/Year by “Fusion Catcha.” The solar panel manufactured by “MegaSol 10000” is able to
reduce greenhouse gases by 2.23Tons/Year. Hence, it is seen that solar panels manufactured by
“Nano-Solar 10 Stripe” and “Proto-panel Red-UV” are the least efficient in reducing
greenhouses gases. Further, the solar panel of “Fusion Catcha” is the most effective in reducing
greenhouses gases.
Paraphrase This Document
Need a fresh take? Get an instant paraphrase of this document with our AI Paraphraser
7FOUNDATIONS OF BUSINESS COMPUTING
Sharp E350
SolarMax 200
Full Sun 33
MegaSol 10000
NanoSolar 10 Stripe
Mr Solar EKS
SolarLife AB200
Wang Solar W100
Fusion Catcha
Proto-Panel Red-UV
0%
10%
20%
30%
40%
50%
60%
70%
Gross Return per Year (%) of Solar Panels
Solar Panels
Gross Return per Year
(%)
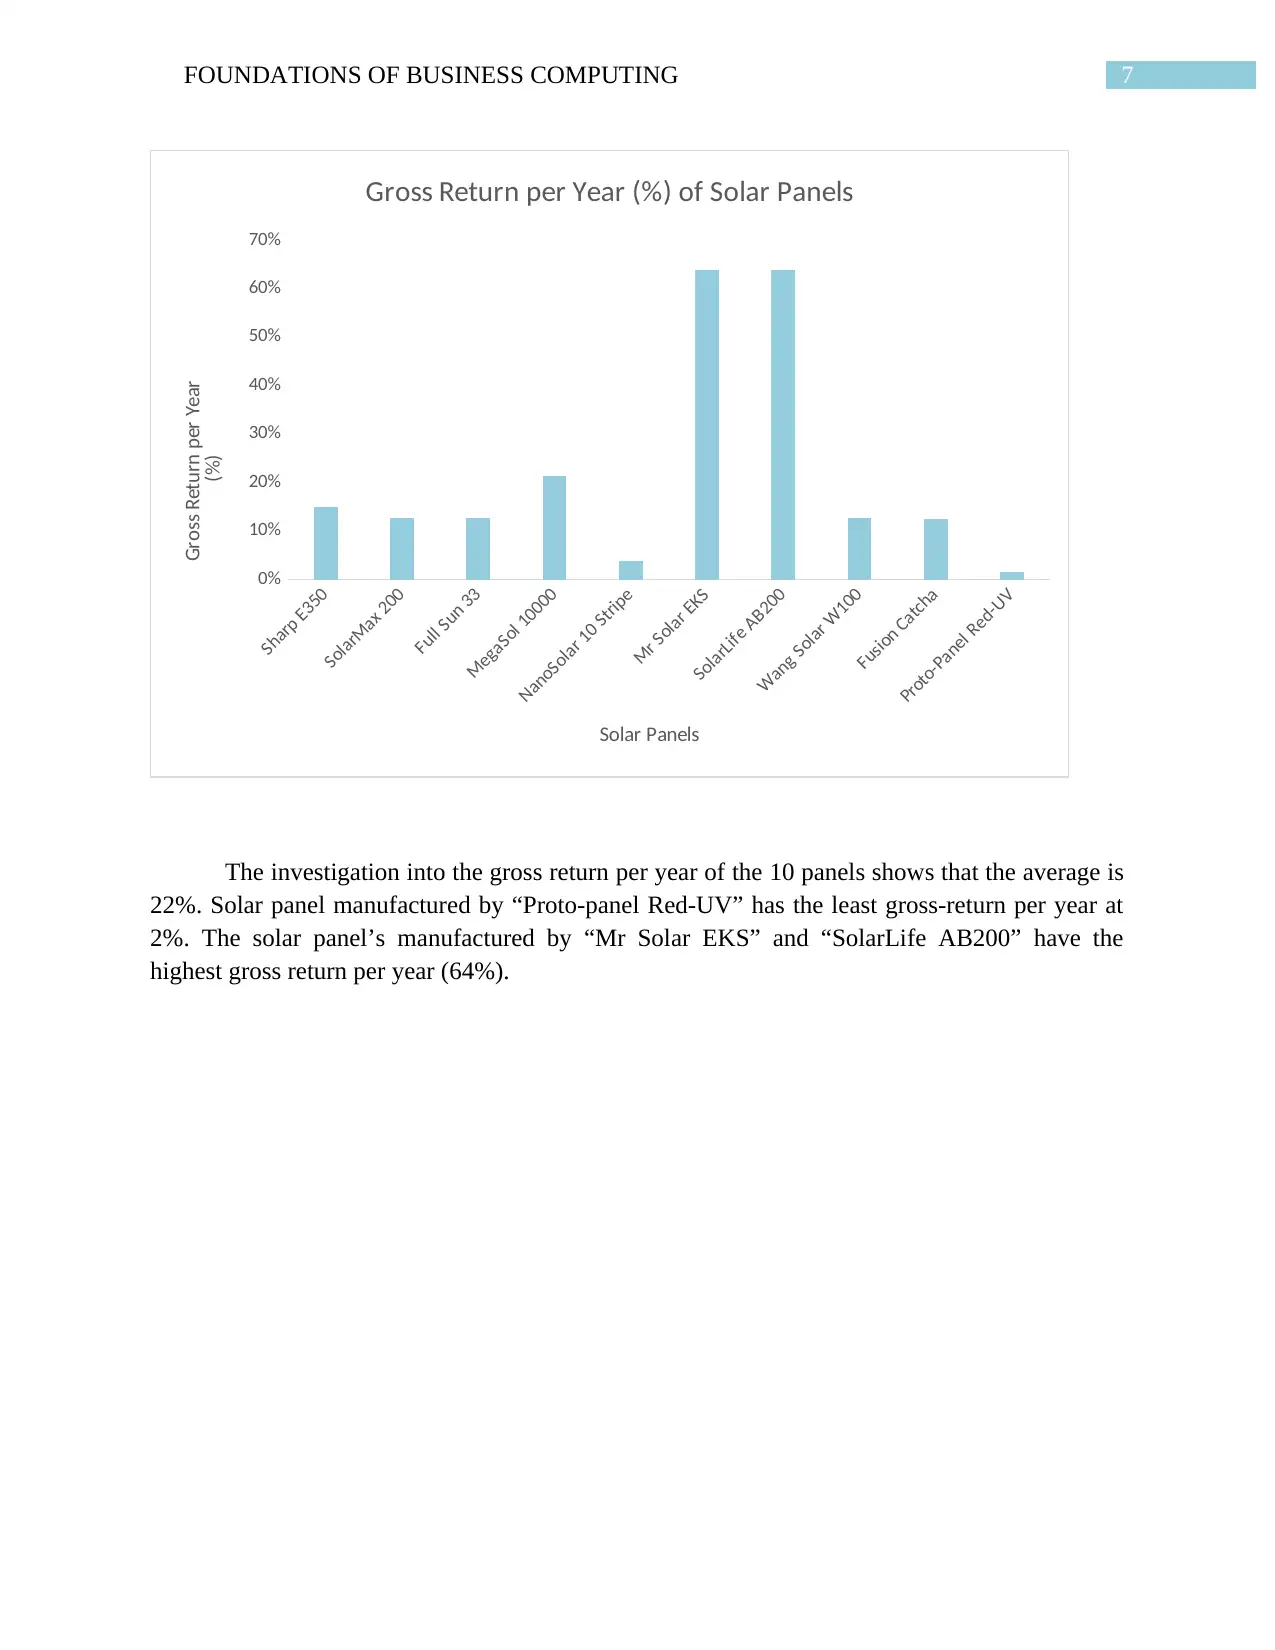
The investigation into the gross return per year of the 10 panels shows that the average is
22%. Solar panel manufactured by “Proto-panel Red-UV” has the least gross-return per year at
2%. The solar panel’s manufactured by “Mr Solar EKS” and “SolarLife AB200” have the
highest gross return per year (64%).
Sharp E350
SolarMax 200
Full Sun 33
MegaSol 10000
NanoSolar 10 Stripe
Mr Solar EKS
SolarLife AB200
Wang Solar W100
Fusion Catcha
Proto-Panel Red-UV
0%
10%
20%
30%
40%
50%
60%
70%
Gross Return per Year (%) of Solar Panels
Solar Panels
Gross Return per Year
(%)
The investigation into the gross return per year of the 10 panels shows that the average is
22%. Solar panel manufactured by “Proto-panel Red-UV” has the least gross-return per year at
2%. The solar panel’s manufactured by “Mr Solar EKS” and “SolarLife AB200” have the
highest gross return per year (64%).
8FOUNDATIONS OF BUSINESS COMPUTING
Sharp E350
SolarMax 200
Full Sun 33
MegaSol 10000
NanoSolar 10 Stripe
Mr Solar EKS
SolarLife AB200
Wang Solar W100
Fusion Catcha
Proto-Panel Red-UV
0.00
1.00
2.00
3.00
4.00
5.00
6.00
7.00
0.00
0.50
1.00
1.50
2.00
2.50
3.00
3.50
4.00
Relation of Area to Greenhouse Gas Reductions
Area (sqM) Greenhouse Gas Reductions (Tons/Year)
Solar Panels
Area (sq. M.)
Greenhouse Gas Reductions
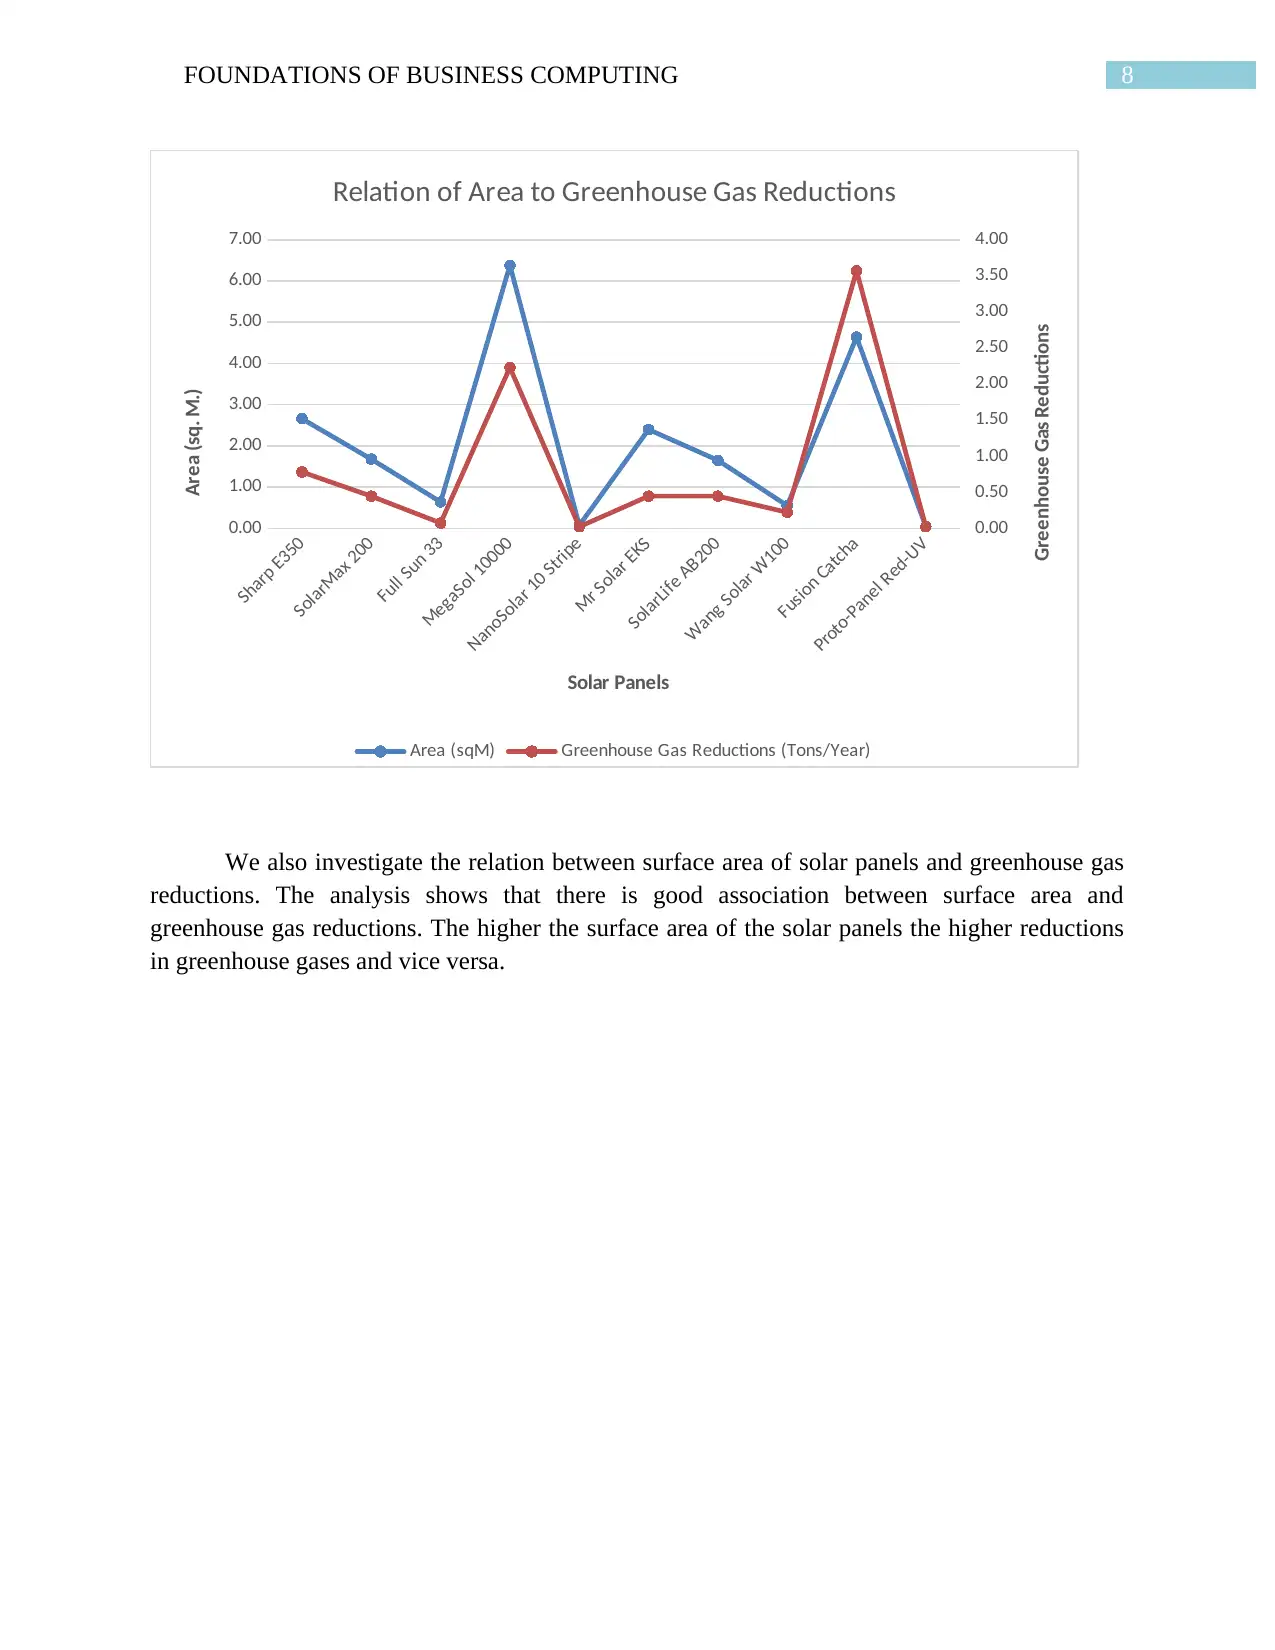
We also investigate the relation between surface area of solar panels and greenhouse gas
reductions. The analysis shows that there is good association between surface area and
greenhouse gas reductions. The higher the surface area of the solar panels the higher reductions
in greenhouse gases and vice versa.
Sharp E350
SolarMax 200
Full Sun 33
MegaSol 10000
NanoSolar 10 Stripe
Mr Solar EKS
SolarLife AB200
Wang Solar W100
Fusion Catcha
Proto-Panel Red-UV
0.00
1.00
2.00
3.00
4.00
5.00
6.00
7.00
0.00
0.50
1.00
1.50
2.00
2.50
3.00
3.50
4.00
Relation of Area to Greenhouse Gas Reductions
Area (sqM) Greenhouse Gas Reductions (Tons/Year)
Solar Panels
Area (sq. M.)
Greenhouse Gas Reductions
We also investigate the relation between surface area of solar panels and greenhouse gas
reductions. The analysis shows that there is good association between surface area and
greenhouse gas reductions. The higher the surface area of the solar panels the higher reductions
in greenhouse gases and vice versa.
⊘ This is a preview!⊘
Do you want full access?
Subscribe today to unlock all pages.
Trusted by 1+ million students worldwide
9FOUNDATIONS OF BUSINESS COMPUTING
Sharp E350
SolarMax 200
Full Sun 33
MegaSol 10000
NanoSolar 10 Stripe
Mr Solar EKS
SolarLife AB200
Wang Solar W100
Fusion Catcha
Proto-Panel Red-UV
0
1000
2000
3000
4000
5000
6000
0.00
0.50
1.00
1.50
2.00
2.50
3.00
3.50
4.00
Relation of Price to Greenhouse Gas Reductions
Price ($) Greenhouse Gas Reductions (Tons/Year)
Solar Panels
Price ($)
Greenhouse Gas Reductions
(Tons/Year)
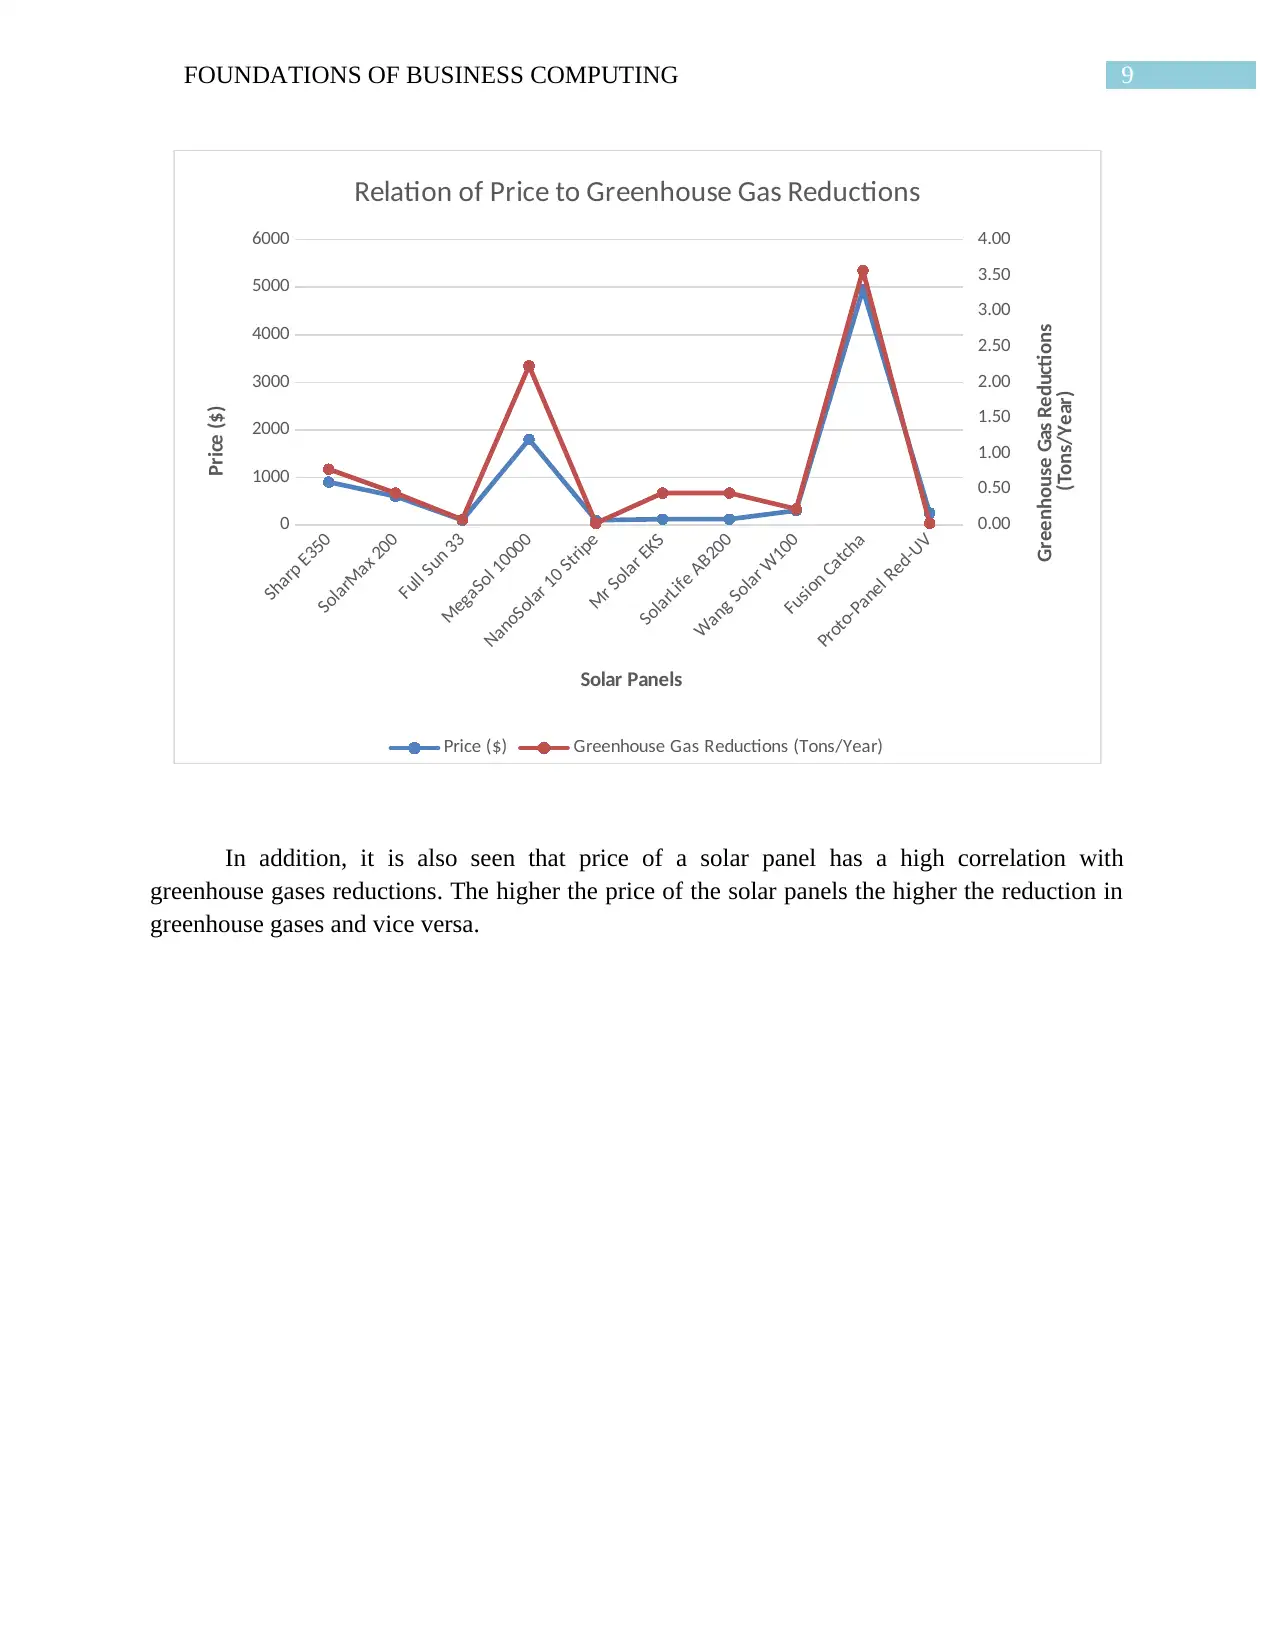
In addition, it is also seen that price of a solar panel has a high correlation with
greenhouse gases reductions. The higher the price of the solar panels the higher the reduction in
greenhouse gases and vice versa.
Sharp E350
SolarMax 200
Full Sun 33
MegaSol 10000
NanoSolar 10 Stripe
Mr Solar EKS
SolarLife AB200
Wang Solar W100
Fusion Catcha
Proto-Panel Red-UV
0
1000
2000
3000
4000
5000
6000
0.00
0.50
1.00
1.50
2.00
2.50
3.00
3.50
4.00
Relation of Price to Greenhouse Gas Reductions
Price ($) Greenhouse Gas Reductions (Tons/Year)
Solar Panels
Price ($)
Greenhouse Gas Reductions
(Tons/Year)
In addition, it is also seen that price of a solar panel has a high correlation with
greenhouse gases reductions. The higher the price of the solar panels the higher the reduction in
greenhouse gases and vice versa.
Paraphrase This Document
Need a fresh take? Get an instant paraphrase of this document with our AI Paraphraser
10FOUNDATIONS OF BUSINESS COMPUTING
Sharp E350
SolarMax 200
Full Sun 33
MegaSol 10000
NanoSolar 10 Stripe
Mr Solar EKS
SolarLife AB200
Wang Solar W100
Fusion Catcha
Proto-Panel Red-UV
0.00
1.00
2.00
3.00
4.00
5.00
6.00
7.00
0%
10%
20%
30%
40%
50%
60%
70%
Surface Area vs Gross Return per Year of Solar Panels
Area (sqM) Gross Return per Year (%)
Solar Panels
Surface Area (sq. M.)
Gross Return per Year (%)
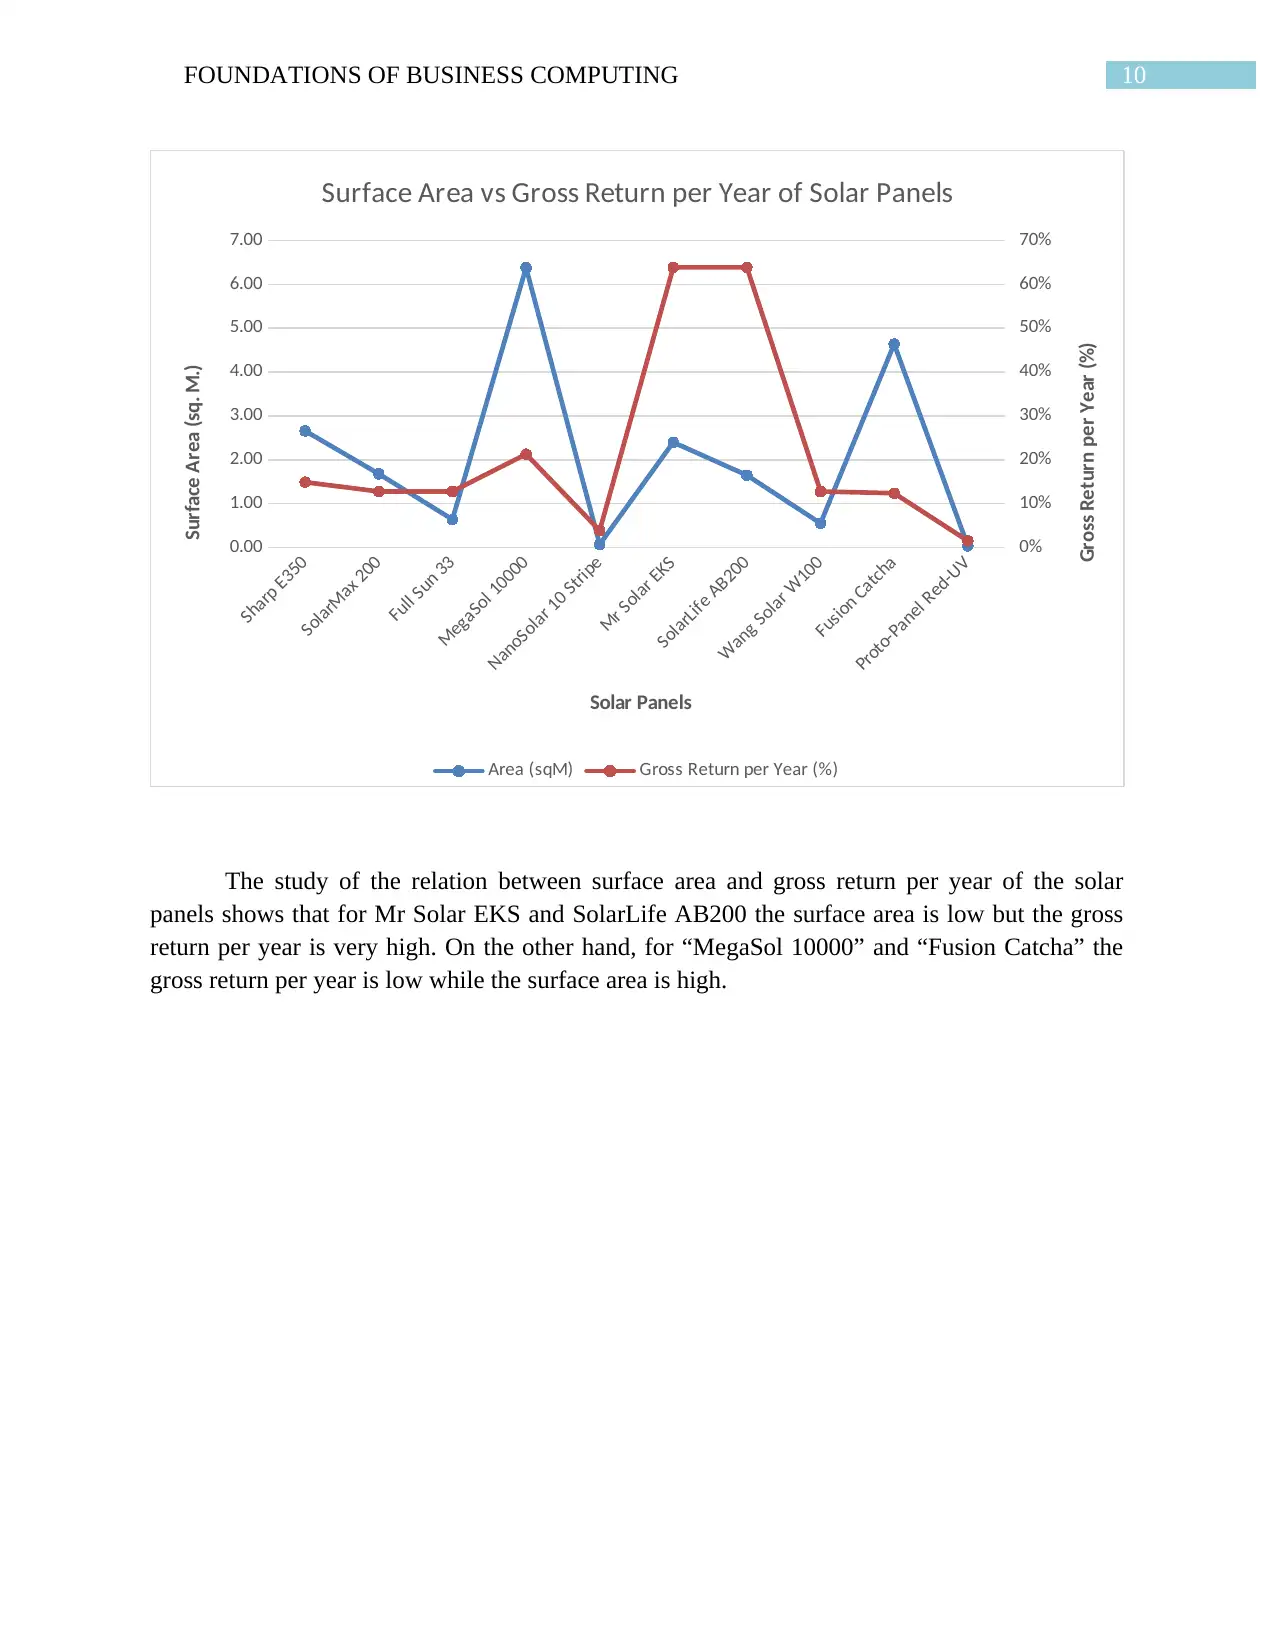
The study of the relation between surface area and gross return per year of the solar
panels shows that for Mr Solar EKS and SolarLife AB200 the surface area is low but the gross
return per year is very high. On the other hand, for “MegaSol 10000” and “Fusion Catcha” the
gross return per year is low while the surface area is high.
Sharp E350
SolarMax 200
Full Sun 33
MegaSol 10000
NanoSolar 10 Stripe
Mr Solar EKS
SolarLife AB200
Wang Solar W100
Fusion Catcha
Proto-Panel Red-UV
0.00
1.00
2.00
3.00
4.00
5.00
6.00
7.00
0%
10%
20%
30%
40%
50%
60%
70%
Surface Area vs Gross Return per Year of Solar Panels
Area (sqM) Gross Return per Year (%)
Solar Panels
Surface Area (sq. M.)
Gross Return per Year (%)
The study of the relation between surface area and gross return per year of the solar
panels shows that for Mr Solar EKS and SolarLife AB200 the surface area is low but the gross
return per year is very high. On the other hand, for “MegaSol 10000” and “Fusion Catcha” the
gross return per year is low while the surface area is high.
11FOUNDATIONS OF BUSINESS COMPUTING
Sharp E350
SolarMax 200
Full Sun 33
MegaSol 10000
NanoSolar 10 Stripe
Mr Solar EKS
SolarLife AB200
Wang Solar W100
Fusion Catcha
Proto-Panel Red-UV
0
1000
2000
3000
4000
5000
6000
0%
10%
20%
30%
40%
50%
60%
70%
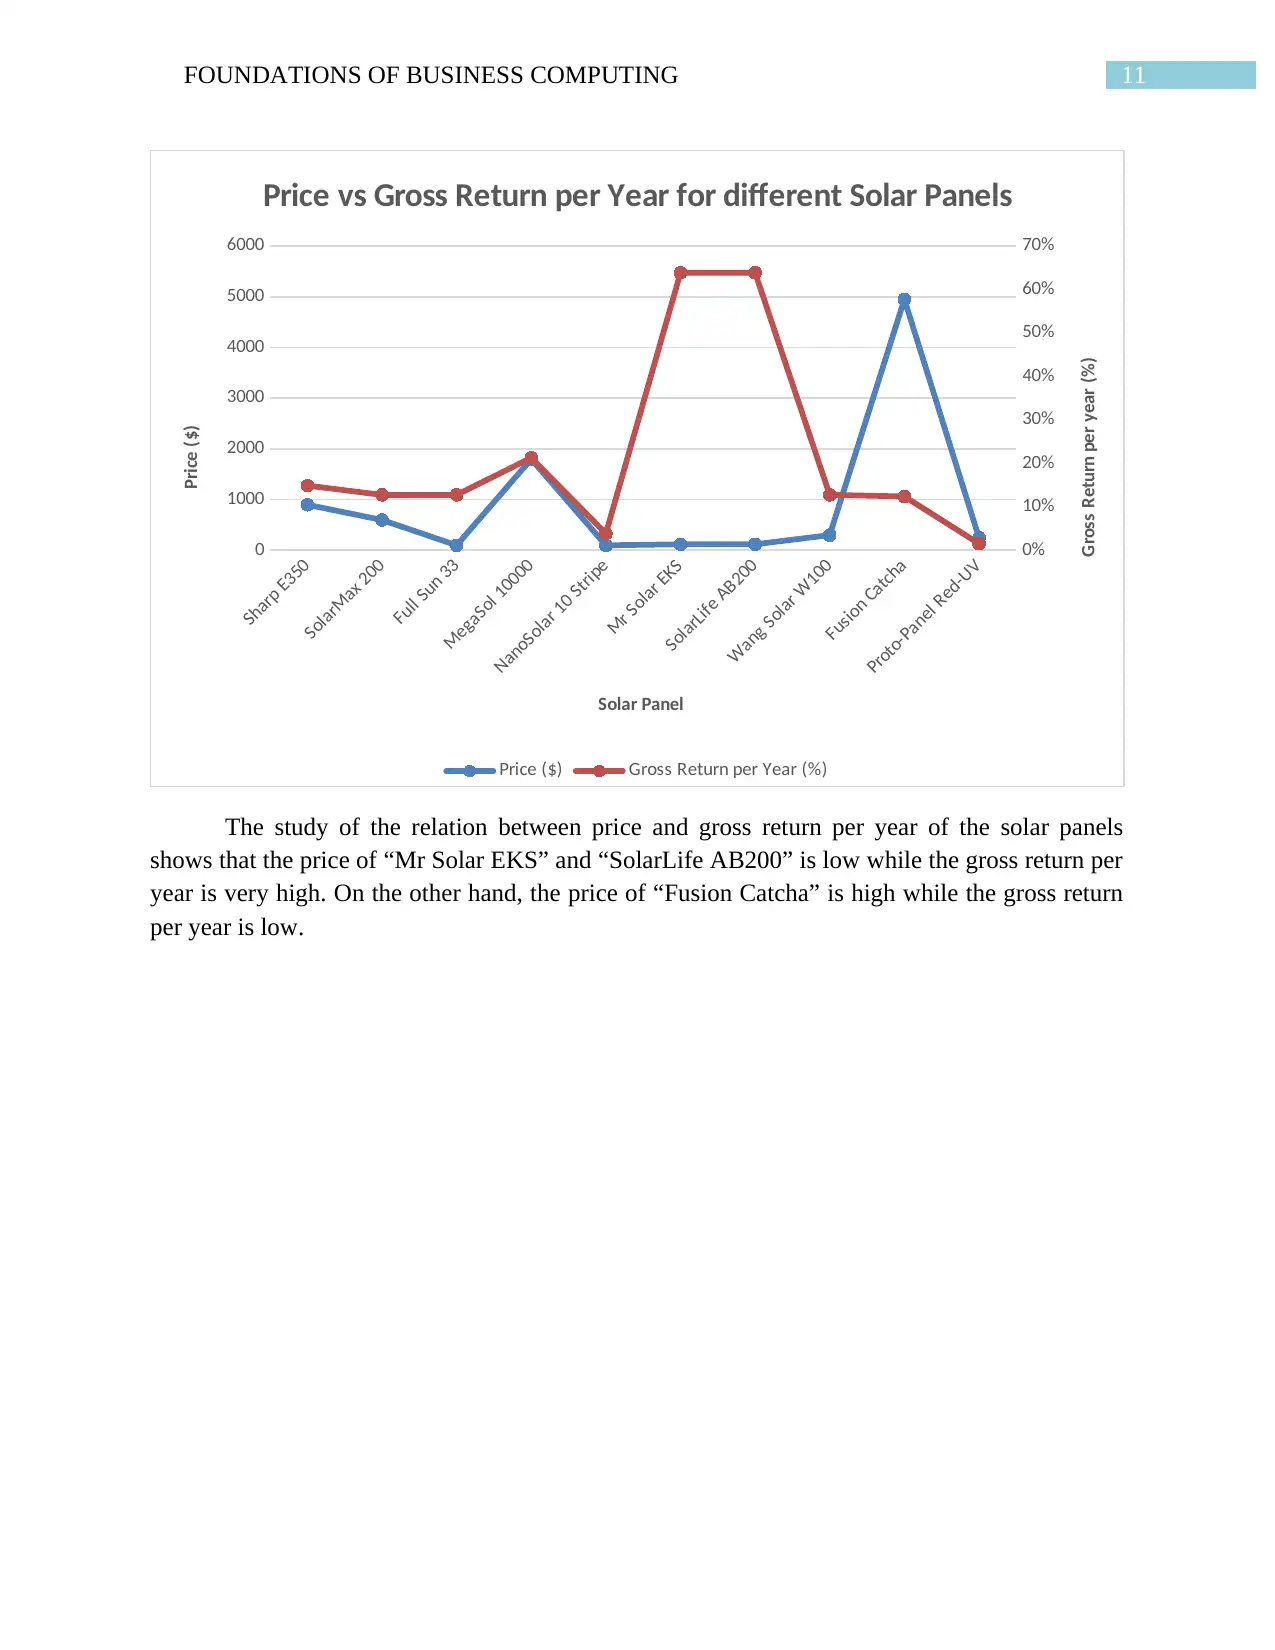
Price vs Gross Return per Year for different Solar Panels
Price ($) Gross Return per Year (%)
Solar Panel
Price ($)
Gross Return per year (%)
The study of the relation between price and gross return per year of the solar panels
shows that the price of “Mr Solar EKS” and “SolarLife AB200” is low while the gross return per
year is very high. On the other hand, the price of “Fusion Catcha” is high while the gross return
per year is low.
Sharp E350
SolarMax 200
Full Sun 33
MegaSol 10000
NanoSolar 10 Stripe
Mr Solar EKS
SolarLife AB200
Wang Solar W100
Fusion Catcha
Proto-Panel Red-UV
0
1000
2000
3000
4000
5000
6000
0%
10%
20%
30%
40%
50%
60%
70%
Price vs Gross Return per Year for different Solar Panels
Price ($) Gross Return per Year (%)
Solar Panel
Price ($)
Gross Return per year (%)
The study of the relation between price and gross return per year of the solar panels
shows that the price of “Mr Solar EKS” and “SolarLife AB200” is low while the gross return per
year is very high. On the other hand, the price of “Fusion Catcha” is high while the gross return
per year is low.
⊘ This is a preview!⊘
Do you want full access?
Subscribe today to unlock all pages.
Trusted by 1+ million students worldwide
1 out of 15
Related Documents


Your All-in-One AI-Powered Toolkit for Academic Success.
+13062052269
info@desklib.com
Available 24*7 on WhatsApp / Email
![[object Object]](/_next/static/media/star-bottom.7253800d.svg)
Unlock your academic potential
Copyright © 2020–2026 A2Z Services. All Rights Reserved. Developed and managed by ZUCOL.