NURBN1004: Fieldwork Analysis & Cranbourne Community Health Profile
VerifiedAdded on 2023/06/10
|20
|8484
|52
Report
AI Summary
This report provides a comprehensive community health profile of Cranbourne, focusing on its history, demographics, culture, environment, and accessibility. The analysis incorporates fieldwork observations, research data, and comparisons with LGA and state-level statistics. Key elements explored include the historical context, population demographics (age, gender, marital status), cultural and religious diversity, and the physical environment (water management, waste disposal). The report identifies links between these elements and health outcomes, highlighting the influence of cultural diversity on healthcare needs and the impact of demographic factors on resource allocation. The study emphasizes the importance of understanding community history, demographics, and religion in determining health status and formulating effective intervention policies. The document is available on Desklib, a platform offering study tools and resources for students.
NURBN1004: Assessment 1
Fieldwork workbook and community profile
[Cranbourne community]
Student Name: [enter name here]
Student Number: [Enter number here]
Submission date: [enter date here]
[Enter student name and number here] 1
Fieldwork workbook and community profile
[Cranbourne community]
Student Name: [enter name here]
Student Number: [Enter number here]
Submission date: [enter date here]
[Enter student name and number here] 1
Paraphrase This Document
Need a fresh take? Get an instant paraphrase of this document with our AI Paraphraser
Fieldwork Workbook: weeks 1-2
People and Culture
Element 1: HISTORY
This element is about exploring the history of this community. When was it established? What determined
the name? What significant buildings exist? How did the population come to be here? What was the
community founded on- industry, geographic location, etc? What significant events has impacted on the
development of this community today? How long have residents lived here- long term or transient
population? Can you discover anything else that ‘paints a picture’ about the history of this community?
Fieldwork: Observations (include photos) Research Data and Comparisons (LGA)
Boonwurrung Aboriginal are the indigenous
group of Cranbourne.
The first white settlers in Cranbourne were
Ruffy brothers in 1836.
The current Cranbourne Integrated Care
Centre was the first building to host the
administrative Unit previously known as
shire of Cranbourne.
In 1857 the first post office was opened in
Cranbourne.
William Lyall was instrumental in the
development of Cranbourne by co-
ordinating the drainage of swap.
Taken by me. (2018, September 6). Casey-Cardinia
commemorating the great war of 1914-1918.
Retrieved from
https://www.bing.com/images/search?q
=cranbourne+community+photos&q
Location: City of Casey
The city of Casey is Casey (C) -
Cranbourne 84.0256 sq. Km compared to
Cranbourne Land area is 1,302 ha (13 Km).
Whereas, Victoria state is 227495.6 sq
Kms.
In 2017 Cranbourne population was 21,096
as per Australian Bureau of Statistics
Estimated Resident Population (ABS ERP)
It has a Population density of 16.20 persons
per hectare.
Geographic location of Cranbourne: the
community is bounded by Thompsons Road
in the northern side, While on the eastern
side there is Narre Warren Road, Cameron
Street and the South Gippsland Highway as
the significant landmarks, the southern side
there is Ballarto Road and a line running
continuous of Ballarto Road in, and
Cranbourne-Frankston Road, on the
western side the boundary is marked by
Monahans Road and the railway.
Resources & References
Australian Bureau of Statistics (2017). "Cranbourne (State Suburb)". 2016 Census QuickStats. Retrieved 4
September, 2018.
Profile.id.com.au. (2018). Ethnicity | City of Casey | Community profile. [online] Available at:
https://profile.id.com.au/casey/ethnicity?WebID=160 [Accessed 6 Sep. 2018].
[Enter student name and number here] 2
People and Culture
Element 2: DEMOGRAPHICS
For this element you are required to examine the type of people that make up your population. Here you may
need to look at the larger population here (LGA data) to paint a true picture. Think about the spread of ages
across the population- young /old, gender ratio, marital status, family units- single parent family/extended
families in one dwelling, etc.
*How does YOUR population compare to other LGAs or to Victoria as a whole?
Fieldwork: Observations (include photos) Research Data and Comparisons (LGA)
There has been tremendous population
growth in Cranbourne community from
2011 based on the population Census in the
context of Estimated Resident Population
(ERP), enumerated population, and Usual
Resident Population.
There is very minimal gender ratio
difference in Cranbourne community
compared to entire Victoria.
The population of persons above 15 years of
age were lower in Cranbourne
The Cranbourne has small number of elderly
population as compared to younger
population based on the Age-sex pyramid
structure.
There are more elderly females as compared
to elderly males in Cranbourne.
The Cranbourne has cocktail of household
types namely; Couples with children,
Couples without children, one parent family,
Lone person, and group household
Taken by me. (2018, September 6). A picture of
Australia day at Cranbourne. Retrieved from
https://www.bing.com/images/search?q
=cranbourne+community+photos&q
Location: Cranbourne North.
The Percentage of Males to females in
Cranbourne was 49.9% to 50.1%
respectively compared to Victoria 49.1% to
50.9% respectively in 2016.
In 2016, persons aged above 15 years old
were 81.8 % in Victoria compared to 78.1%
in Cranbourne.
In 2016, the aging population in Cranbourne
was lower 0.4%-0.7% for males and females
respectively compared to 0.7%-1.4% for
males and females in entire Victoria.
Age-sex pyramid structure of 2016 reveals
that age above 85 years males were 0.5%
while females were about 0.7%. At the same
time, age between 0 to 4 years both female
and males had the same % of about 4%.
In 2016 person per dwelling was 2.75%
compared to 2.55 % registered in Victoria in
the same year. Households with children
were 33.3% in Cranbourne compared to
45.1% in the city of Casey in 2016. 14.8%
were single family Cranbourne compared to
11.8% in city of Casey in 2016. Group
household were 3.0% compared 2.2% in city
of Casey in 2016.
In 2017, among the individuals aged 15
years and above in Cranbourne, 45.2% of
them were married, while 14.0% were either
divorced or separated, Compared to 48.4%
and 10.9% persons who were married or
separated respectively in the entire Victoria.
In 2016, the average household size in
Cranbourne was 3.1 against 2.6 nationally.
In 2017, the population growth rate of
Victoria was 2.3% this was more than the
national figure of 1.6% in the same year.
Resources & References
Australian Bureau of Statistics (27 June 2017). "Cranbourne (State Suburb)". 2016 Census QuickStats.
Retrieved 4 September, 2018.
Profile.id.com.au. (2018). Population | City of Casey | Community profile. [online] Available at:
https://profile.id.com.au/casey/population?WebID=160 [Accessed 6 Sep. 2018].
[Enter student name and number here] 3
⊘ This is a preview!⊘
Do you want full access?
Subscribe today to unlock all pages.
Trusted by 1+ million students worldwide
People and Culture
Element 3: CULTURE/RELIGION
This element explores the diversity of the people in your population. Here you need to explore the
ethnicity/race of the people (country of birth), what languages are spoken, what religions are followed or
celebrated, are there cultural festivals held, review buildings, shops and restaurants, etc., in your community
that may tell you about the culture of the people who live here. Is your community of mainly one culture or a
mixed one?
*How might this compare to other areas or to Victoria as a whole?
Fieldwork: Observations (include photos) Research Data and Comparisons (LGA)
Cranbourne's Ancestry Characteristics is a
mixture of different ethnicity such as
English, Australian, Irish, and Scottish
among other ethnic groups.
The majority of the population living in
Cranbourne were speaking English as the
only language at home while non-English
were few.
Other than English individuals within
Cranbourne community spoke different
languages at home including ; Punjabi, Dari,
Samoan, and Hindi among others
There is different religious affiliation within
the Cranbourne community including:
Christians, Non-Christians, no religion
affiliation
Taken by me. (2018, September 6). St. Peter’s
Catholic church Cranbourne. Retrieved from
https://www.bing.com/images/search?q
=cranbourne+community+photos&q
Location: St. Peter’s Catholic Cranbourne College
In 2016, English were 31.3 % compared to
29.9% in entire Victoria, Australians were
29.1% compared to 27.9% in Victoria, Irish
were 7.9% compared to 10.1% in Victoria,
Scottish were 7.4% compared to 8.3% in
Victoria.
In 2016, 69.5% persons could only speak
English at home compared 67.9% in
Victoria in same year. While Non-English
speaking were 23.7% compared to 26% in
Victoria.
In 2016 a total of 19,779 languages were
spoken in Cranbourne excluding English.
2.7% of the individuals spoke Punjabi
compared to 0.9 who spoke the same
language in Victoria in the same year, 2.6%
spoke compared to 0.6% who spoke Dari in
Victoria, 1.3% spoke Samoan compared to
0.2 who spoke the same language in
Victoria. 1.2% spoke Hindi compared to
0.9% individuals who spoke the same
language in Victoria.
In 2016 Christians were 9,371 (46.6%) out
of 20,094 compared to 48.6 registered in
city of Casey, Non-Christians were
2678(13.3%) compared to 18.7% in City of
Casey, while individuals with no religion
affiliation were 5,848(29.1%) compared to
24.5% in city of Casey.
Resources & References
Australian Bureau of Statistics (2017). "Cranbourne (State Suburb)". 2016 Census QuickStats. Retrieved 4
September, 2018.
Profile.id.com.au. (2018). Religion | City of Casey | Community profile. [online] Available at:
https://profile.id.com.au/casey/religion?WebID=160 [Accessed 6 Sep. 2018].
[Enter student name and number here] 4
Paraphrase This Document
Need a fresh take? Get an instant paraphrase of this document with our AI Paraphraser
People and Culture
KEY QUESTIONS TO ANSWER: (500 WORDS max)
1. What does this history tell you about the people in your community? Can you see any indirect
links to health? Cranbourne community language statistics indicate the percentage of the
population who speak a language at home other than English. They indicate how culturally diverse a
population is and the degree to which different ethnic groups and nationalities are retaining their
language. Therefore, by understanding Cranbourne community history we are able to identify
specific cultural and ethnic groups with special interest in order to provide health services required
by the multicultural community.
Cranbourne's religion statistics provide an indicator of cultural identity and ethnicity when observed
in conjunction with other key variables. Religion data reveal the major concentrations of religions as
well as revealing the proportion of people with no religious affiliation. There are a number of reasons
for different religious compositions across areas including the country of birth and ethnic background
of the population, the age of the population (belief in religion is generally stronger, the older the
population) and changes in values and belief systems.
2. What do the demographics tell you about the people in your community?
The life expectancy in Cranbourne is low when compared the life expectancy for the entire Victoria
state. At the same time, there are more elderly (85 years and above) females when compared to men
of the same age. Pointing at the fact that more men dies before reaching 85 years.
3. How can the diversity of the population influence health?
Variations in the age-sex structure, the size of a population, race, and ethnic background has a direct
effect on the amount of resources needed to plan and execute health-care services, cost of health care
to be provided and even the conditions associated with each population group. Therefore, healthcare
providers will have to adapt to meet the diverse needs of their patients’ at the same time, addressing
the necessary healthcare reforms.
4. What you have learned from your data gathering and research about PEOPLE AND
CULTURE in your particular community? From this research I am able to appreciate the critical
role played by studying the history of a community in conjunction with other variables such as
demographics and religion of a community in determining the health status of a community? When
formulating any intervention policies for a specific population within a certain community.
[Enter student name and number here] 5
Fieldwork Workbook: weeks 3-4
Environment and Accessibility
Element 4: PHYSICAL ENVIRONMENT
This element looks at the location and physical surrounds of this community. What climate does this
community have? What is the quality of the air, the water, etc.? What sort of topography is it surrounded by?
How accessible is the location (rural, remote, metro, etc) and what natural disasters might it be prone to?
What else can you tell me about the area or environment where this community lives?
*How does this compare to other areas or to Victoria?
Fieldwork: Observations (include photos) Research Data and Comparisons (LGA)
In Cranbourne the water resource is
managed through the City of Casey council.
There is stormwater management action
plan that aid with protection and
management of council’s waterways.
However, the stormwater is not channelled
through sewerage treatment plant.
Therefore, the quality of the water may be
compromised by presence of heavy metals
and total dissolved solid.
The Waste and Recycling Department
provide an assortment of services to assist
the community in diverting waste from
landfill.
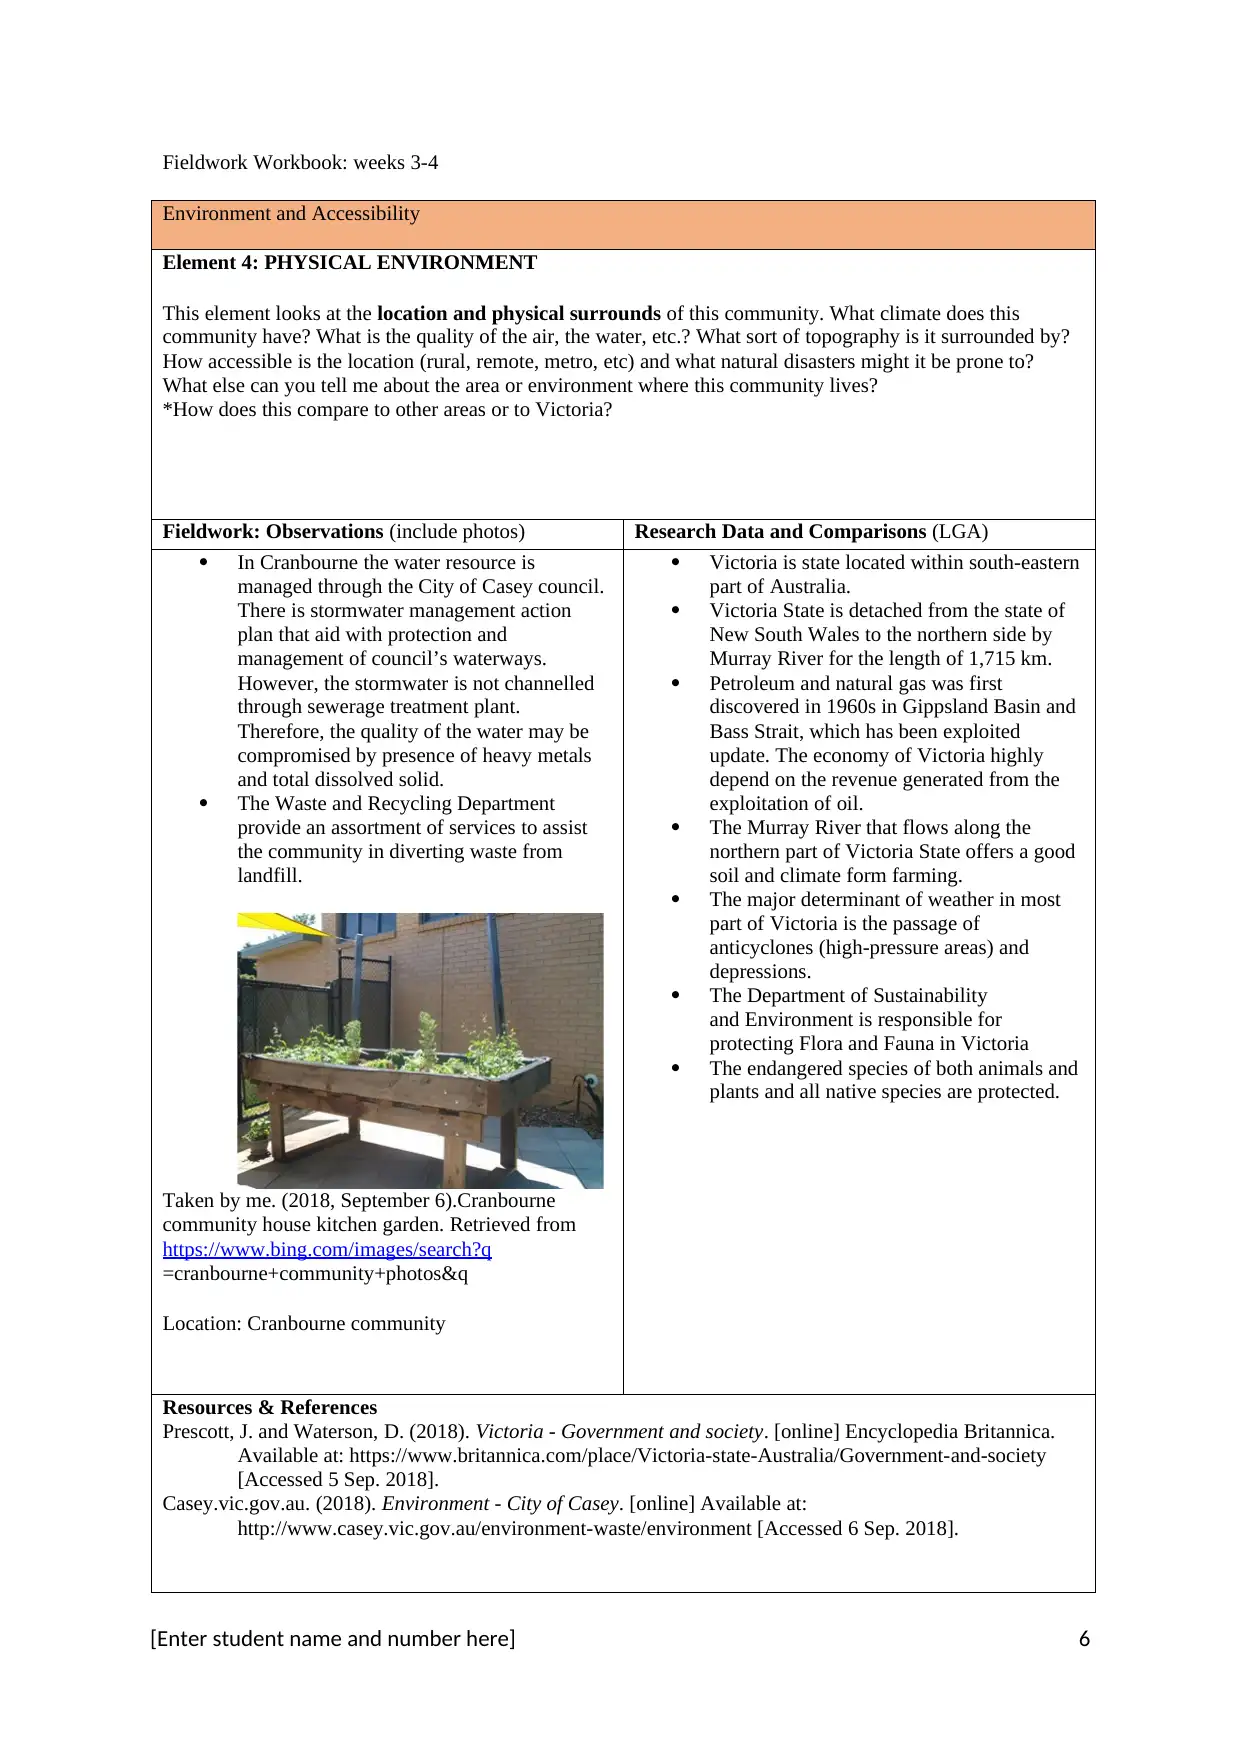
Taken by me. (2018, September 6).Cranbourne
community house kitchen garden. Retrieved from
https://www.bing.com/images/search?q
=cranbourne+community+photos&q
Location: Cranbourne community
Victoria is state located within south-eastern
part of Australia.
Victoria State is detached from the state of
New South Wales to the northern side by
Murray River for the length of 1,715 km.
Petroleum and natural gas was first
discovered in 1960s in Gippsland Basin and
Bass Strait, which has been exploited
update. The economy of Victoria highly
depend on the revenue generated from the
exploitation of oil.
The Murray River that flows along the
northern part of Victoria State offers a good
soil and climate form farming.
The major determinant of weather in most
part of Victoria is the passage of
anticyclones (high-pressure areas) and
depressions.
The Department of Sustainability
and Environment is responsible for
protecting Flora and Fauna in Victoria
The endangered species of both animals and
plants and all native species are protected.
Resources & References
Prescott, J. and Waterson, D. (2018). Victoria - Government and society. [online] Encyclopedia Britannica.
Available at: https://www.britannica.com/place/Victoria-state-Australia/Government-and-society
[Accessed 5 Sep. 2018].
Casey.vic.gov.au. (2018). Environment - City of Casey. [online] Available at:
http://www.casey.vic.gov.au/environment-waste/environment [Accessed 6 Sep. 2018].
[Enter student name and number here] 6
Environment and Accessibility
Element 4: PHYSICAL ENVIRONMENT
This element looks at the location and physical surrounds of this community. What climate does this
community have? What is the quality of the air, the water, etc.? What sort of topography is it surrounded by?
How accessible is the location (rural, remote, metro, etc) and what natural disasters might it be prone to?
What else can you tell me about the area or environment where this community lives?
*How does this compare to other areas or to Victoria?
Fieldwork: Observations (include photos) Research Data and Comparisons (LGA)
In Cranbourne the water resource is
managed through the City of Casey council.
There is stormwater management action
plan that aid with protection and
management of council’s waterways.
However, the stormwater is not channelled
through sewerage treatment plant.
Therefore, the quality of the water may be
compromised by presence of heavy metals
and total dissolved solid.
The Waste and Recycling Department
provide an assortment of services to assist
the community in diverting waste from
landfill.
Taken by me. (2018, September 6).Cranbourne
community house kitchen garden. Retrieved from
https://www.bing.com/images/search?q
=cranbourne+community+photos&q
Location: Cranbourne community
Victoria is state located within south-eastern
part of Australia.
Victoria State is detached from the state of
New South Wales to the northern side by
Murray River for the length of 1,715 km.
Petroleum and natural gas was first
discovered in 1960s in Gippsland Basin and
Bass Strait, which has been exploited
update. The economy of Victoria highly
depend on the revenue generated from the
exploitation of oil.
The Murray River that flows along the
northern part of Victoria State offers a good
soil and climate form farming.
The major determinant of weather in most
part of Victoria is the passage of
anticyclones (high-pressure areas) and
depressions.
The Department of Sustainability
and Environment is responsible for
protecting Flora and Fauna in Victoria
The endangered species of both animals and
plants and all native species are protected.
Resources & References
Prescott, J. and Waterson, D. (2018). Victoria - Government and society. [online] Encyclopedia Britannica.
Available at: https://www.britannica.com/place/Victoria-state-Australia/Government-and-society
[Accessed 5 Sep. 2018].
Casey.vic.gov.au. (2018). Environment - City of Casey. [online] Available at:
http://www.casey.vic.gov.au/environment-waste/environment [Accessed 6 Sep. 2018].
[Enter student name and number here] 6
⊘ This is a preview!⊘
Do you want full access?
Subscribe today to unlock all pages.
Trusted by 1+ million students worldwide
Environment and Accessibility
Element 5: RECREATION
This element is where we look at how the surroundings are used by people. Does the area offer special
places for sport or activities? Who uses these spaces? What risks are involved in these activities? Do people
come from outside the community to use these resources? Do these recreational resources cater for
everybody? Disability access? Cultural/art/musical activities?
*How does this compare to other areas or to Victoria?
Fieldwork: Observations (include photos) Research Data and Comparisons (LGA)
Cranbourne community has at their disposal
a number of recreational and sporting
facilities include Cranbourne Racecourse &
Recreation Reserve, Cranbourne Golf Club,
the Amstel Golf Club, the Ranfurlie Golf
Club and an indoor swimming pool.
Casey Complex is open to the community
and it has numerous facilities, including
indoor skating facility, the Cranbourne
Indoor Sports Centre (basketball, netball,
and indoor soccer).
The new Cranbourne Multicultural
Community Centre was opened to the public
from within the community and outside the
community.
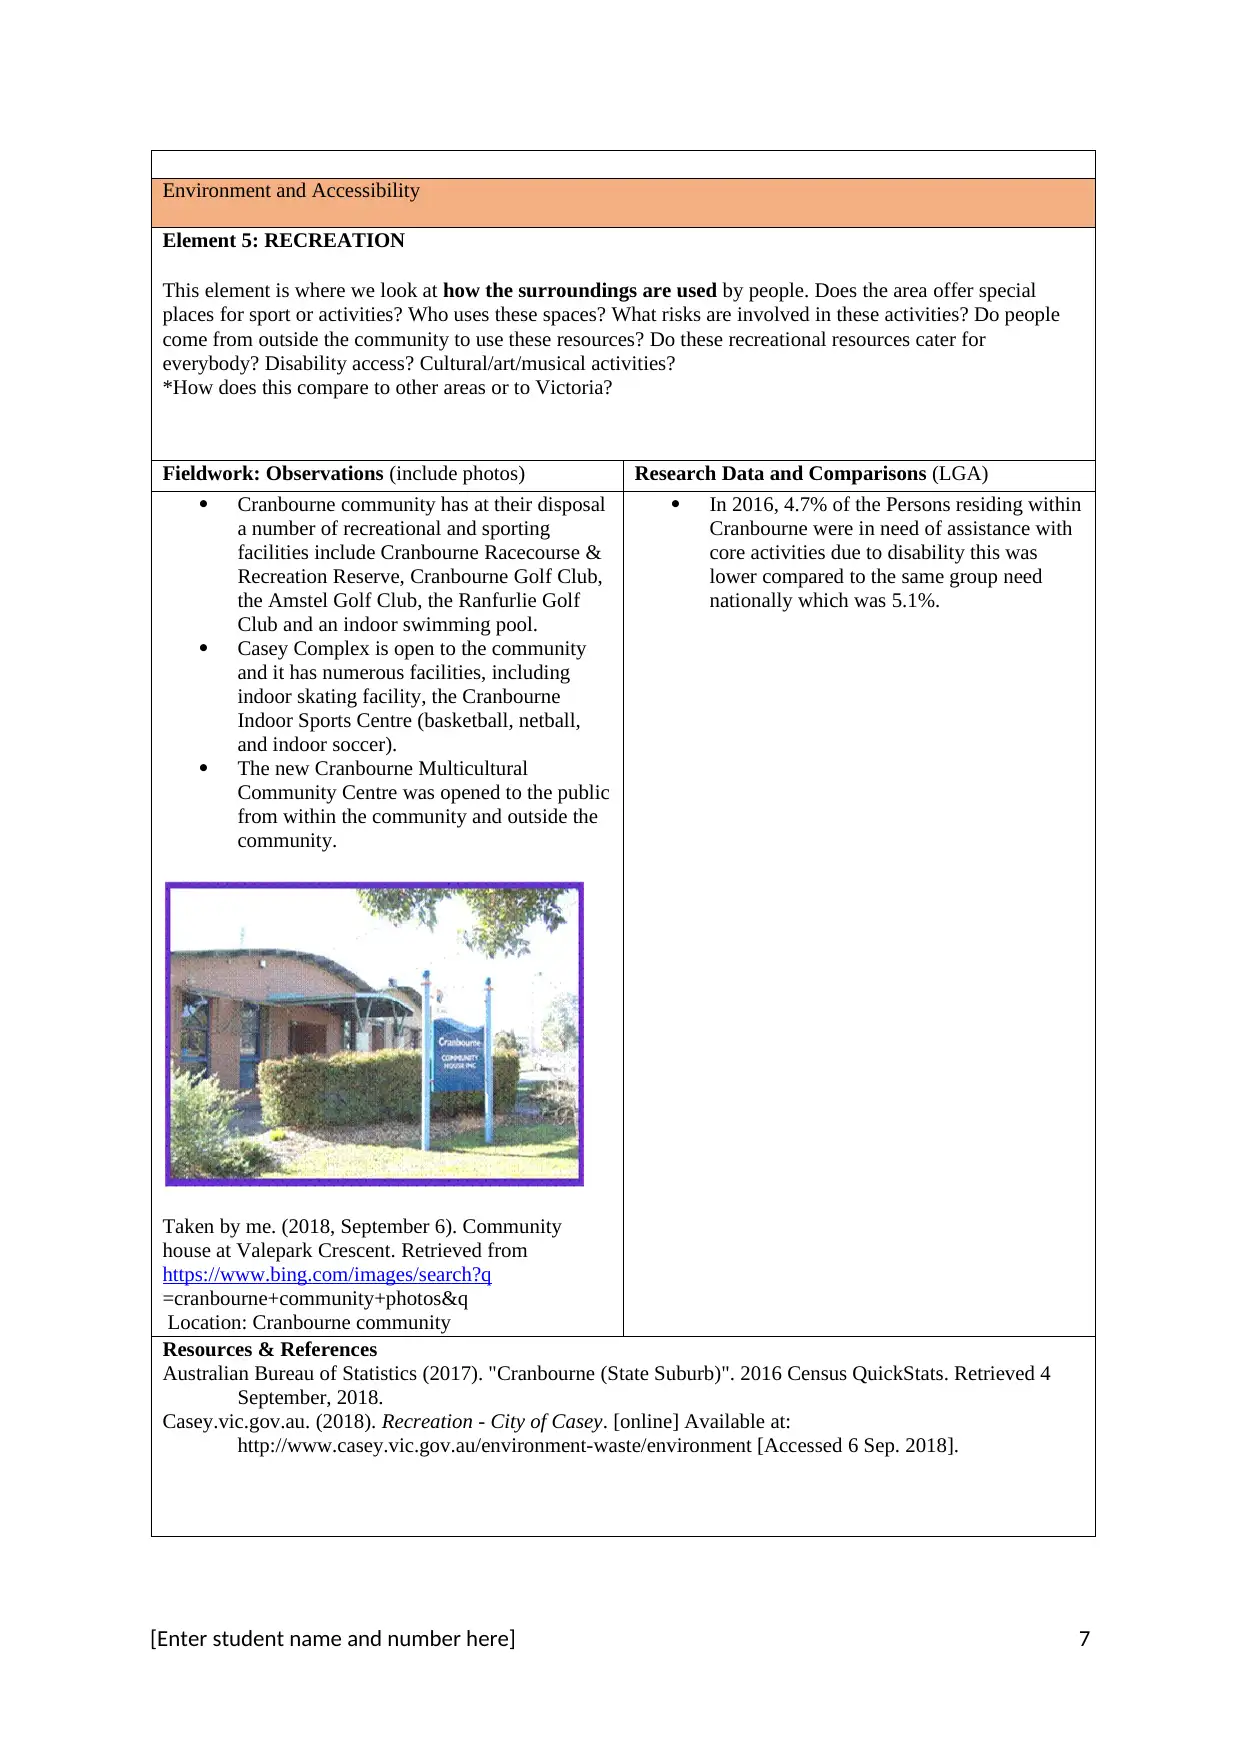
Taken by me. (2018, September 6). Community
house at Valepark Crescent. Retrieved from
https://www.bing.com/images/search?q
=cranbourne+community+photos&q
Location: Cranbourne community
In 2016, 4.7% of the Persons residing within
Cranbourne were in need of assistance with
core activities due to disability this was
lower compared to the same group need
nationally which was 5.1%.
Resources & References
Australian Bureau of Statistics (2017). "Cranbourne (State Suburb)". 2016 Census QuickStats. Retrieved 4
September, 2018.
Casey.vic.gov.au. (2018). Recreation - City of Casey. [online] Available at:
http://www.casey.vic.gov.au/environment-waste/environment [Accessed 6 Sep. 2018].
[Enter student name and number here] 7
Element 5: RECREATION
This element is where we look at how the surroundings are used by people. Does the area offer special
places for sport or activities? Who uses these spaces? What risks are involved in these activities? Do people
come from outside the community to use these resources? Do these recreational resources cater for
everybody? Disability access? Cultural/art/musical activities?
*How does this compare to other areas or to Victoria?
Fieldwork: Observations (include photos) Research Data and Comparisons (LGA)
Cranbourne community has at their disposal
a number of recreational and sporting
facilities include Cranbourne Racecourse &
Recreation Reserve, Cranbourne Golf Club,
the Amstel Golf Club, the Ranfurlie Golf
Club and an indoor swimming pool.
Casey Complex is open to the community
and it has numerous facilities, including
indoor skating facility, the Cranbourne
Indoor Sports Centre (basketball, netball,
and indoor soccer).
The new Cranbourne Multicultural
Community Centre was opened to the public
from within the community and outside the
community.
Taken by me. (2018, September 6). Community
house at Valepark Crescent. Retrieved from
https://www.bing.com/images/search?q
=cranbourne+community+photos&q
Location: Cranbourne community
In 2016, 4.7% of the Persons residing within
Cranbourne were in need of assistance with
core activities due to disability this was
lower compared to the same group need
nationally which was 5.1%.
Resources & References
Australian Bureau of Statistics (2017). "Cranbourne (State Suburb)". 2016 Census QuickStats. Retrieved 4
September, 2018.
Casey.vic.gov.au. (2018). Recreation - City of Casey. [online] Available at:
http://www.casey.vic.gov.au/environment-waste/environment [Accessed 6 Sep. 2018].
[Enter student name and number here] 7
Paraphrase This Document
Need a fresh take? Get an instant paraphrase of this document with our AI Paraphraser
Environment and Accessibility
Element 6: MOBILITY and TRANSPORTATION
For this element we look at how people move around this community. We modes of transport (private and
public), roads (quality, type, amount of traffic, etc), footpaths, walking/bike tracks and so on. We think about
issues such as cost, time of day, availability, who uses them- young/old, disabled, mothers with prams, etc?
*How does this compare to other areas of Victoria?
Fieldwork: Observations (include photos) Research Data and Comparisons (LGA)
The majority of the individuals within
Cranbourne community live and work
within the area in the context of Residential
location of local workers,
Majority of individuals within the
Cranbourne community owns a car.
Cranbourne also has many bus services that
help commuters travel to its surrounding
suburbs.
There is presence of railway line in
Cranbourne as mode of public transport.
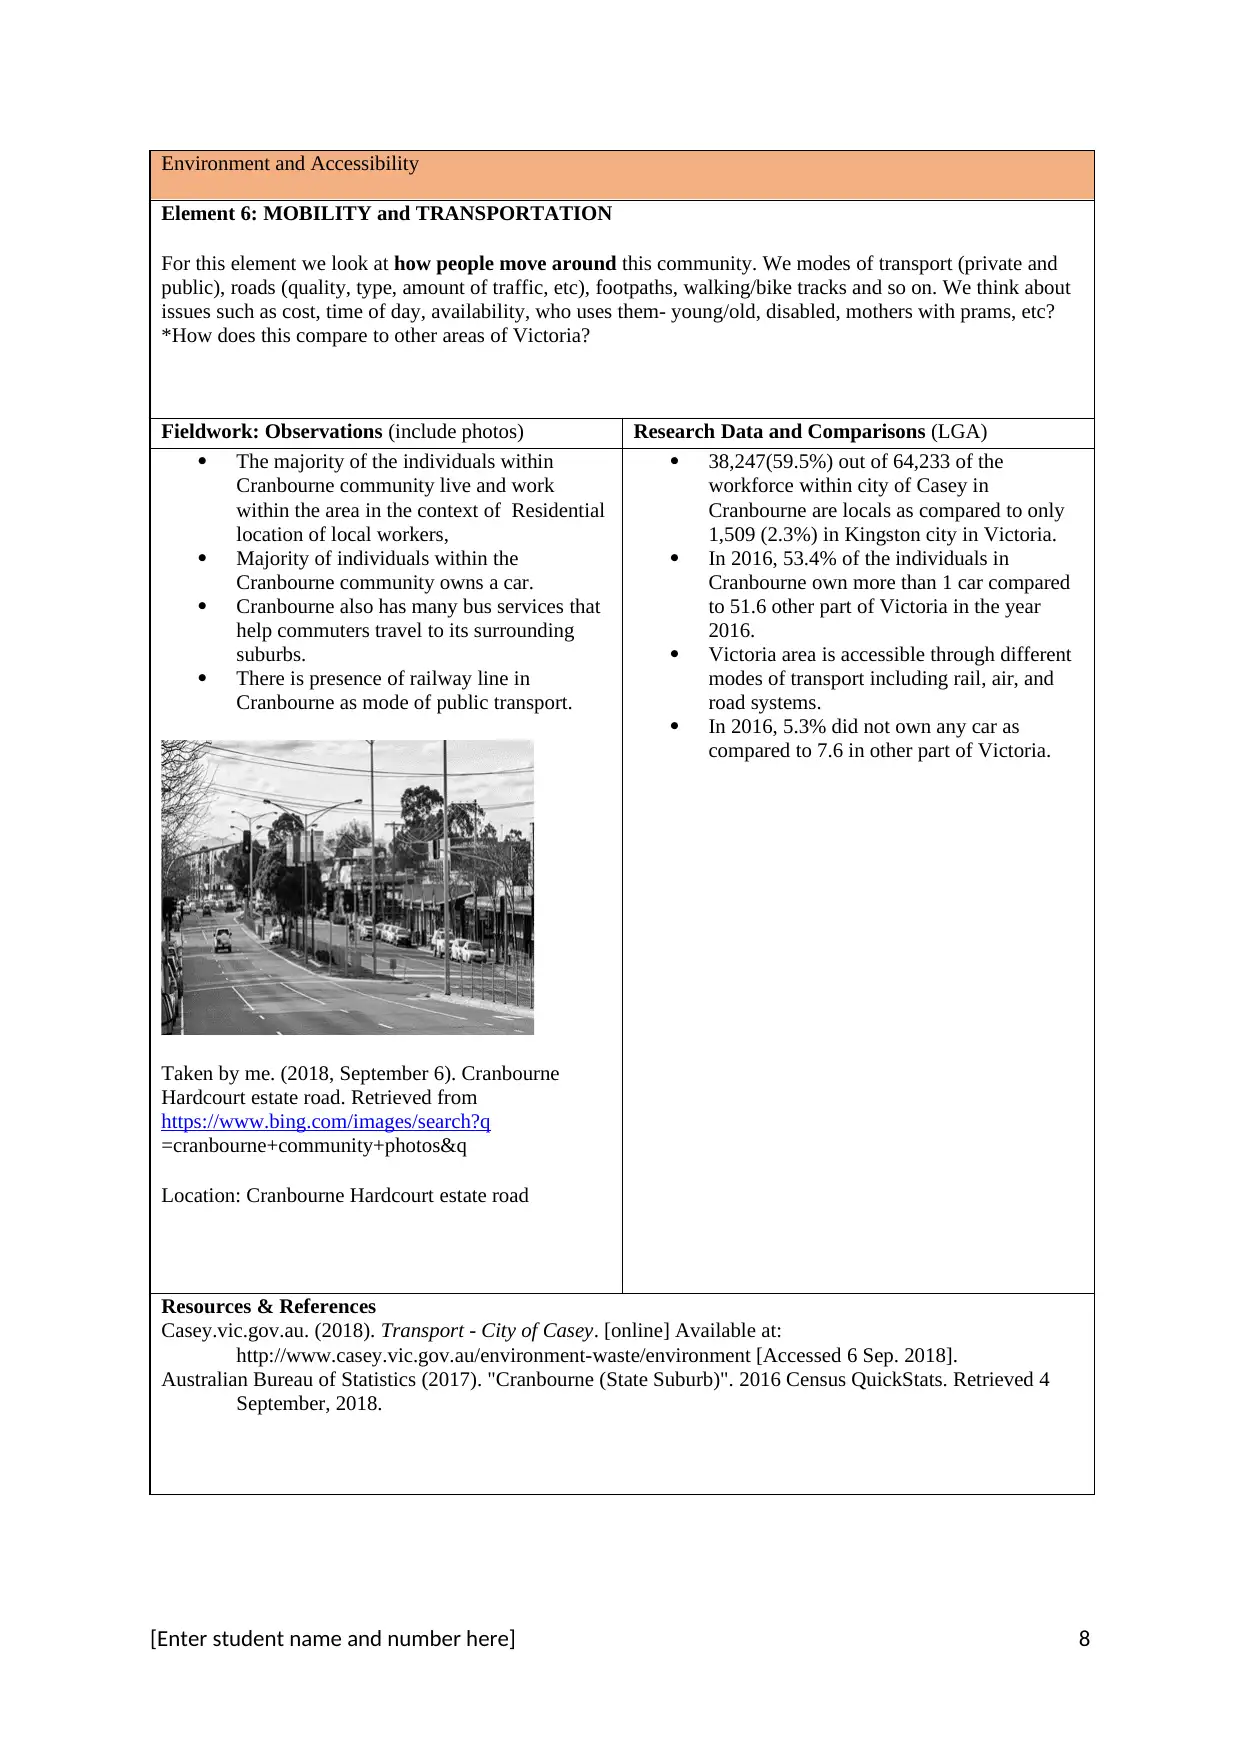
Taken by me. (2018, September 6). Cranbourne
Hardcourt estate road. Retrieved from
https://www.bing.com/images/search?q
=cranbourne+community+photos&q
Location: Cranbourne Hardcourt estate road
38,247(59.5%) out of 64,233 of the
workforce within city of Casey in
Cranbourne are locals as compared to only
1,509 (2.3%) in Kingston city in Victoria.
In 2016, 53.4% of the individuals in
Cranbourne own more than 1 car compared
to 51.6 other part of Victoria in the year
2016.
Victoria area is accessible through different
modes of transport including rail, air, and
road systems.
In 2016, 5.3% did not own any car as
compared to 7.6 in other part of Victoria.
Resources & References
Casey.vic.gov.au. (2018). Transport - City of Casey. [online] Available at:
http://www.casey.vic.gov.au/environment-waste/environment [Accessed 6 Sep. 2018].
Australian Bureau of Statistics (2017). "Cranbourne (State Suburb)". 2016 Census QuickStats. Retrieved 4
September, 2018.
[Enter student name and number here] 8
Element 6: MOBILITY and TRANSPORTATION
For this element we look at how people move around this community. We modes of transport (private and
public), roads (quality, type, amount of traffic, etc), footpaths, walking/bike tracks and so on. We think about
issues such as cost, time of day, availability, who uses them- young/old, disabled, mothers with prams, etc?
*How does this compare to other areas of Victoria?
Fieldwork: Observations (include photos) Research Data and Comparisons (LGA)
The majority of the individuals within
Cranbourne community live and work
within the area in the context of Residential
location of local workers,
Majority of individuals within the
Cranbourne community owns a car.
Cranbourne also has many bus services that
help commuters travel to its surrounding
suburbs.
There is presence of railway line in
Cranbourne as mode of public transport.
Taken by me. (2018, September 6). Cranbourne
Hardcourt estate road. Retrieved from
https://www.bing.com/images/search?q
=cranbourne+community+photos&q
Location: Cranbourne Hardcourt estate road
38,247(59.5%) out of 64,233 of the
workforce within city of Casey in
Cranbourne are locals as compared to only
1,509 (2.3%) in Kingston city in Victoria.
In 2016, 53.4% of the individuals in
Cranbourne own more than 1 car compared
to 51.6 other part of Victoria in the year
2016.
Victoria area is accessible through different
modes of transport including rail, air, and
road systems.
In 2016, 5.3% did not own any car as
compared to 7.6 in other part of Victoria.
Resources & References
Casey.vic.gov.au. (2018). Transport - City of Casey. [online] Available at:
http://www.casey.vic.gov.au/environment-waste/environment [Accessed 6 Sep. 2018].
Australian Bureau of Statistics (2017). "Cranbourne (State Suburb)". 2016 Census QuickStats. Retrieved 4
September, 2018.
[Enter student name and number here] 8
Environment and Accessibility
KEY QUESTIONS TO ANSWER: (500 WORDS max)
1. How can WHERE you live impact on the health of a population?
The ability of the population to access health services is strongly influenced by access to transport.
At the same time, the availability and accessibility to certain sporting facilities and recreational
facilities that are critical the wellbeing of individuals within the community is determined by their
residence.
2. How do the activities that are undertaken in this community impact the health of its people?
(Inclusive, accessible and affordable, risks/benefits?)
A true individuals within the community participation I seen when they are directly involved in the
planning, decision making, and programme implementation in all activities within the community.
For example, individuals participating in sporting activities within the community has an overall
health benefit to the individuals but also to the community at large. At the same time, the recreational
and sporting facilities in the community should be accessible to all community members including
persons with disabilities, minority groups within the community. Physical activities undertaken by
the members of this community are beneficial by helping in weight control hence reducing the risks
of lifestyle diseases such as obesity, hypertension and minimize the risk of Cardiovascular Diseases.
3. How does mobility or transport impact on health within your community?
There is a direct correlation between mobility and a person’s independence, well-being, and even the
quality of life. The transport and mobility within a community highly impact individuals’
psychology, physical activity through exercise and over rall wellbeing. For example, the ability of
community members to cycle every day to work or walk to work can be positively impact on their
health status. Depending on these factors, car ownership can be seen as a measure of advantage or
disadvantage, or a neutral socioeconomic measure, which impacts on the environment and quality of
life.
4. What you have learned from your data gathering and research about ENVIRONMENT AND
ACCESSIBILITY in your particular community? I have learnt the importance of public
participation when undertaking major project within community. When health promotional
programmes are undertaken with community interest heart, then the benefits are huge and promotes
inclusiveness and cohesion within a community.
[Enter student name and number here] 9
⊘ This is a preview!⊘
Do you want full access?
Subscribe today to unlock all pages.
Trusted by 1+ million students worldwide
Fieldwork Workbook: weeks 5-6
Socioeconomic State and Connection
Element 7: ECONOMY
This element addresses the financial and employment state of the community and its population. You will
explore employment rates, types of workforce and industry, income rates, etc. This might include data about
housing (own/renting, homeless), single/double income families, retirees/pensions, etc.
*How does this compare to other areas or to Victoria?
Fieldwork: Observations (include photos) Research Data and Comparisons (LGA)
Within the Cranbourne community there
was low percentage of persons with higher
weekly gross income and low percentage of
individuals with low weekly gross income.
Unemployment rate in Cranbourne was high
when compared to the entire Victoria state
figure.
The majority of persons within the
Cranbourne are employed through full time
employment or part-time employment. The
number of un-employed persons in
minimum.
There was increased Equivalised household
income quartiles.
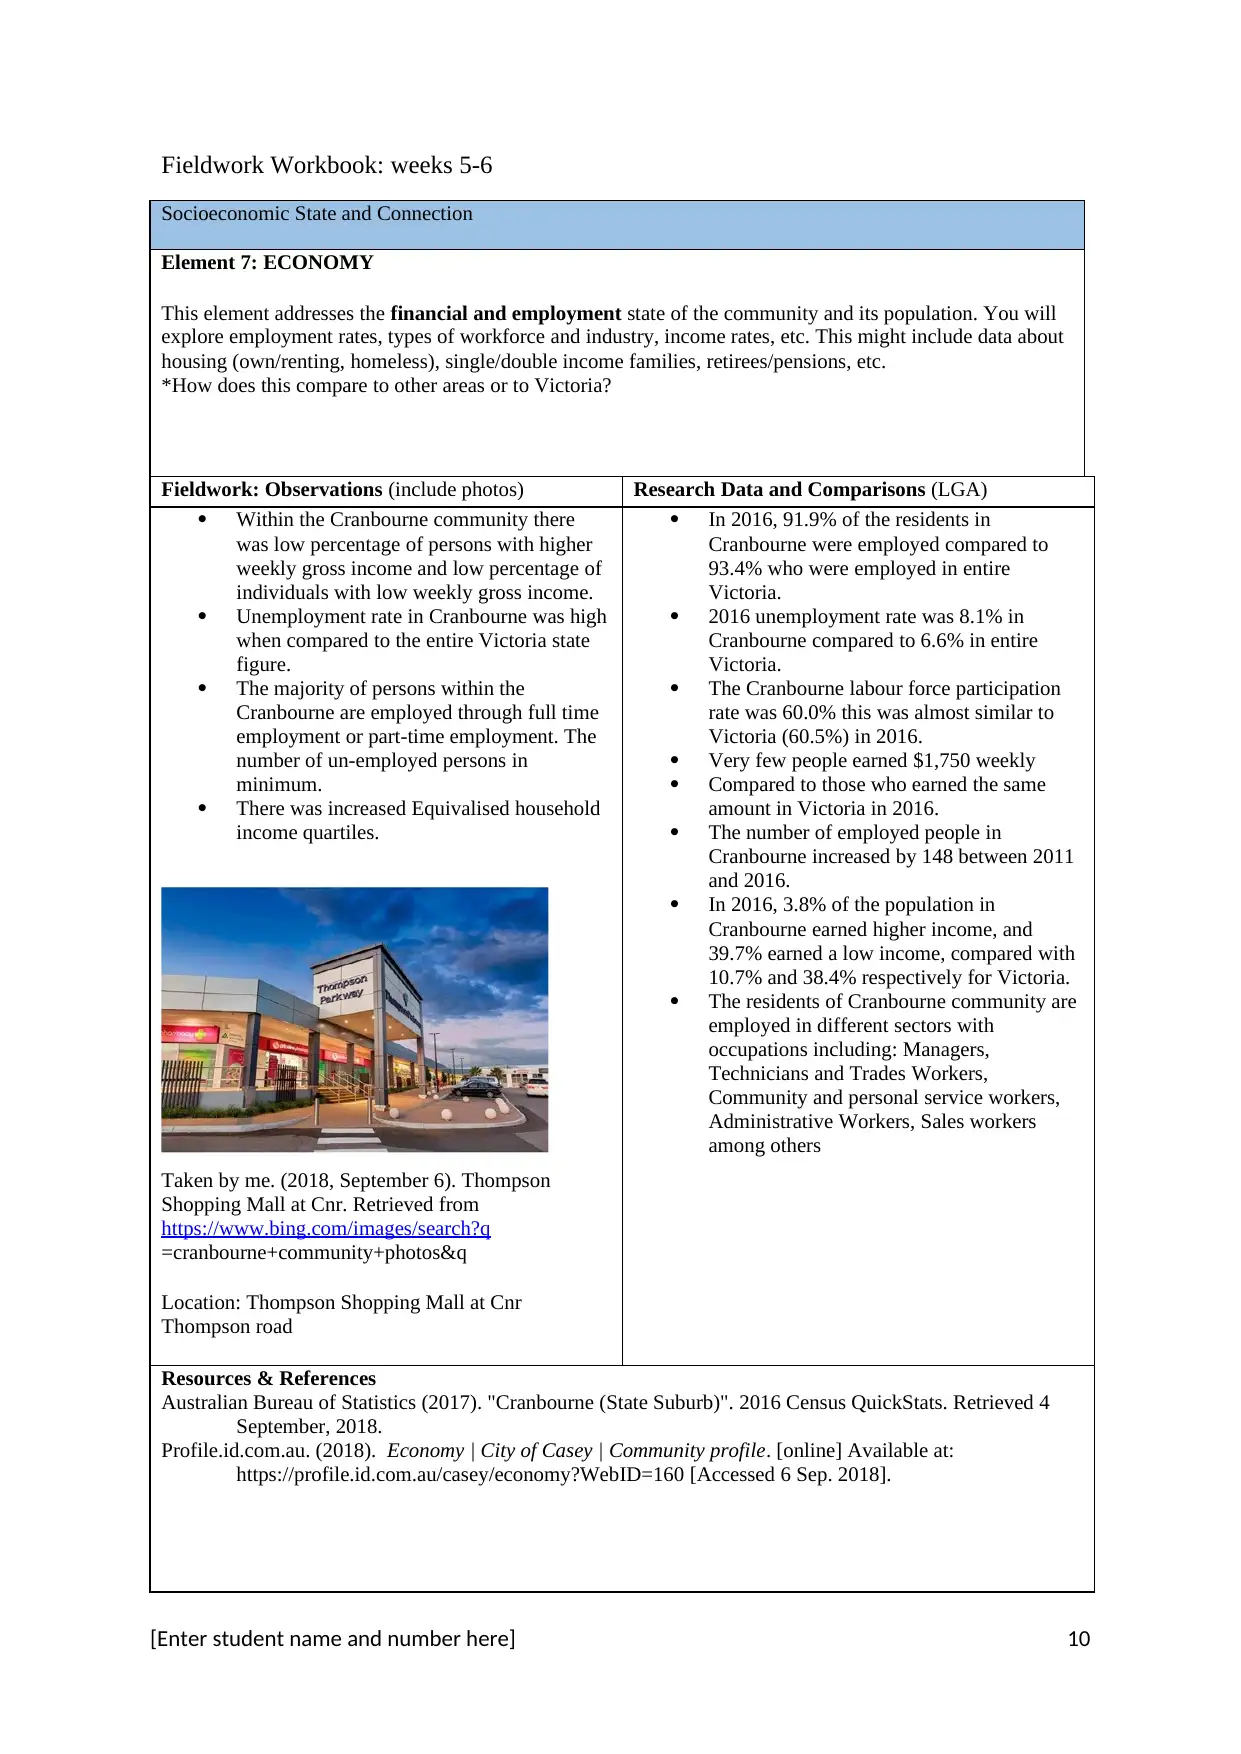
Taken by me. (2018, September 6). Thompson
Shopping Mall at Cnr. Retrieved from
https://www.bing.com/images/search?q
=cranbourne+community+photos&q
Location: Thompson Shopping Mall at Cnr
Thompson road
In 2016, 91.9% of the residents in
Cranbourne were employed compared to
93.4% who were employed in entire
Victoria.
2016 unemployment rate was 8.1% in
Cranbourne compared to 6.6% in entire
Victoria.
The Cranbourne labour force participation
rate was 60.0% this was almost similar to
Victoria (60.5%) in 2016.
Very few people earned $1,750 weekly
Compared to those who earned the same
amount in Victoria in 2016.
The number of employed people in
Cranbourne increased by 148 between 2011
and 2016.
In 2016, 3.8% of the population in
Cranbourne earned higher income, and
39.7% earned a low income, compared with
10.7% and 38.4% respectively for Victoria.
The residents of Cranbourne community are
employed in different sectors with
occupations including: Managers,
Technicians and Trades Workers,
Community and personal service workers,
Administrative Workers, Sales workers
among others
Resources & References
Australian Bureau of Statistics (2017). "Cranbourne (State Suburb)". 2016 Census QuickStats. Retrieved 4
September, 2018.
Profile.id.com.au. (2018). Economy | City of Casey | Community profile. [online] Available at:
https://profile.id.com.au/casey/economy?WebID=160 [Accessed 6 Sep. 2018].
[Enter student name and number here] 10
Socioeconomic State and Connection
Element 7: ECONOMY
This element addresses the financial and employment state of the community and its population. You will
explore employment rates, types of workforce and industry, income rates, etc. This might include data about
housing (own/renting, homeless), single/double income families, retirees/pensions, etc.
*How does this compare to other areas or to Victoria?
Fieldwork: Observations (include photos) Research Data and Comparisons (LGA)
Within the Cranbourne community there
was low percentage of persons with higher
weekly gross income and low percentage of
individuals with low weekly gross income.
Unemployment rate in Cranbourne was high
when compared to the entire Victoria state
figure.
The majority of persons within the
Cranbourne are employed through full time
employment or part-time employment. The
number of un-employed persons in
minimum.
There was increased Equivalised household
income quartiles.
Taken by me. (2018, September 6). Thompson
Shopping Mall at Cnr. Retrieved from
https://www.bing.com/images/search?q
=cranbourne+community+photos&q
Location: Thompson Shopping Mall at Cnr
Thompson road
In 2016, 91.9% of the residents in
Cranbourne were employed compared to
93.4% who were employed in entire
Victoria.
2016 unemployment rate was 8.1% in
Cranbourne compared to 6.6% in entire
Victoria.
The Cranbourne labour force participation
rate was 60.0% this was almost similar to
Victoria (60.5%) in 2016.
Very few people earned $1,750 weekly
Compared to those who earned the same
amount in Victoria in 2016.
The number of employed people in
Cranbourne increased by 148 between 2011
and 2016.
In 2016, 3.8% of the population in
Cranbourne earned higher income, and
39.7% earned a low income, compared with
10.7% and 38.4% respectively for Victoria.
The residents of Cranbourne community are
employed in different sectors with
occupations including: Managers,
Technicians and Trades Workers,
Community and personal service workers,
Administrative Workers, Sales workers
among others
Resources & References
Australian Bureau of Statistics (2017). "Cranbourne (State Suburb)". 2016 Census QuickStats. Retrieved 4
September, 2018.
Profile.id.com.au. (2018). Economy | City of Casey | Community profile. [online] Available at:
https://profile.id.com.au/casey/economy?WebID=160 [Accessed 6 Sep. 2018].
[Enter student name and number here] 10
Paraphrase This Document
Need a fresh take? Get an instant paraphrase of this document with our AI Paraphraser
Socioeconomic State and Connection
Element 8: EDUCATION
This element explores the level and type of education within the community. This includes private or public,
what level students leave study, attrition rates, what extra curriculum activities the education facilities offer
and so on. You need to consider all levels of education; from preschool/childcare (early childhood) through to
tertiary education or trade qualifications.
*How does this compare to other areas or to Victoria?
Fieldwork: Observations (include photos) Research Data and Comparisons (LGA)
Cranbourne's population attend to varied
educational institutions indicating the age
structure within the community.
Majority of individuals in Cranbourne
community completed year 12 education.
Many of the individuals in Cranbourne
completed year 10 and above education
A good number of the residents reached
tertiary and above level of education
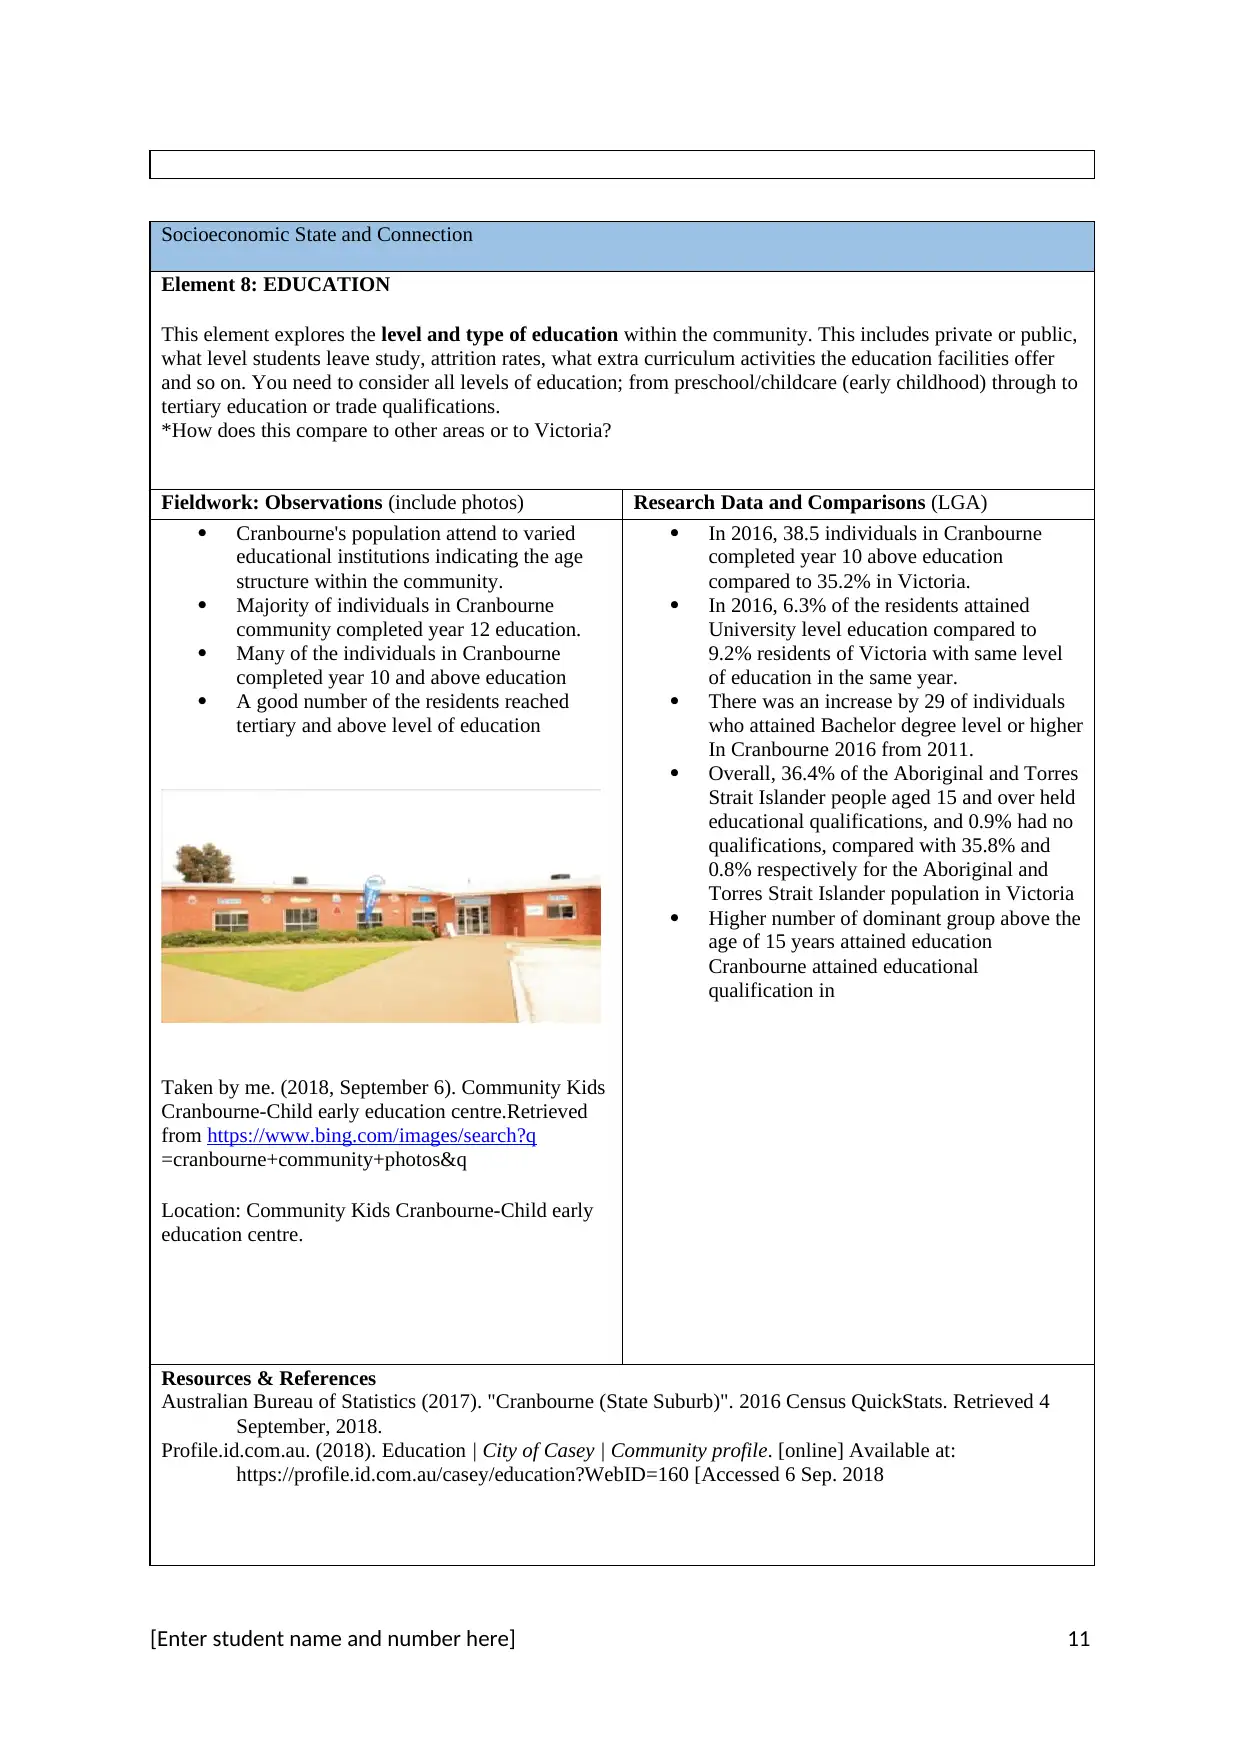
Taken by me. (2018, September 6). Community Kids
Cranbourne-Child early education centre.Retrieved
from https://www.bing.com/images/search?q
=cranbourne+community+photos&q
Location: Community Kids Cranbourne-Child early
education centre.
In 2016, 38.5 individuals in Cranbourne
completed year 10 above education
compared to 35.2% in Victoria.
In 2016, 6.3% of the residents attained
University level education compared to
9.2% residents of Victoria with same level
of education in the same year.
There was an increase by 29 of individuals
who attained Bachelor degree level or higher
In Cranbourne 2016 from 2011.
Overall, 36.4% of the Aboriginal and Torres
Strait Islander people aged 15 and over held
educational qualifications, and 0.9% had no
qualifications, compared with 35.8% and
0.8% respectively for the Aboriginal and
Torres Strait Islander population in Victoria
Higher number of dominant group above the
age of 15 years attained education
Cranbourne attained educational
qualification in
Resources & References
Australian Bureau of Statistics (2017). "Cranbourne (State Suburb)". 2016 Census QuickStats. Retrieved 4
September, 2018.
Profile.id.com.au. (2018). Education | City of Casey | Community profile. [online] Available at:
https://profile.id.com.au/casey/education?WebID=160 [Accessed 6 Sep. 2018
[Enter student name and number here] 11
Element 8: EDUCATION
This element explores the level and type of education within the community. This includes private or public,
what level students leave study, attrition rates, what extra curriculum activities the education facilities offer
and so on. You need to consider all levels of education; from preschool/childcare (early childhood) through to
tertiary education or trade qualifications.
*How does this compare to other areas or to Victoria?
Fieldwork: Observations (include photos) Research Data and Comparisons (LGA)
Cranbourne's population attend to varied
educational institutions indicating the age
structure within the community.
Majority of individuals in Cranbourne
community completed year 12 education.
Many of the individuals in Cranbourne
completed year 10 and above education
A good number of the residents reached
tertiary and above level of education
Taken by me. (2018, September 6). Community Kids
Cranbourne-Child early education centre.Retrieved
from https://www.bing.com/images/search?q
=cranbourne+community+photos&q
Location: Community Kids Cranbourne-Child early
education centre.
In 2016, 38.5 individuals in Cranbourne
completed year 10 above education
compared to 35.2% in Victoria.
In 2016, 6.3% of the residents attained
University level education compared to
9.2% residents of Victoria with same level
of education in the same year.
There was an increase by 29 of individuals
who attained Bachelor degree level or higher
In Cranbourne 2016 from 2011.
Overall, 36.4% of the Aboriginal and Torres
Strait Islander people aged 15 and over held
educational qualifications, and 0.9% had no
qualifications, compared with 35.8% and
0.8% respectively for the Aboriginal and
Torres Strait Islander population in Victoria
Higher number of dominant group above the
age of 15 years attained education
Cranbourne attained educational
qualification in
Resources & References
Australian Bureau of Statistics (2017). "Cranbourne (State Suburb)". 2016 Census QuickStats. Retrieved 4
September, 2018.
Profile.id.com.au. (2018). Education | City of Casey | Community profile. [online] Available at:
https://profile.id.com.au/casey/education?WebID=160 [Accessed 6 Sep. 2018
[Enter student name and number here] 11
Socioeconomic State and Connection
Element 9: INTERACTION/ISOLATION
This element explores the way people communicate and interact with each other within this community. Is
this an interactive community, or do people keep to themselves? How do they communicate- local gathering
areas, internet access, local radio or television stations, newspapers/newsletters, etc? Is isolation an issue?
*How does this compare to other areas or to Victoria?
Fieldwork: Observations (include photos) Research Data and Comparisons (LGA)
Internet connection is important utility for
most household in Cranbourne. Most of the
households were able to access internet
connection.
Individuals within Cranbourne are involved
in different sporting clubs including
Cranbourne Football Club, the Cranbourne
Cricket Club, the Cranbourne Soccer Club,
and the Cranbourne Tennis Club.
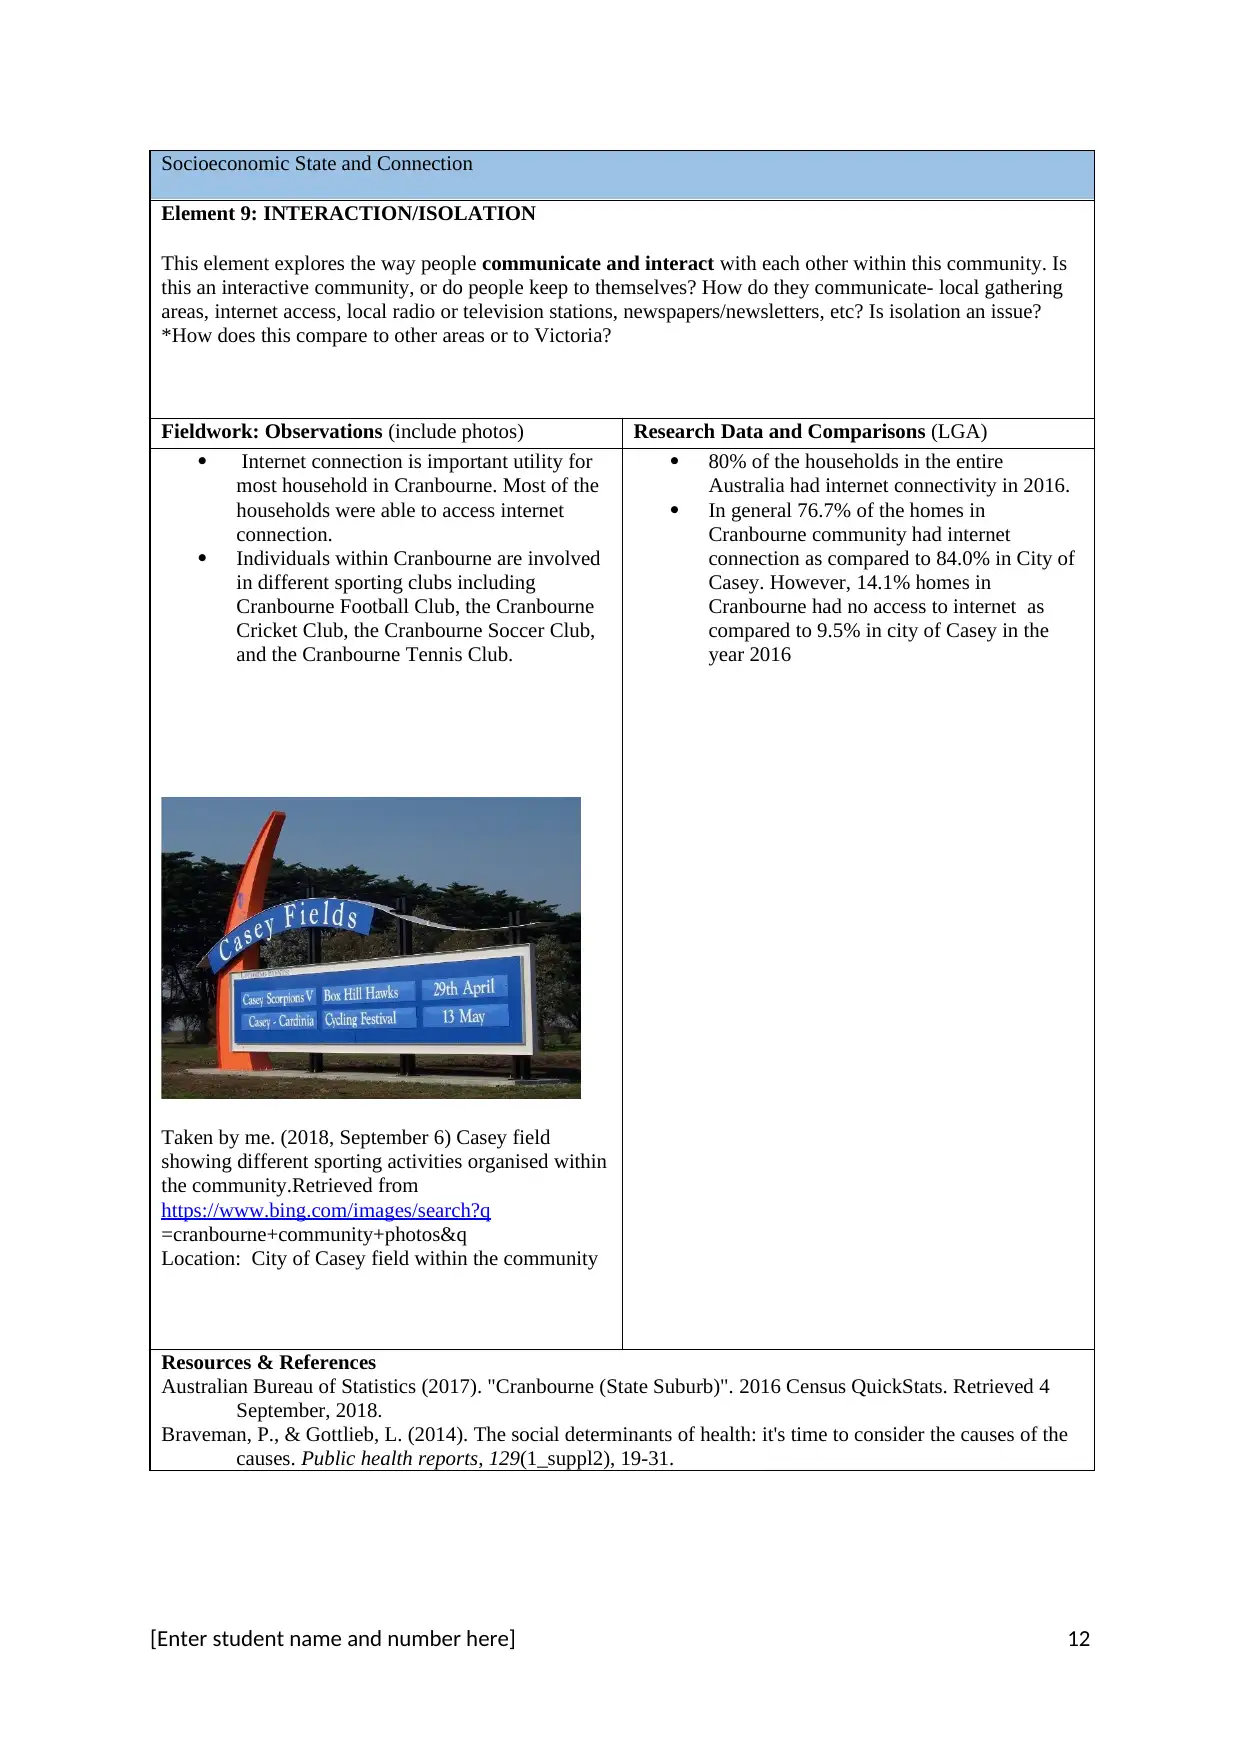
Taken by me. (2018, September 6) Casey field
showing different sporting activities organised within
the community.Retrieved from
https://www.bing.com/images/search?q
=cranbourne+community+photos&q
Location: City of Casey field within the community
80% of the households in the entire
Australia had internet connectivity in 2016.
In general 76.7% of the homes in
Cranbourne community had internet
connection as compared to 84.0% in City of
Casey. However, 14.1% homes in
Cranbourne had no access to internet as
compared to 9.5% in city of Casey in the
year 2016
Resources & References
Australian Bureau of Statistics (2017). "Cranbourne (State Suburb)". 2016 Census QuickStats. Retrieved 4
September, 2018.
Braveman, P., & Gottlieb, L. (2014). The social determinants of health: it's time to consider the causes of the
causes. Public health reports, 129(1_suppl2), 19-31.
[Enter student name and number here] 12
Element 9: INTERACTION/ISOLATION
This element explores the way people communicate and interact with each other within this community. Is
this an interactive community, or do people keep to themselves? How do they communicate- local gathering
areas, internet access, local radio or television stations, newspapers/newsletters, etc? Is isolation an issue?
*How does this compare to other areas or to Victoria?
Fieldwork: Observations (include photos) Research Data and Comparisons (LGA)
Internet connection is important utility for
most household in Cranbourne. Most of the
households were able to access internet
connection.
Individuals within Cranbourne are involved
in different sporting clubs including
Cranbourne Football Club, the Cranbourne
Cricket Club, the Cranbourne Soccer Club,
and the Cranbourne Tennis Club.
Taken by me. (2018, September 6) Casey field
showing different sporting activities organised within
the community.Retrieved from
https://www.bing.com/images/search?q
=cranbourne+community+photos&q
Location: City of Casey field within the community
80% of the households in the entire
Australia had internet connectivity in 2016.
In general 76.7% of the homes in
Cranbourne community had internet
connection as compared to 84.0% in City of
Casey. However, 14.1% homes in
Cranbourne had no access to internet as
compared to 9.5% in city of Casey in the
year 2016
Resources & References
Australian Bureau of Statistics (2017). "Cranbourne (State Suburb)". 2016 Census QuickStats. Retrieved 4
September, 2018.
Braveman, P., & Gottlieb, L. (2014). The social determinants of health: it's time to consider the causes of the
causes. Public health reports, 129(1_suppl2), 19-31.
[Enter student name and number here] 12
⊘ This is a preview!⊘
Do you want full access?
Subscribe today to unlock all pages.
Trusted by 1+ million students worldwide
1 out of 20


Your All-in-One AI-Powered Toolkit for Academic Success.
+13062052269
info@desklib.com
Available 24*7 on WhatsApp / Email
![[object Object]](/_next/static/media/star-bottom.7253800d.svg)
Unlock your academic potential
Copyright © 2020–2026 A2Z Services. All Rights Reserved. Developed and managed by ZUCOL.