Summer 2019 ITEC2600 MATLAB Data Analysis Project Report
VerifiedAdded on 2022/10/16
|13
|1558
|283
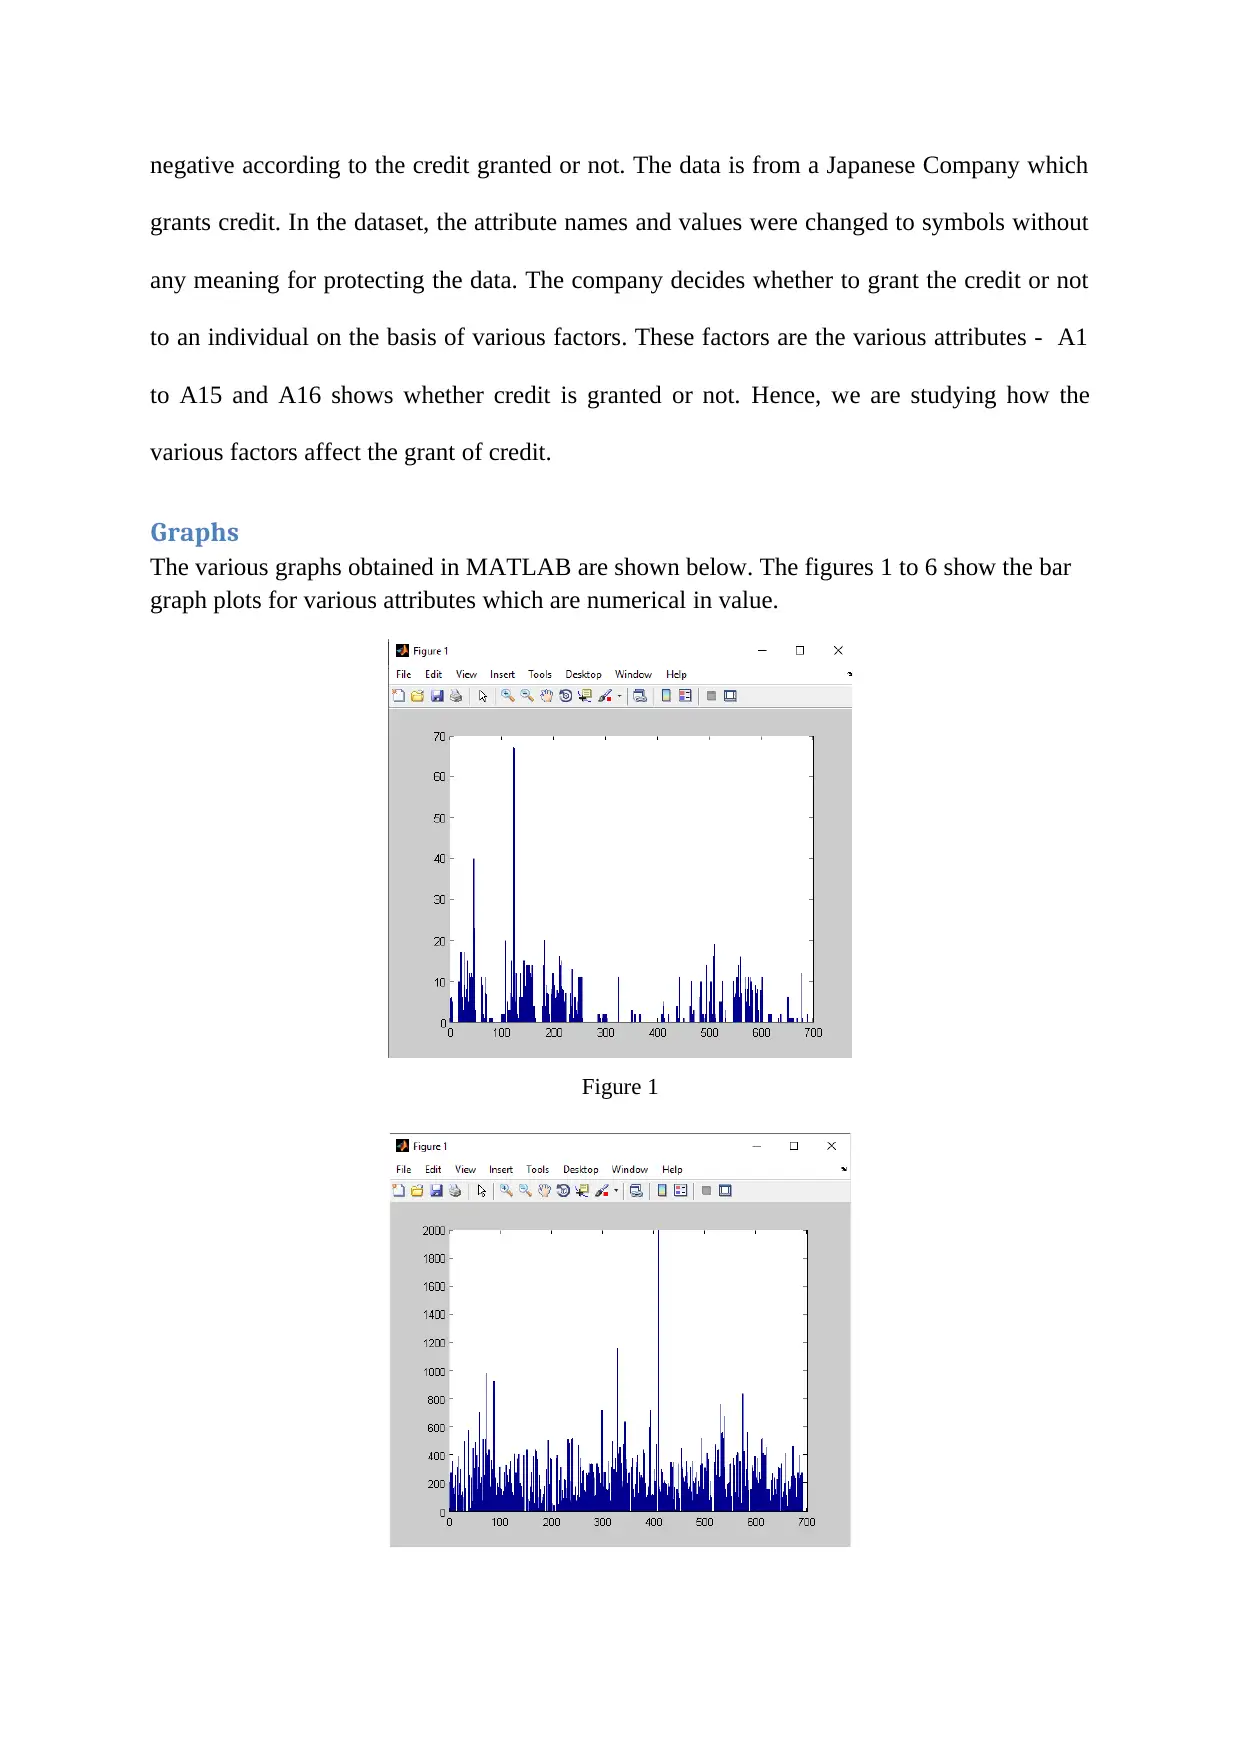
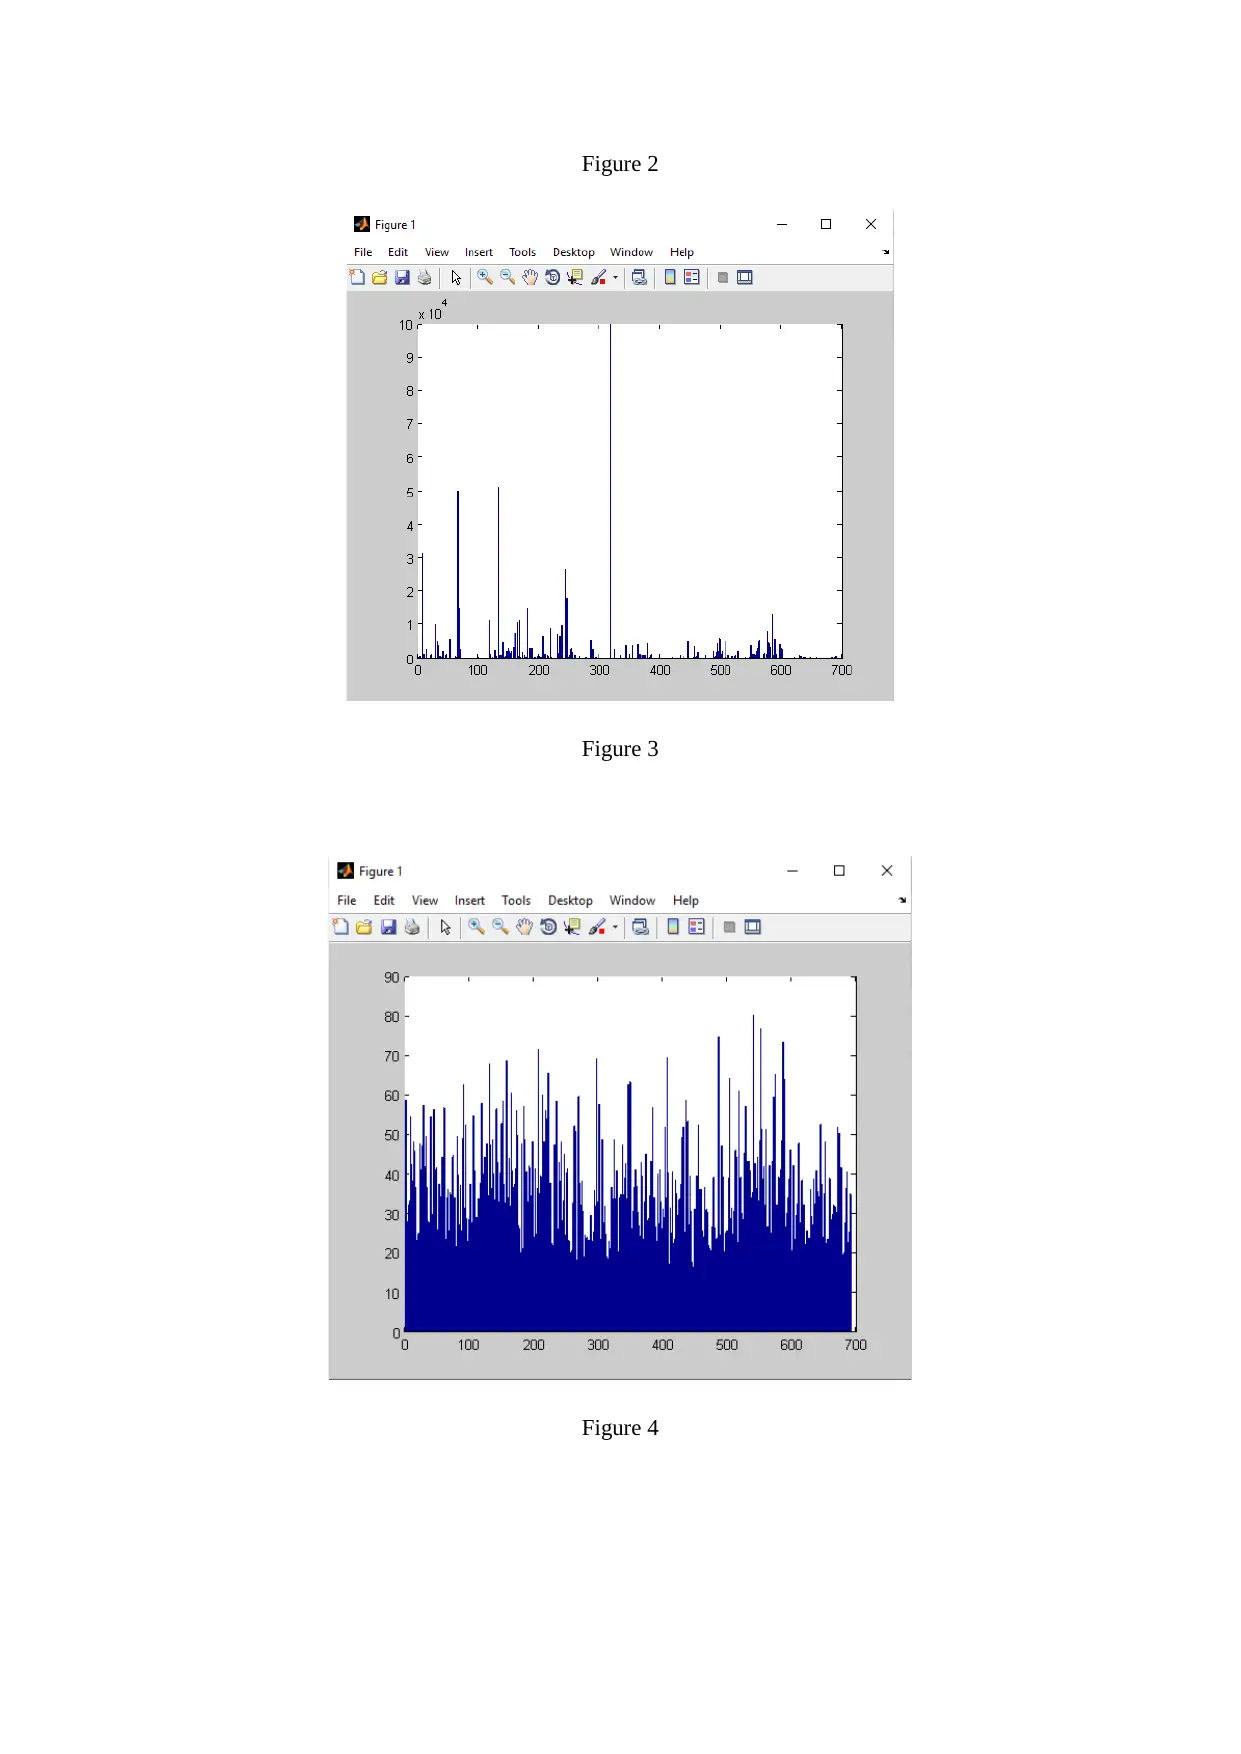
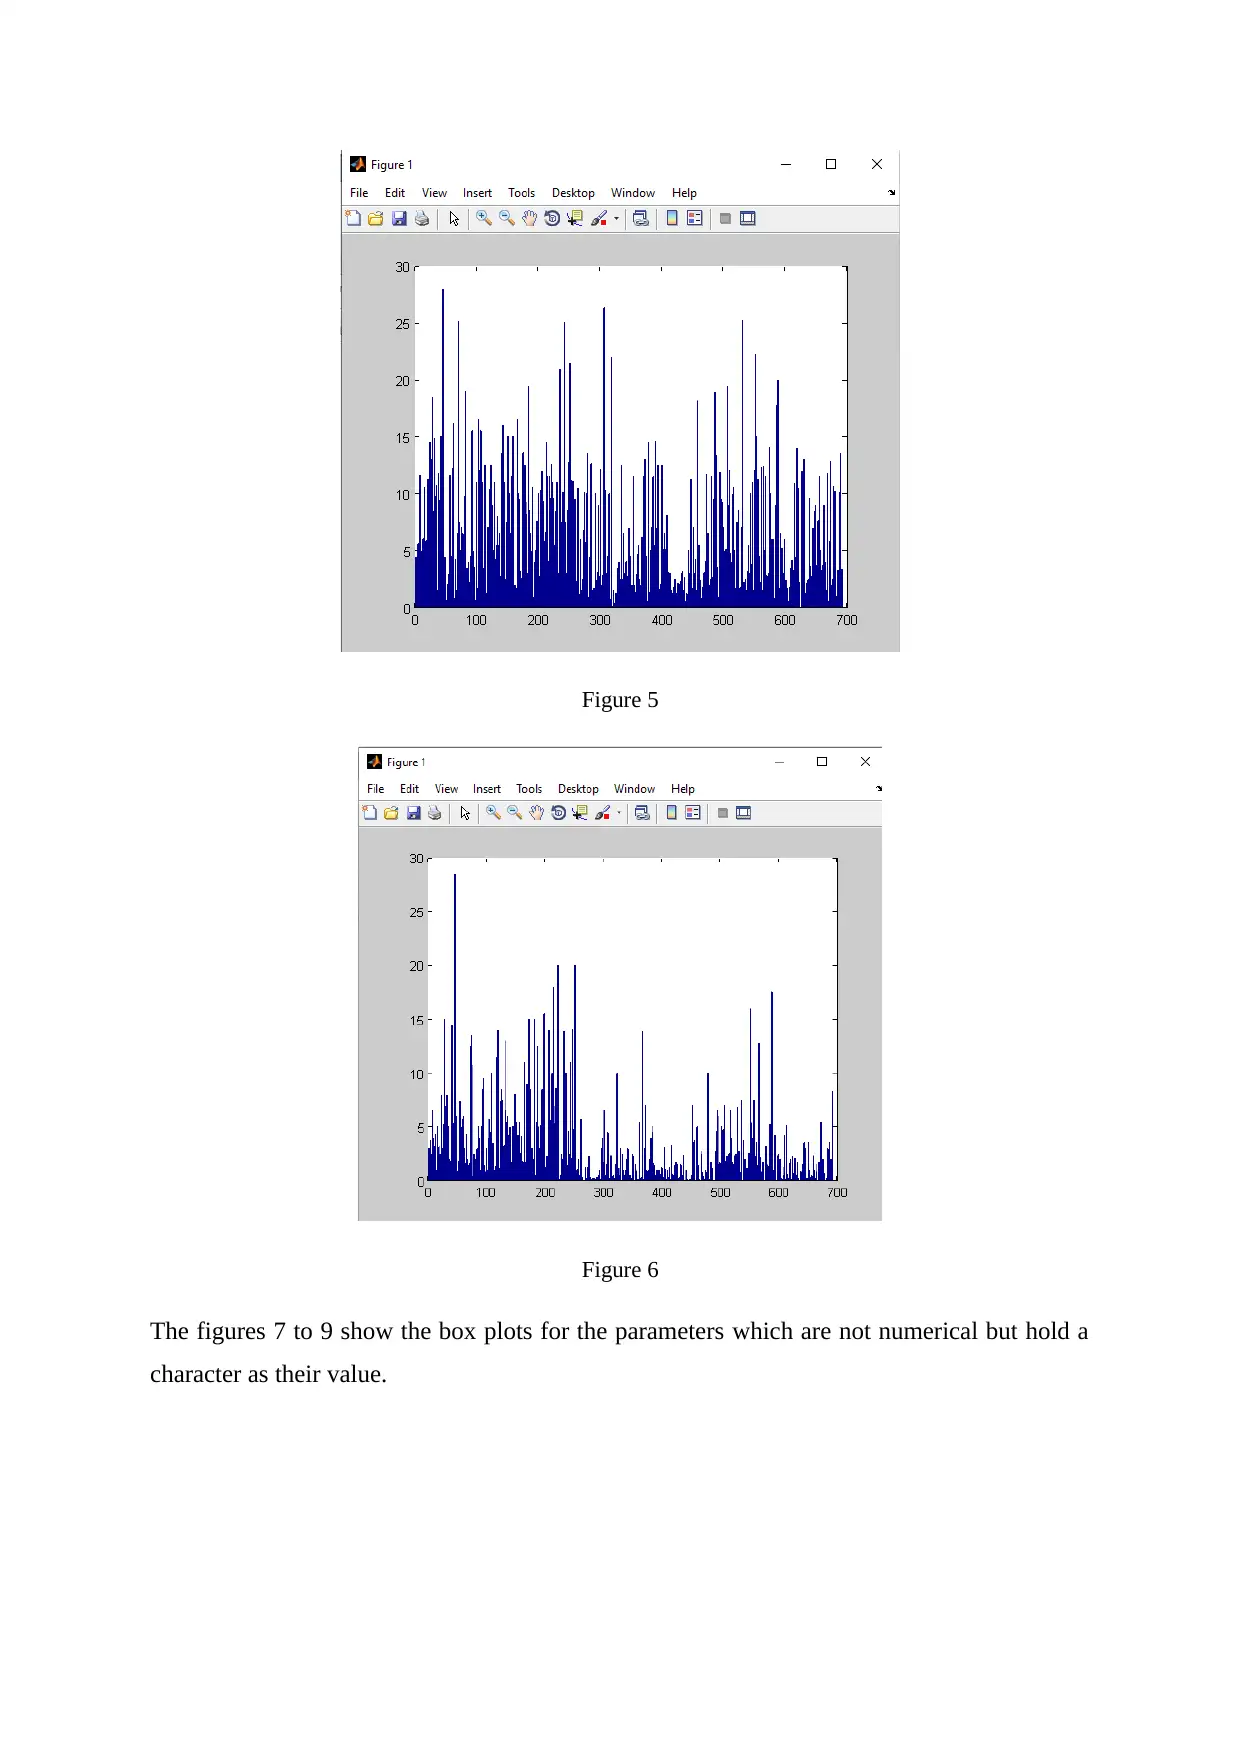
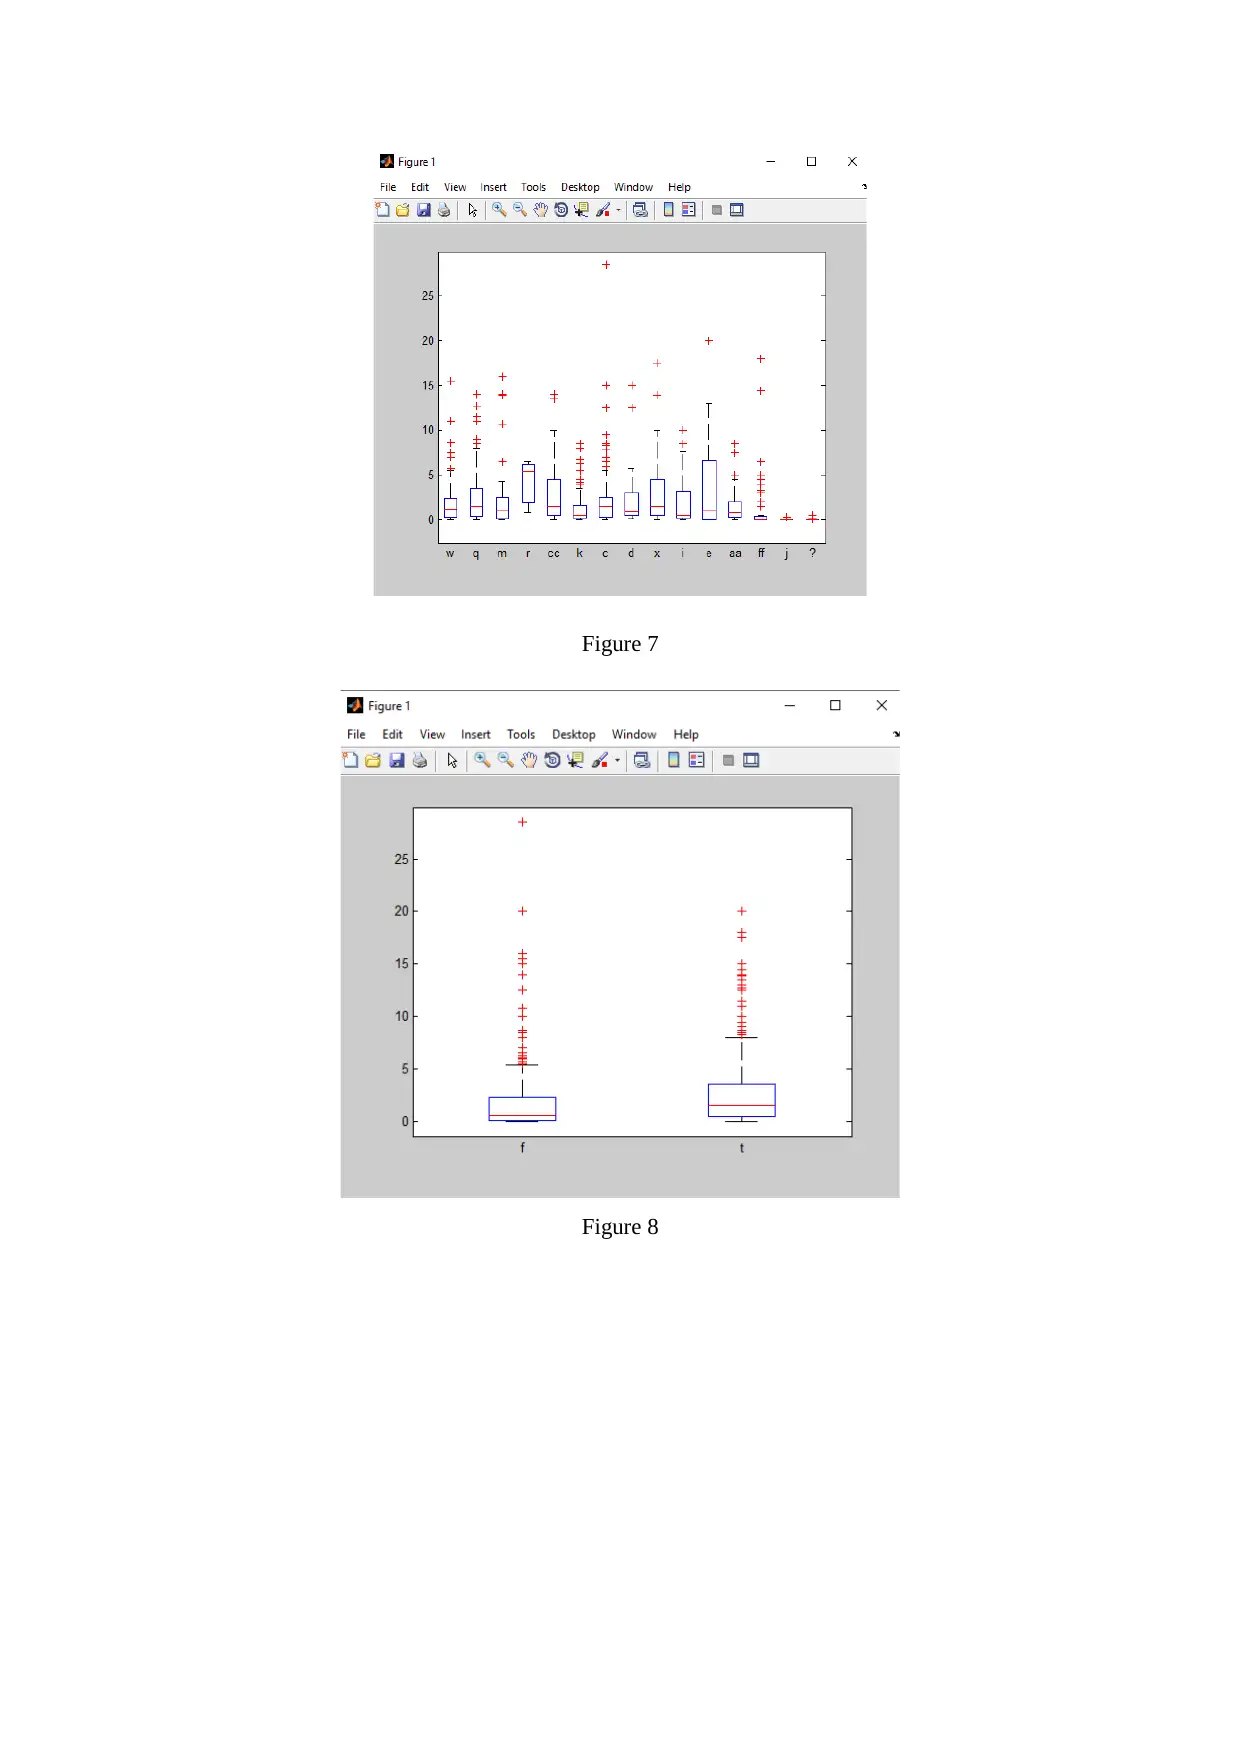
Project
AI Summary
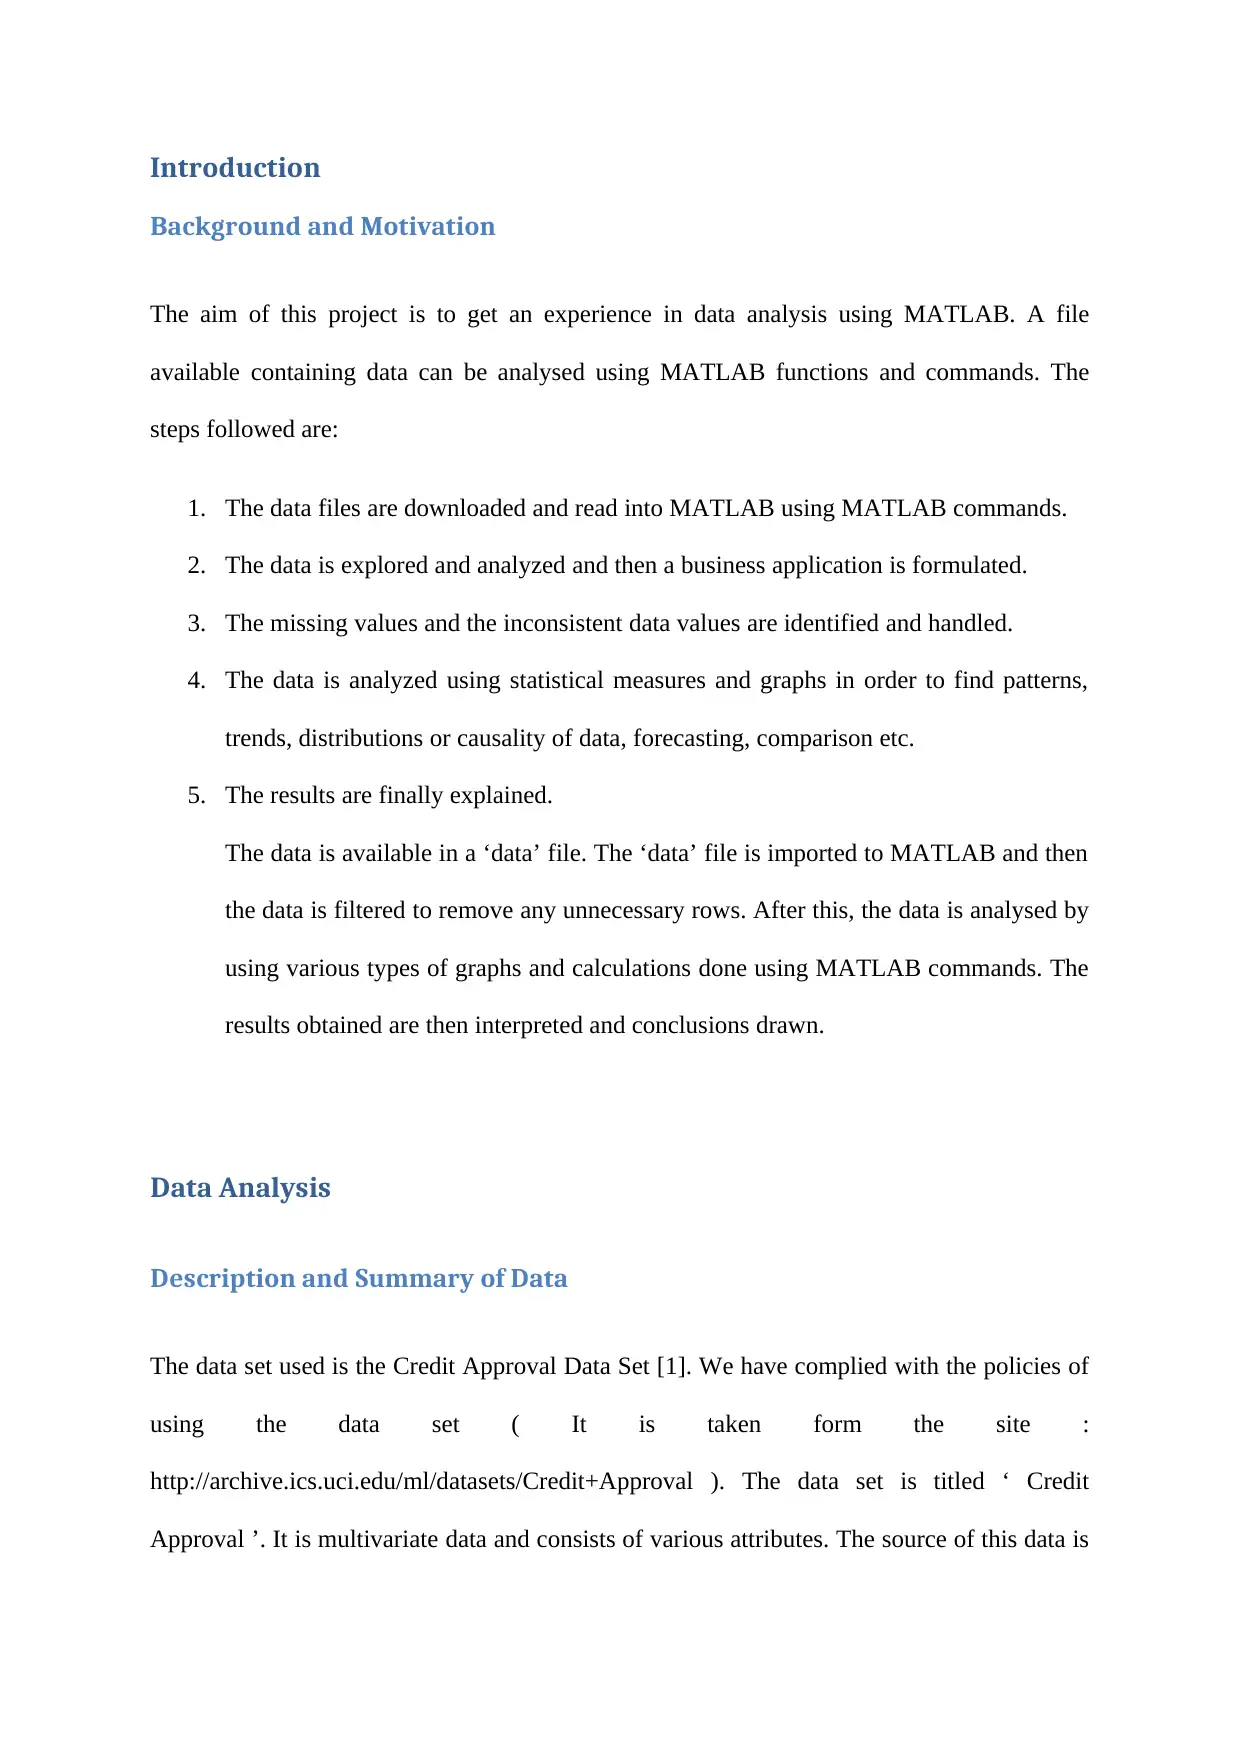
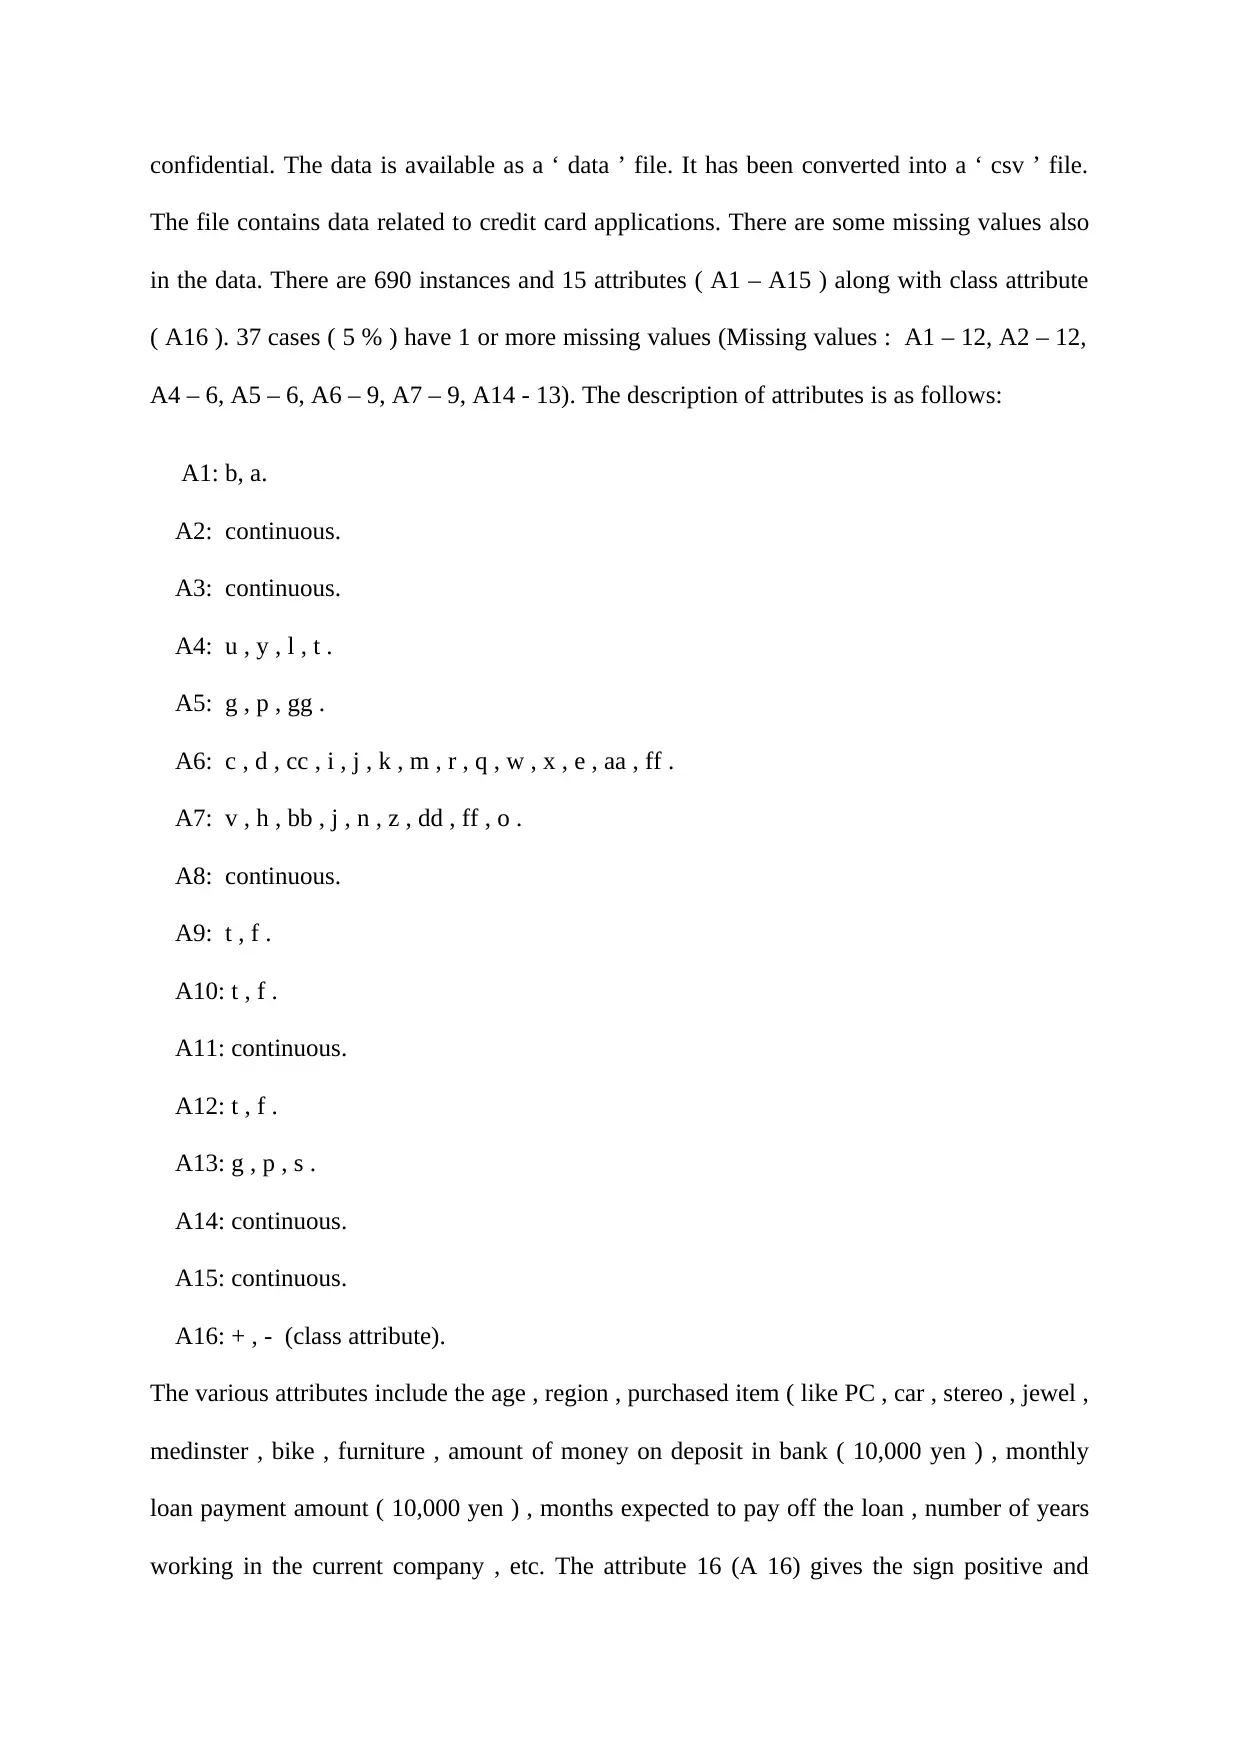
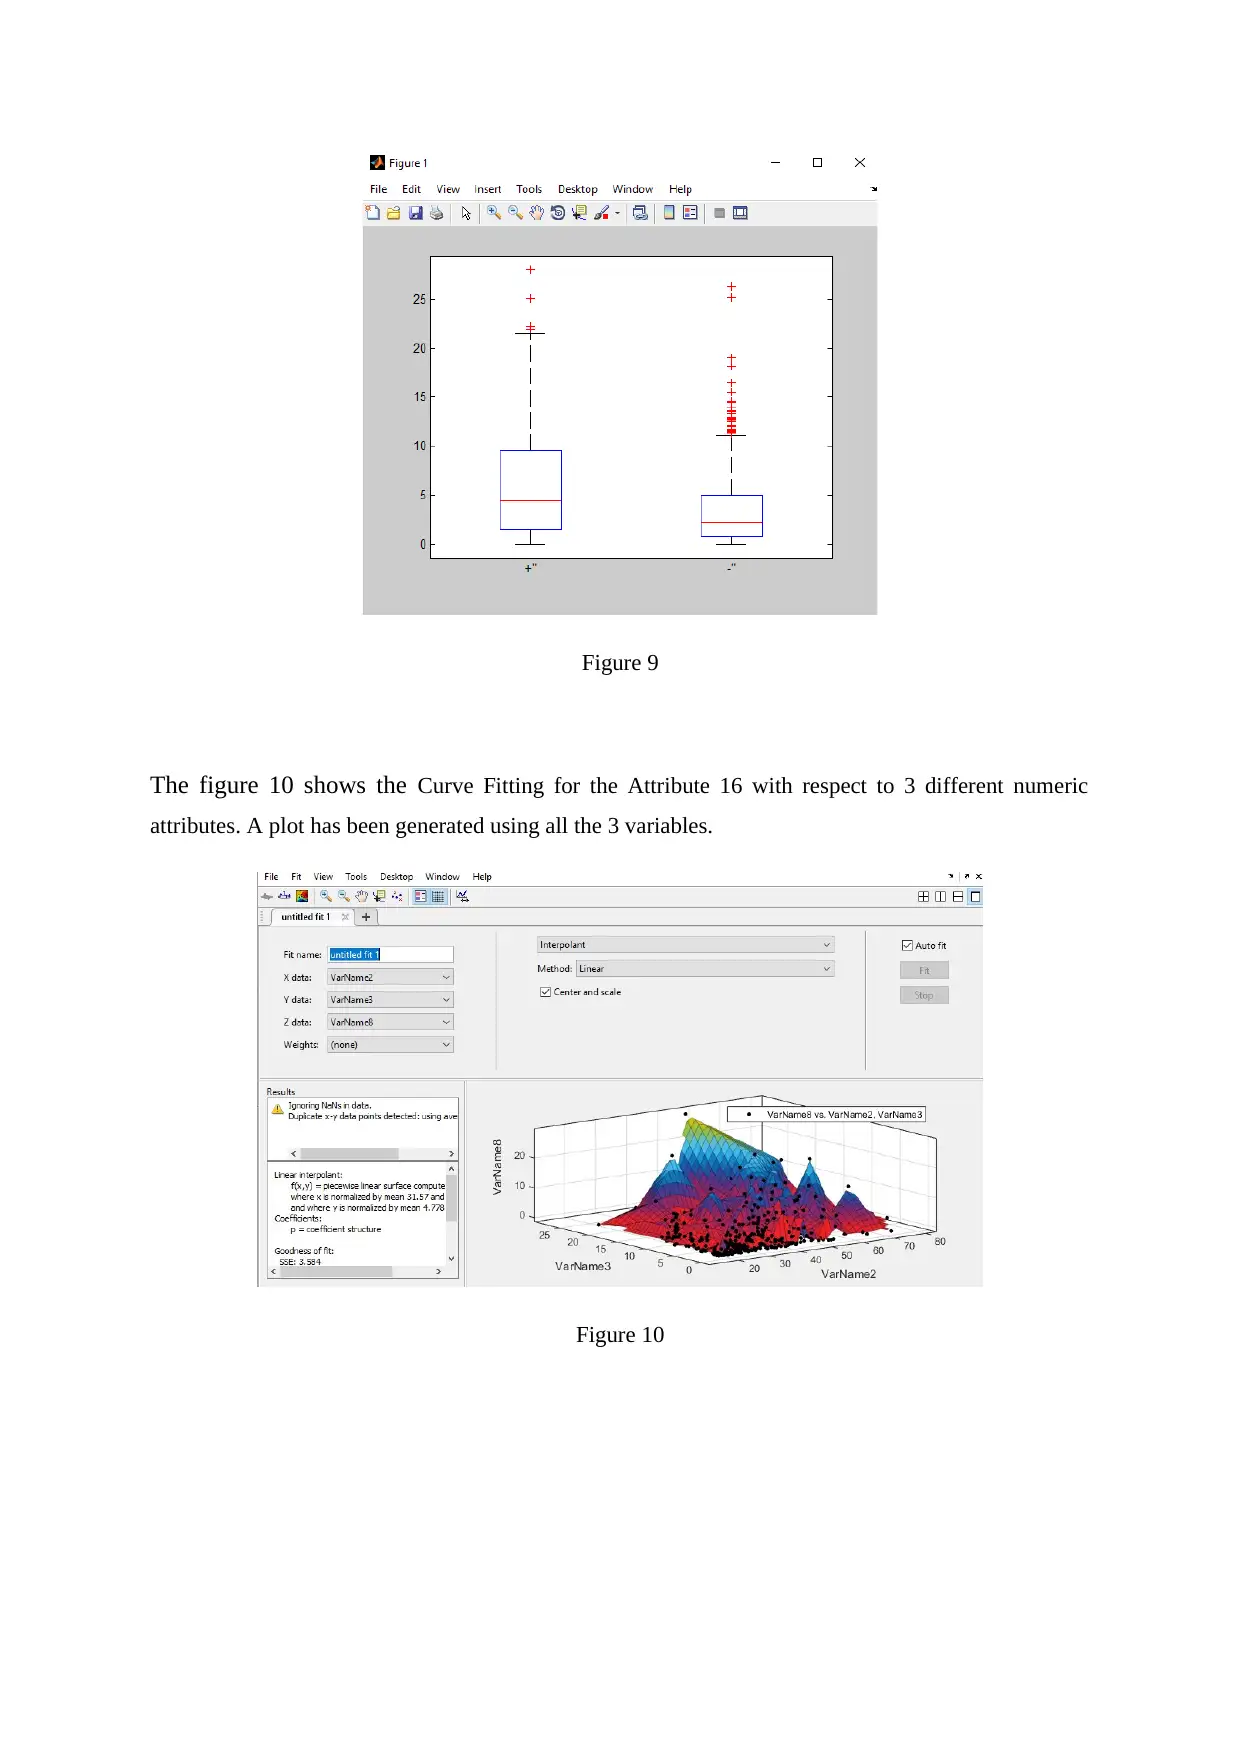
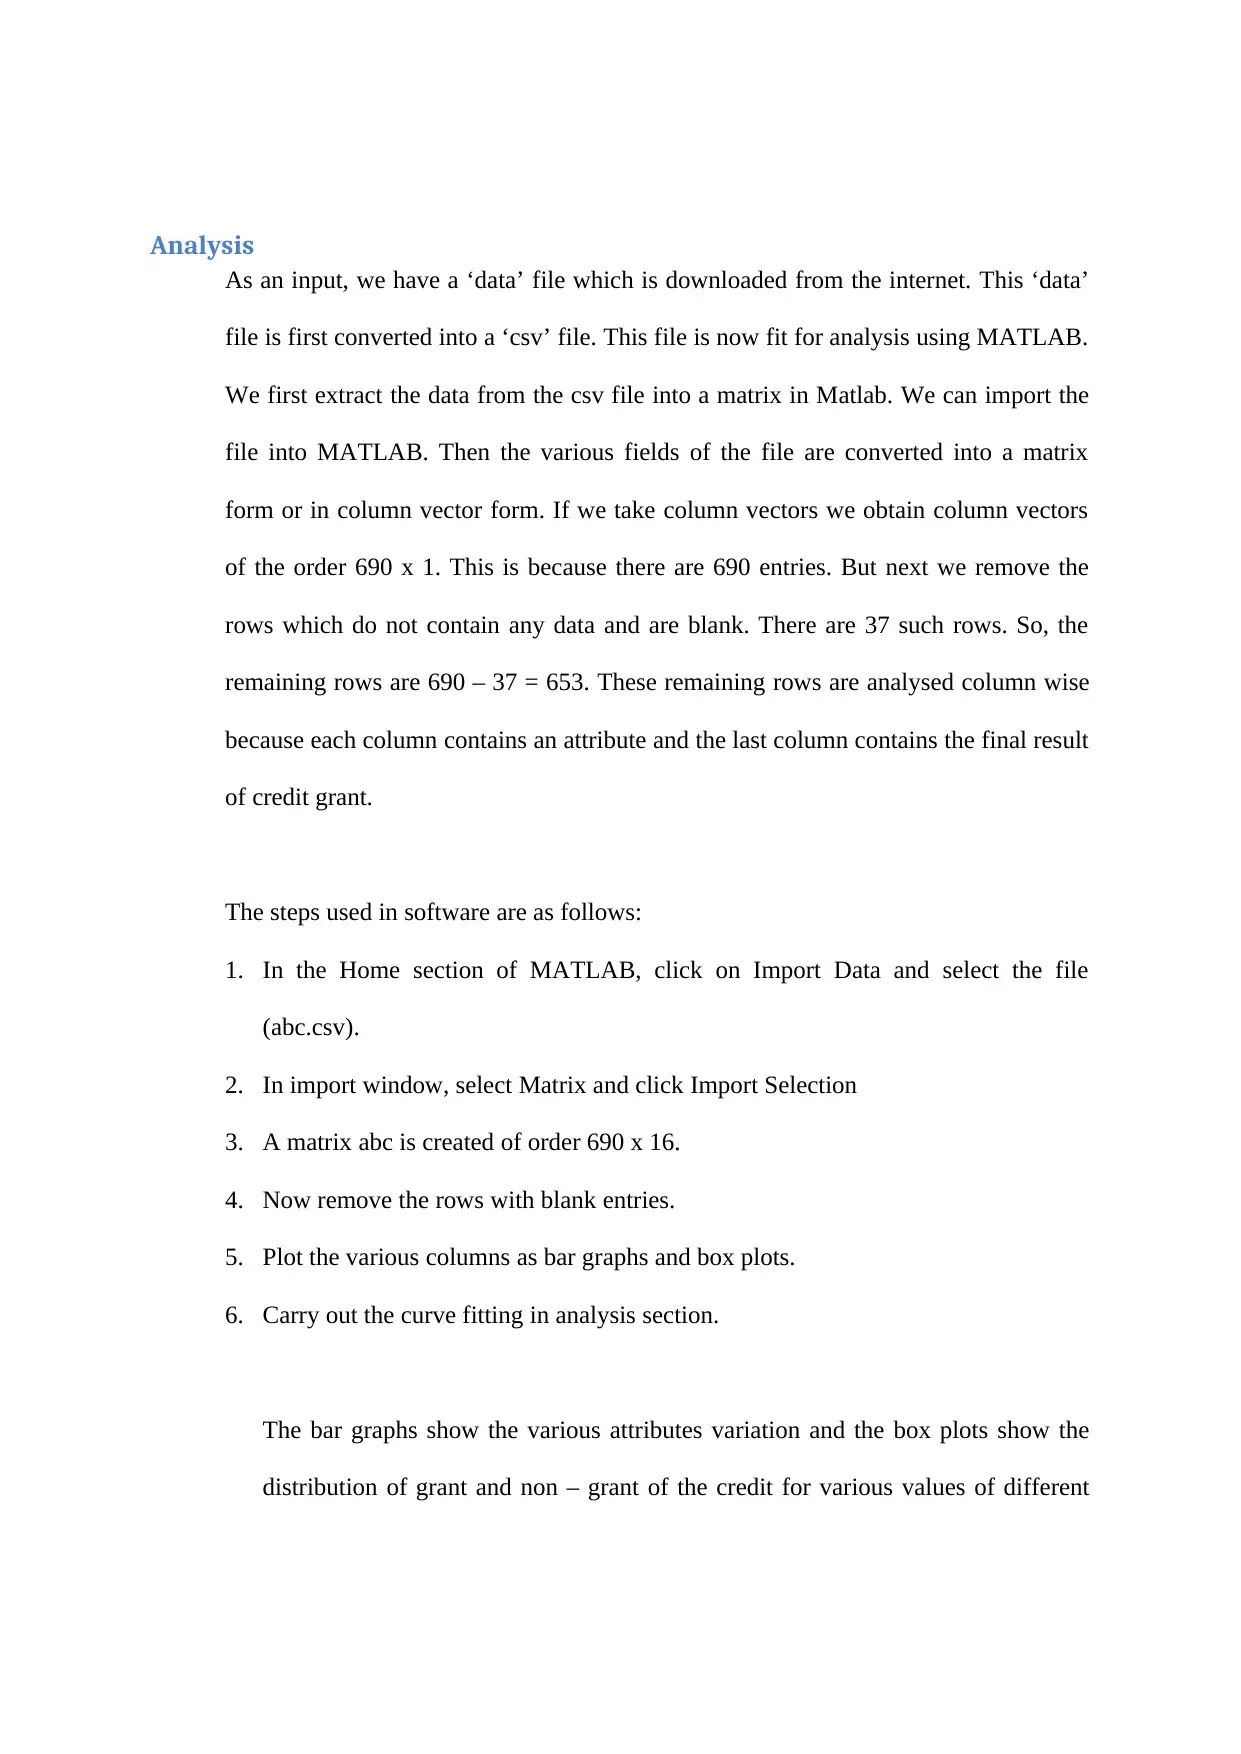
This project uses MATLAB to analyze the Credit Approval Data Set from the UCI Machine Learning Repository. The project begins by importing the data into MATLAB and converting it into a suitable format for analysis. The analysis includes cleaning the data to handle missing values and inconsistent data. Various graphs, including bar graphs, box plots, and curve fitting, are generated to visualize the data and identify patterns. Statistical measures are calculated to find trends and distributions within the dataset. The analysis explores the relationship between different attributes and the credit approval outcome, leading to conclusions about the factors influencing credit grant decisions. The report details the steps followed, the commands used in MATLAB, the observations made from the graphs, and the final conclusions drawn from the analysis. The project aims to provide practical experience in data analysis using MATLAB, with a focus on real-world applications in the credit approval domain.
1 out of 13


Your All-in-One AI-Powered Toolkit for Academic Success.
+13062052269
info@desklib.com
Available 24*7 on WhatsApp / Email
![[object Object]](/_next/static/media/star-bottom.7253800d.svg)
Copyright © 2020–2026 A2Z Services. All Rights Reserved. Developed and managed by ZUCOL.